
Dividend Snapshot
Company
TCPL Packaging Ltd
NSE / BSE
TCPLPACK / 523301
Dividend Type
Final Dividend
Financial Year
FY 2025-26
Dividend / Share
₹25.00
Dividend %
250% (on ₹10 FV)
Announcement
28 May 2026
Record Date
04 Aug 2026
Ex-Date *
04 Aug 2026 (inferred)
Payment *
Within 30 days of AGM
Current Yield *
~0.78%
Payout Ratio
23.3%
* Ex-date, payment date and yield are inferred / market-linked and must be re-verified at publish time (see Key Dates and Yield sections).
Dividend Announcement Summary
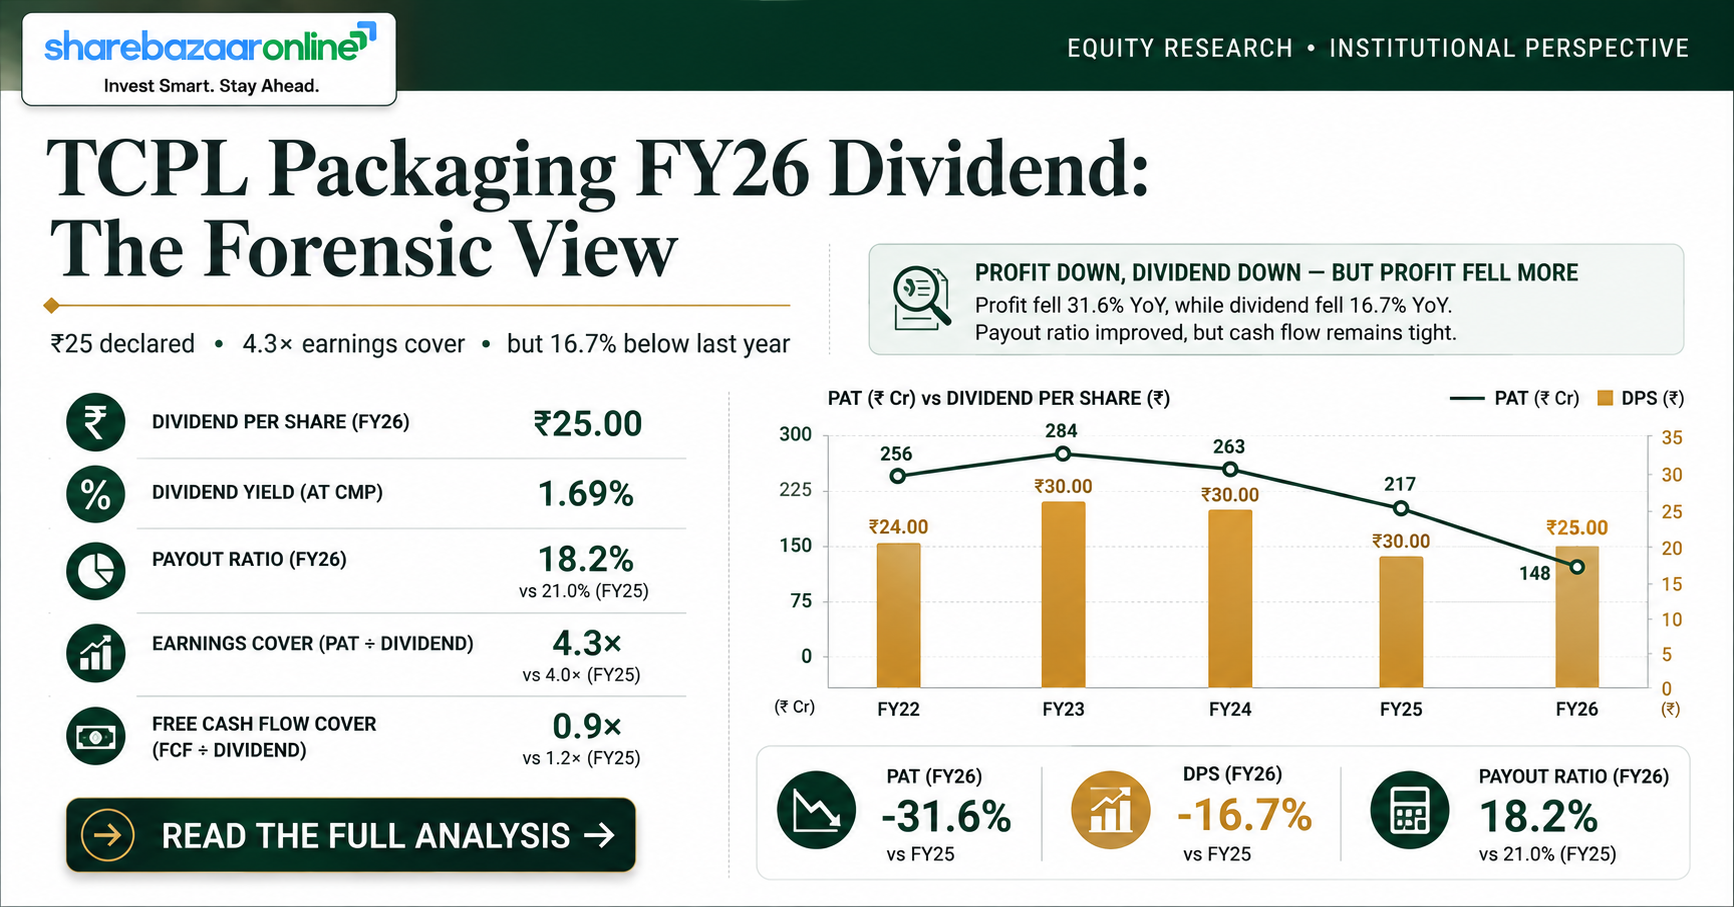
At its board meeting on 28 May 2026, the Board of Directors of TCPL Packaging Limited recommended a final dividend of ₹25 per equity share (250% of the ₹10 face value) for the financial year ended 31 March 2026. The company follows a single annual-dividend policy — it does not pay interim dividends — so this ₹25 is the full-year payout.
The dividend is not yet final. It requires shareholder approval at the 38th Annual General Meeting on 11 August 2026. Only once members declare the dividend does it become payable — a distinction retail investors often overlook when a board "recommends" a figure.
Total cash leaving the company
On 91,00,000 shares (equity capital ₹9.10 crore ÷ ₹10 face value), the total dividend outflow works out to ₹22.75 crore. That is a modest cheque relative to the ₹97.80 crore the group earned this year — the company is retaining roughly three-quarters of its profit to fund a capex-heavy, debt-funded growth plan.
Key Dates Timeline
Dividend Yield Analysis
Yield at recent market price
~0.78%
₹25 ÷ ~₹3,209 (latest available close, late-July 2026 — re-verify at publish)
Yield around announcement
~1.0%
₹25 ÷ ~₹2,500 (approx price near 28 May 2026 — Not Independently Verified)
Read the yield carefully. TCPL is a low-yield, growth-oriented small cap, not an income stock. Even the ₹25 dividend translates to well under 1% at current prices. The reason the "yield" looks slightly higher at some points in the past year is not generosity — it is the share price, which swung between ₹2,200 and ₹3,950 over 52 weeks. A falling price mechanically lifts yield; a rising price lowers it. Because the price nearly doubled off its low, the current yield has compressed. Investors buying this stock are paying for growth and re-rating potential, not dividend income.
Dividend History Analysis
| Financial Year | Dividend / Share | Change YoY | Face Value |
|---|---|---|---|
| FY26 (this event) | ₹25.00 | −16.7% (cut) | ₹10 |
| FY25 | ₹30.00 | +36.4% | ₹10 |
| FY24 | ₹22.00 | +10.0% | ₹10 |
| FY23 | ₹20.00 | +100% | ₹10 |
| FY22 | ₹10.00 | +36.1% | ₹10 |
| FY21 | ₹7.35 | +83.8% | ₹10 |
| FY20 | ₹4.00 | −23.8% (cut) | ₹10 |
| FY19 | ₹5.25 | +41.9% | ₹10 |
| FY18 | ₹3.70 | — | ₹10 |
Dividends mapped to the financial year they relate to (declared the following year). Source: exchange corporate-action records / TipRanks; verify FY-mapping against annual reports.
Classification: Consistent but Cyclical Payer
TCPL has paid a dividend every year for at least nine years — that consistency of payment is a genuine strength. But the amount is earnings-linked, not fixed: it flexes up in strong years and down in weak ones. This is the second cut in six years (the first was FY20, the COVID year).
Why the FY25 ₹30 was the outlier
FY25 profit was an unusually strong ₹143 crore. FY26 profit normalised to ₹97.8 crore — close to FY24's ₹99.4 crore. The dividend simply tracked profit back down. Anchoring to ₹30 as the "normal" level would be a mistake; ₹22-25 looks more like the run-rate.
Financial Performance Analysis
Consolidated, FY26 vs FY25 (₹ crore)
| Metric | FY26 | FY25 | Change |
|---|---|---|---|
| Revenue from operations | 1,810 | 1,770 | +2.3% |
| Operating EBITDA | 292 | 293 | −0.3% |
| Profit before tax | 141 | 174 | −18.6% |
| Net profit (PAT) | 98 | 143 | −31.6% |
| EPS (₹) | 107.47 | 157.16 | −31.6% |
The non-obvious finding: revenue grew, but profit collapsed — and it happened below the EBITDA line
Wire services will headline "profit down 31.6%". The real story is where the profit went. Sales rose 2.3% and operating EBITDA was essentially flat (−0.3%) — so the operating business held up. The ₹45-crore drop in net profit was driven almost entirely by four items beneath operating profit:
- Finance costs +36.2% (₹58 cr → ₹79 cr) — the single biggest drag, reflecting higher borrowings to fund capacity expansion.
- Depreciation +10.3% (₹75 cr → ₹83 cr) — new plants (including the Chennai greenfield) hitting the P&L.
- A one-time exceptional charge of ₹13.79 crore — a provision for the new Labour Codes notified in November 2025 (zero in FY25).
- An adverse deferred-tax swing of ~₹18 crore — FY25 had a ₹9.2 cr deferred-tax credit; FY26 carries an ₹8.8 cr charge.
Employee costs also rose 13.7% (₹167 cr → ₹190 cr). Net margin fell from 8.1% to 5.4%. The key takeaway for dividend investors: the profit fall is a mix of expansion costs (finance + depreciation) that should pay off later and one-off/non-cash items (exceptional + deferred tax) — not a collapse in the underlying packaging business.
Cash Flow Analysis
Cash quality is the good news
Here reported profit and cash diverge in the company's favour. Net profit was ₹98 cr, but OCF was ₹290 cr — nearly 3× profit — because the big depreciation charge is non-cash and working capital released cash (receivables fell). Even after ₹148 cr of capex, free cash flow was ₹141 cr, covering the ₹22.75 cr dividend 6.2×.
How is the dividend actually funded?
This year, the dividend is funded from genuine current cash generation, not reserves or borrowings — FCF of ₹141 cr dwarfs the ₹22.75 cr payout. That is a meaningful improvement: in earlier years the dividend was a much larger share of free cash flow (in the FY23 cycle it was reported at over 100% of FCF), because heavy capex was consuming most operating cash. This year's receivables release and lighter net capex gave the payout a real cash cushion. Watch this ratio — if capex re-accelerates, FCF cover can tighten again.
Balance Sheet Strength
Dividend Sustainability Analysis
Four-test scorecard (₹22.75 cr dividend outflow)
₹107.47 EPS vs ₹25 DPS — strong
₹290 cr OCF vs ₹22.75 cr — very strong
₹141 cr FCF vs ₹22.75 cr — comfortable
₹20 cr cash vs ₹22.75 cr — thin buffer
Verdict: Sustainable
Three of four tests pass comfortably. The dividend is a small fraction of both earnings (23% payout) and free cash flow. The one flag is that TCPL keeps very little idle cash, so the payout depends on the business continuing to generate cash each year — it has no large reserve to fall back on. Watch flags: (a) the DPS itself is not fixed and has just been cut, so "sustainable" refers to the ₹25 level, not a guarantee of growth; (b) rising interest costs and any capex re-acceleration are the two things that could pressure future FCF cover.
Peer Comparison
| Company | Div/Share | Yield* | Payout | ROE | Net D/E |
|---|---|---|---|---|---|
| TCPL Packaging | ₹25 | ~0.78% | 23.3% | ~14.4% | 0.77× |
| AGI Greenpac | — | — | — | — | — |
| EPL Ltd | — | — | — | — | — |
| Huhtamaki India | — | — | — | — | — |
| Uflex Ltd | — | — | — | — | — |
Peer cells left blank where figures cannot be verified from primary sources at time of writing. To be completed by the desk from each peer's latest audited results before publishing. *Yield re-verify at publish.
On a relative basis, TCPL screens as a low-yield, moderately-leveraged, growth packaging name. Its ~0.78% yield is below what a pure income investor looks for; the sector generally is not a high-dividend space, as most listed packaging players reinvest for capacity. TCPL's payout discipline (~20-25%) is conservative and leaves room to grow the dividend when earnings recover. Its 0.77× net debt/equity sits in the middle of the peer range — more leveraged than debt-light converters, less than the most aggressive expanders.
Promoter Impact Analysis
The Kanoria-family promoter group owns roughly 55.7%, so about ₹12.67 crore of the ₹22.75 crore dividend flows to promoters. That said, the alignment cuts both ways: a promoter cutting the dividend from ₹30 to ₹25 is reducing its own cash take, which supports the read that the cut is about earnings and reinvestment, not extracting cash. Notably, a promoter-group entity (Narmada Fintrade) increased its stake via open-market purchases in late June 2026 — a signal of insider confidence rather than cash-out.
Taxation Analysis
Since the 2020 abolition of the Dividend Distribution Tax, dividends in India are taxed in the hands of the investor at their slab rate. There is no separate tax-free treatment. Additionally, if your total dividend from a single company in a year exceeds ₹5,000, the company deducts TDS at 10% under Section 194 (you can lower this to nil by filing Form 15G/15H if eligible, or claim it back when filing your return). NRIs face higher TDS (20% plus surcharge/cess, subject to DTAA relief).
Worked example — retail investor with 1,000 shares (30% slab)
| Gross dividend (1,000 × ₹25) | ₹25,000 |
| TDS @10% deducted at source (dividend > ₹5,000) | ₹2,500 |
| Total tax @30% + 4% cess (slab) | ₹7,800 |
| Net dividend in hand | ₹17,200 |
| Effective post-tax yield (@ ~₹3,209) | ~0.54% |
The TDS of ₹2,500 is not an extra cost — it is adjusted against the ₹7,800 total liability. A 5%- or 20%-slab investor pays less. This is illustrative, not tax advice.
Key Risks
1. Rising interest burden. Finance costs jumped 36% to ₹79 cr and are the main reason profit fell. With ₹575 cr of gross debt, any rate increase or fresh borrowing directly erodes profit and dividend capacity.
2. Earnings-linked, variable dividend. TCPL has now cut the dividend twice in six years. The DPS is not a floor — a weaker year could bring another reduction.
3. Thin cash buffer. Only ₹20 cr cash against ₹22.75 cr dividend and ₹575 cr debt. The payout relies on continuous cash generation, with little cushion if a year turns weak.
4. Input-cost & margin pressure. Paperboard and raw-material costs (cost of materials is ~58% of revenue) plus a 13.7% rise in employee costs compressed net margin from 8.1% to 5.4%.
5. Regulatory / Labour Codes. The ₹13.79 cr exceptional charge is an early estimate; final Central/State rules could bring further employee-cost obligations, an ongoing overhang management itself flags.
6. Customer & working-capital concentration. Trade receivables of ₹460 cr are large relative to profit; a slowdown at key FMCG/pharma/tobacco clients would hit both cash flow and the dividend cushion.
What To Monitor
1. Finance-cost trajectory. Whether interest costs peak and start falling as capex-cycle borrowings are repaid — the key to profit recovery.
2. FCF vs capex. Whether free cash flow stays comfortably above the dividend as new plants (e.g. Chennai greenfield) ramp; a capex re-acceleration would tighten cover.
3. EBITDA margin. Whether the ~16% operating margin holds or rebuilds — the difference between a normalising year and a structural de-rating.
4. Net-debt direction. Whether net debt of ₹555 cr trends down; deleveraging would free up profit and support higher future dividends.
5. Next year's DPS decision. Whether the FY27 dividend resumes growth or holds — the clearest signal of management's confidence in the earnings recovery.
6. Promoter & institutional activity. Continued promoter buying (as seen in June 2026) vs any selling, and DII/FII trends around results.
Conclusion
Positives
Dividend paid every year for 9+ years; well covered by earnings (4.3×) and free cash flow (6.2×); conservative ~23% payout; operating EBITDA held flat despite a tough year; unqualified audit; promoter buying in the open market.
Negatives
The dividend was cut 16.7% (₹30 → ₹25); net profit fell 31.6% and ROE nearly halved to ~14.4%; ₹79 cr interest bill and ₹555 cr net debt; only ₹20 cr cash on hand; yield under 1%.
TCPL Packaging's FY26 dividend tells a nuanced story that a one-line "250% dividend declared" headline hides. The ₹25 is a cut from a peak, not a distress signal — the operating business is intact, cash generation is strong, and the payout is safe at this level. But this is a growth-and-reinvestment stock with a small, earnings-linked dividend, not an income play. Investors should weigh the positives, negatives, risks and monitoring points above and decide based on their own goals.
Frequently Asked Questions
What dividend has TCPL Packaging announced for FY2025-26?
Is the ₹25 dividend higher or lower than last year?
What is the dividend yield?
What is the record date?
What is the ex-date?
When will the dividend be paid?
Who is eligible to receive the dividend?
How is this dividend taxed?
Is the TCPL Packaging dividend sustainable?
Why did profit fall so much if revenue rose?
Does TCPL Packaging pay interim dividends?
How much of the dividend goes to promoters?
What should investors monitor after this dividend?
Should I buy TCPL Packaging for its dividend?
Disclaimer
This article is published by ShareBazaar Online for informational and educational purposes only and does not constitute investment advice, a recommendation, or an offer to buy or sell any security. ShareBazaar Online is not a SEBI-registered investment adviser. Dividend figures are as per the company's exchange filing dated 28 May 2026; the dividend is subject to shareholder approval at the AGM. Market prices, yields, ex-dates and payment dates are indicative, may be inferred, and must be independently verified before acting. Financial ratios are derived from the company's audited FY2025-26 consolidated and standalone results and may differ from third-party databases. Figures labelled "approx", "inferred" or "Not Independently Verified" carry additional uncertainty. Investing in equities involves risk, including loss of capital. Readers should conduct their own research and consult a SEBI-registered financial adviser before making any investment decision. Past dividend or price performance is not indicative of future results.