
Dividend Snapshot
Company: Andhra Paper Limited
NSE / BSE: ANDHRAPAP (EQ) / 502330
CIN: L21010AP1964PLC001008
Sector: Paper & Paper Products (Materials)
Face Value: ₹2 per share (post 1:5 split, May 2024)
Dividend Type: Final Dividend (FY 2025-26)
Dividend Per Share: ₹0.50 (i.e. 25% of face value)
Dividend Yield: 0.82% (at CMP ₹61.03)
Record / Ex Date: 04 August 2026
Total Outflow: ₹9.94 Cr (approx.)
In one line: Andhra Paper has recommended a ₹0.50 final dividend for FY26 — but this is a 50% cut from last year's ₹1.00 and the smallest payout in at least six years. The reason matters more than the number: reported profit collapsed 79% to ₹18.62 Cr, and a large slice of that profit is investment income, not paper-making. This dividend is subject to shareholder approval at the 62nd AGM.
Dividend Announcement Summary
At its board meeting held on 14 May 2026 (2:45 PM to 4:14 PM), the Board of Directors of Andhra Paper Limited recommended a final dividend of ₹0.50 per equity share of ₹2 face value each, fully paid up, representing 25% of face value, for the financial year 2025-26.
The recommendation was disclosed under Regulation 30 of SEBI (LODR) Regulations, 2015. The dividend is subject to the approval of members at the ensuing 62nd Annual General Meeting. If approved, it will be paid within the statutory time limit prescribed under the Companies Act, 2013 (i.e. within 30 days of declaration at the AGM).
In the same set of results, the Board also approved the re-appointment of Mr. Saurabh Bangur as Managing Director for five years from 1 October 2026, subject to shareholder approval.
Sourcing note: Dividend quantum, face value and board timing are taken directly from the company's BSE/NSE intimation dated 14 May 2026. The record date of 04 August 2026 was later confirmed via the 62nd AGM notice / exchange corporate-action data and should be re-verified against the exchange circular before publishing.
Key Dates Timeline
Announcement / Board Meeting:
14 May 2026
Record Date:
04 August 2026
Ex-Dividend Date:
04 August 2026 (Under T+1 settlement, ex-date and record date fall on the same day.)
62nd AGM & Approval:
To be held in the AGM season; dividend requires member approval before it becomes payable.
Payment Date:
Not separately disclosed by company. Statutory outer limit: within 30 days of declaration at the AGM (Companies Act, 2013).
Eligibility rule: To receive this dividend, you must hold shares in your demat account as of the record date, 04 August 2026. Because Indian equities settle on a T+1 basis, you needed to have bought the shares on or before 01 August 2026 (the last cum-dividend trading day) to be on the register by the record date.
Dividend Yield Analysis
Yield at latest CMP (₹61.03): 0.82%
Yield on announcement day (₹65.10): 0.77%
Yield = Dividend Per Share ÷ Market Price. CMP of ₹61.03 is the NSE close on 31 July 2026 and must be re-verified at publish time.
A 0.82% yield is modest. For context, the stock is down about 21% over the past year and trades near its 52-week low band (52-week range roughly ₹58–₹87). So the yield has held up only because the company cut the dividend broadly in line with the falling share price — not because the payout is generous.
Yield reality check: There is no "high yield trap" here — the yield is genuinely low. The more useful signal is that a company sitting on a large cash/investment pile (which threw off roughly ₹82 Cr of other income) is choosing to distribute only ₹9.94 Cr. Management is conserving cash to fund its capital expenditure programme rather than reward shareholders. That is a capital-allocation choice, discussed further below.
Dividend History Analysis
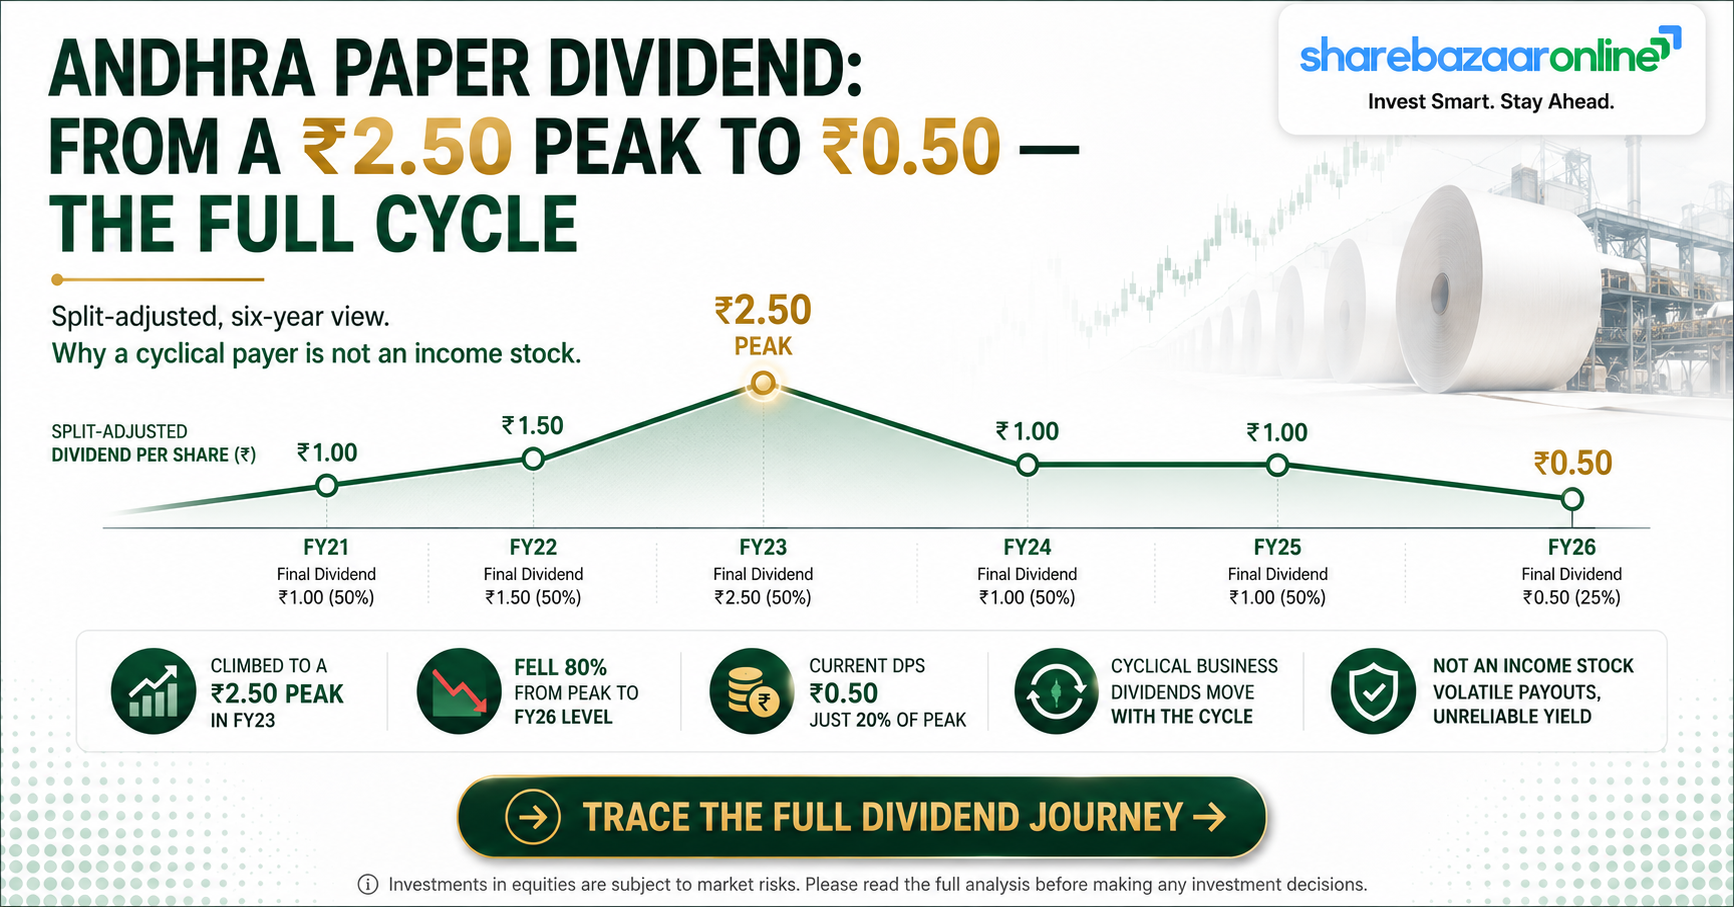
Andhra Paper split its shares 1:5 in May 2024 (face value ₹10 → ₹2). Naive year-on-year comparison of the raw rupee dividend would be misleading, so the table below restates every year on a split-adjusted ₹2 face-value basis (per Ind AS 33) for a like-for-like view.
| Financial Year | Dividend (as declared) | Face Value then | Adjusted to ₹2 FV | YoY Change |
|---|---|---|---|---|
| FY21 | ₹5.00 | ₹10 | ₹1.00 | — |
| FY22 | ₹7.50 | ₹10 | ₹1.50 | +50% |
| FY23 | ₹12.50 | ₹10 | ₹2.50 | +67% |
| FY24 | ₹10.00 | ₹10 | ₹2.00 | -20% |
| FY25 | ₹1.00 | ₹2 | ₹1.00 | -50% |
| FY26 | ₹0.50 | ₹2 | ₹0.50 | -50% |
Historical raw dividends compiled from public dividend records (TipRanks / Simply Wall St / exchange data). Adjusted column computed by ShareBazaar Online. Raw figures Not Independently Verified against each year's original filing.
Verdict — Cyclical / Irregular Payer. Adjusted dividend climbed from ₹1.00 (FY21) to a peak of ₹2.50 (FY23), then fell for three straight years: ₹2.00 → ₹1.00 → ₹0.50. This is not a consistent, growing payout. It tracks the paper cycle: the FY23 peak coincided with a super-normal EBITDA margin near 37%, and the FY26 low coincides with margins compressed to ~9%. Investors should treat Andhra Paper as a cyclical dividend, not an income stock.
Financial Performance Analysis
The core tension: record volumes, collapsing profit. FY26 saw the company's highest-ever paper production (2,59,266 MT) and sales (2,60,438 MT), yet profit fell off a cliff.
| Metric (₹ Cr) | FY26 | FY25 | Change |
|---|---|---|---|
| Revenue from operations | 1,701.23 | 1,541.24 | +10.4% |
| EBITDA | 150.89 | 223.29 | -32.4% |
| EBITDA margin | ~8.9% | ~14.5% | -560 bps |
| Depreciation | 107.31 | 88.32 | +21.5% |
| Net Profit (PAT) | 18.62 | 88.91 | -79.1% |
| PAT margin | ~1.1% | ~5.8% | -470 bps |
| EPS (₹) | ~0.94 | ~4.47 | -79% |
Operating-leverage red flag. Revenue rose +10.4% but EBITDA fell -32.4% and PAT fell -79.1%. That is negative operating leverage — the business sold more paper but earned far less on it. The two culprits:
1. Margin compression. EBITDA margin nearly halved from ~14.5% to ~8.9%, driven by high input costs (wood, pulp, chemicals), weak paper pricing and competitive import pressure.
2. A depreciation surge. Depreciation jumped +21.5% to ₹107.31 Cr as the recently completed modernisation assets began to be charged. This is a real, non-cash but recurring drag on reported profit.
The finding most wire services will miss — profit quality. Screener flags that FY26 earnings include other income of about ₹82.4 Cr. Reported profit before tax was only about ₹25.4 Cr. Strip out that other (largely treasury/investment) income and the core paper operations were loss-making at the PBT level — an estimated ₹(57) Cr. In other words, other income was roughly 325% of reported PBT. The headline "profit" is essentially interest and investment income; the actual paper business did not cover its own depreciation and interest this year.
The ₹82.4 Cr other-income figure is a Screener.in flag; the exact split of operating vs non-operating profit is an ShareBazaar Online estimate and is Not Independently Verified against the audited segment/notes.
Cash Flow Analysis
Reported profit is an accounting opinion; cash is a fact. On the cash statement, operating profit before working-capital changes fell to ₹91.30 Cr in FY26 from ₹141.67 Cr in FY25 — a -35.6% decline, consistent with the EBITDA drop and confirming that the earnings weakness is a real cash-generation weakness, not just a non-cash accounting artefact.
Is the dividend funded by cash the business earned this year? Only partly. The company is in a heavy investment phase: capital work-in-progress ballooned from ₹29.82 Cr to ₹278.96 Cr during the year (roughly a 9x jump) as it builds a new 35,000-TPA tissue & hygiene facility and completes modernisation. When capex of that scale runs against operating cash flow, free cash flow is very likely negative for FY26 — meaning the ₹9.94 Cr dividend is effectively being funded out of the company's accumulated cash reserves, not this year's surplus cash generation.
Exact operating cash flow and free cash flow figures for FY26 are Not Independently Verified from the full audited cash-flow statement at time of writing; the FCF-negative conclusion is inferred from the scale of CWIP additions versus operating cash generation.
Why the dividend is still affordable: the distinction that matters is "affordability" versus "earned this year". Andhra Paper can easily afford ₹9.94 Cr because it holds a large cash and investment balance (the source of that ₹82 Cr other income). But affordability from the balance sheet is not the same as a dividend funded by current free cash flow — and this year it is the former.
Balance Sheet Strength
Net position: Net cash (net debt-to-equity approx. −0.20).
Total financial liabilities: reduced to ₹232.15 Cr from ₹282.53 Cr — a ₹50.4 Cr (-17.8%) reduction in the year.
Estimated net cash: ~₹613 Cr (inferred: market cap ₹1,511 Cr minus enterprise value ₹898 Cr per TipRanks; Not Independently Verified).
Promoter pledge: Nil — entire 72.45% stake unencumbered.
P/B ratio: ~0.63x — the stock trades below its book value.
ROE (3-yr): ~6.07% (low); latest-year ROE around 5%.
ROCE: ~15% (per TipRanks; reflects better-capitalised years in the blend).
Interest cover: Screener flags a low interest-coverage ratio at the full-year level, though Q4 operating profit covered interest ~6.8x.
Bottom line: the balance sheet is genuinely strong — net cash, deleveraging, zero promoter pledge, and a below-book valuation. This is exactly why the small dividend is not a solvency worry. The weakness is not the balance sheet; it is the profit & loss statement and returns on capital, where a low single-digit ROE tells you the recently deployed capital is not yet earning its keep.
Dividend Sustainability Analysis
We test sustainability on four independent measures. A dividend can pass on the balance sheet yet fail on cash generation — both matter.
| Test | Reading | Verdict |
|---|---|---|
| 1. Earnings coverage (EPS ₹0.94 vs DPS ₹0.50) | 1.88x cover; 53% payout | Pass |
| 2. Operating cash-flow coverage | OCF proxy ₹91.3 Cr vs ₹9.94 Cr outflow | Pass |
| 3. Free cash-flow coverage | FCF likely negative (heavy capex) | Watch |
| 4. Cash / balance-sheet coverage | Net cash ~₹613 Cr vs ₹9.94 Cr (~62x) | Strong Pass |
Overall verdict — Sustainable (but small by design). The ₹0.50 dividend is comfortably covered by earnings, by operating cash flow and by a huge cash cushion. The single amber flag is free cash flow: with capex running hard, the dividend is not funded by this year's surplus cash. The bigger message is what the 50% cut itself signals — management deliberately kept the payout tiny to protect cash for its capex programme. The dividend is safe precisely because it was set low; it is the earnings recovery, not the dividend, that is the real question.
Peer Comparison
| Company | FY26 Dividend | Div. Yield | P/E | ROE / notes |
|---|---|---|---|---|
| Andhra Paper | ₹0.50 (25%) | ~0.82% | ~65x | ROE ~5–6%; P/B 0.63; net cash |
| JK Paper | ₹5.00 (approx.) | ~1.19% | ~25x | ROE ~17.8%; largest by scale |
| West Coast Paper | — | ~1.0–1.7% | ~11–12x | ROE ~5%; ~8% payout; Bangur group |
| Seshasayee Paper | ₹2.00 (100%) | ~2% | ~18–19x | ROCE >20%; near zero-debt; most efficient |
Peer metrics are indicative and drawn from public sources (Marketsmojo, Whalesbook, Simply Wall St, Screener) as of mid-2026. Blank cells indicate data not verified from a primary source. Dividend yields move with price and must be re-checked at publish time.
Where Andhra Paper stands: it has the lowest dividend yield and by far the highest P/E in the group — but the high P/E is a symptom of a depressed "E" (earnings), not a rich valuation; on price-to-book (0.63x) it is the cheapest. On returns it lags badly: JK Paper earns ~17.8% ROE and Seshasayee >20% ROCE, versus Andhra Paper's ~5–6% ROE. The peer set makes the point cleanly — Andhra Paper is currently a turnaround/asset play, not a dividend or quality-compounder play. (Note: West Coast Paper shares the Bangur promoter lineage and the same chairman, S K Bangur.)
Promoter Impact Analysis
Promoter holding: 72.45% (Mar 2026, unchanged, unpledged)
FII holding: 0.34% (down from 0.79%)
DII / MF holding: 5.41% (up from 4.36%)
Public / Retail: ~21.43%
Dividend to promoter: ~₹7.20 Cr (72.45% of ₹9.94 Cr)
Dividend to public + institutions: ~₹2.74 Cr (27.55%)
Promoter pledge: Zero
With a 72.45% stake, roughly ₹7.20 Cr of the total ₹9.94 Cr dividend flows to the promoter group. That concentration is normal for a family-controlled company, and the very high promoter stake plus zero pledging is a genuine governance positive — skin in the game and no leverage against the shares. The flip side of a 72.45% promoter holding is a thin free float (~27.5%), which can make the stock illiquid and volatile. The small dividend also signals promoter alignment with reinvestment rather than cash extraction — the promoter is forgoing a larger payout on their own ₹7 Cr-plus slice to keep cash in the business for capex.
Taxation Analysis
Since the abolition of the Dividend Distribution Tax (from FY21), dividends are taxable in the hands of the investor at their applicable income-tax slab rate. Key rules:
• Dividend is added to "Income from Other Sources" and taxed at your slab rate (5% / 20% / 30% etc.).
• TDS under Section 194: the company deducts 10% TDS only if your total dividend from that company in the year exceeds ₹5,000. Below that threshold, no TDS.
• Form 15G / 15H can be submitted to avoid TDS if your total income is below the taxable limit.
• NRIs face a higher TDS (typically 20% plus surcharge/cess, subject to DTAA relief).
Worked example — retail investor holding 1,000 shares, 30% slab:
| Shares held | 1,000 |
| Dividend per share | ₹0.50 |
| Gross dividend | ₹500 |
| TDS u/s 194 (10%) | ₹0 — gross is below the ₹5,000 threshold, so no TDS |
| Tax at 30% slab | ₹150 |
| Net dividend in hand | ₹350 |
| Post-tax yield (at CMP ₹61.03) | ~0.57% |
Illustrative only, not tax advice. To actually cross the ₹5,000 TDS threshold at ₹0.50/share you would need to hold more than 10,000 shares of Andhra Paper. Consult a tax professional for your situation.
Key Risks
1. Margin / commodity cycle risk. EBITDA margin has swung from ~37% (FY23) to ~9% (FY26). Paper is a cyclical commodity; realisations depend on pulp costs and import competition, both outside the company's control.
2. Labour unrest / production disruption. A lockout at the Kadiyam unit from 01 May 2026 (following an illegal strike by contract workmen) can disrupt output and hit early FY27 results. Operations were only progressively restored (capacity back to ~93% by late July 2026).
3. Profit-quality / other-income dependence. With core operations at a PBT loss ex-other-income this year, reported profit leans heavily on treasury income — a soft foundation for the payout if investment yields or cash balances fall.
4. Heavy capex execution risk. CWIP jumped ~9x to ₹278.96 Cr. The new tissue/hygiene line (35,000 TPA, targeted Q2 FY27) must deliver the promised higher-margin returns; delays or cost overruns would keep ROE depressed.
5. Rising depreciation drag. Depreciation rose 21.5% and will stay elevated as new assets are capitalised, structurally lowering reported profit until volumes and margins scale up.
6. Low free float / liquidity risk. With ~72.45% held by the promoter, the free float is thin, which can amplify price volatility for minority holders.
What To Monitor
1. EBITDA margin trajectory. Watch whether the margin recovers from ~9% toward historical mid-teens levels in FY27 quarters — the single most important driver of earnings and future dividends.
2. Tissue & hygiene plant ramp-up. Track the Q2 FY27 commissioning of the 35,000-TPA facility and management commentary on realised margins from it — this is the thesis for higher future returns.
3. Kadiyam labour situation. Confirm full, stable resumption of operations and whether the FY27 opening quarter absorbed any lasting production loss.
4. Core vs other income mix. In FY27, monitor whether operating profit (ex-other income) turns positive — the clearest sign the paper business itself is healing.
5. Capex-to-cash-flow balance & FCF. As CWIP converts to operating assets, watch for free cash flow turning positive; that is the pre-condition for any dividend growth from here.
6. Record-date & AGM confirmation. Verify the exchange corporate-action circular and AGM outcome; the dividend only becomes payable after members approve it.
Conclusion
Andhra Paper's FY26 final dividend of ₹0.50 is a small, safe payout wrapped around a much bigger story. The positives are on the balance sheet: net cash, an 18% reduction in financial liabilities, zero promoter pledge, and a valuation below book (P/B ~0.63x). The dividend is comfortably covered by earnings, operating cash flow, and a large cash cushion.
The negatives are on the profit statement: revenue rose 10% but profit fell 79%, margins nearly halved, depreciation surged, free cash flow is likely negative under heavy capex, and — the finding most coverage will miss — the paper business ran at a core operating loss this year, with reported profit propped up by ~₹82 Cr of investment income. The dividend has now been cut two years running (₹1.00 → ₹0.50), which is management telling you plainly that cash is being kept back for the tissue/hygiene expansion.
For an income-seeking investor, a 0.82% yield offers little. For a value or turnaround-minded investor, the real question is not the dividend at all — it is whether the new capacity lifts margins and ROE back toward peer levels. We present the facts; the decision is yours.
Frequently Asked Questions
What dividend has Andhra Paper announced for FY26?
What is the dividend yield?
What is the record date?
What is the ex-dividend date?
When will the dividend be paid?
Who is eligible for the dividend?
How is this dividend taxed?
Is the dividend sustainable?
What is Andhra Paper's dividend history?
Why did profit fall so sharply if revenue grew?
Why did the company cut the dividend by 50%?
Is Andhra Paper financially strong despite the profit drop?
How does Andhra Paper compare with peers on dividends?
How much of the dividend goes to the promoter?
What should investors monitor from here?
Disclaimer
This article is published by ShareBazaar Online for informational and educational purposes only. It is not investment advice and contains no buy, sell or hold recommendation. ShareBazaar Online is not a SEBI-registered investment adviser or research analyst. Financial figures are compiled from company filings and public sources (BSE/NSE, Screener.in, TipRanks, and others) and, where labelled, are inferred or Not Independently Verified. Market price, dividend yield, record date and AGM approval status can change — always re-verify against primary exchange sources before acting. Dividends are subject to shareholder approval at the 62nd AGM and to applicable taxes. Investments in securities are subject to market risks; please consult a SEBI-registered adviser and read all related documents before investing.