
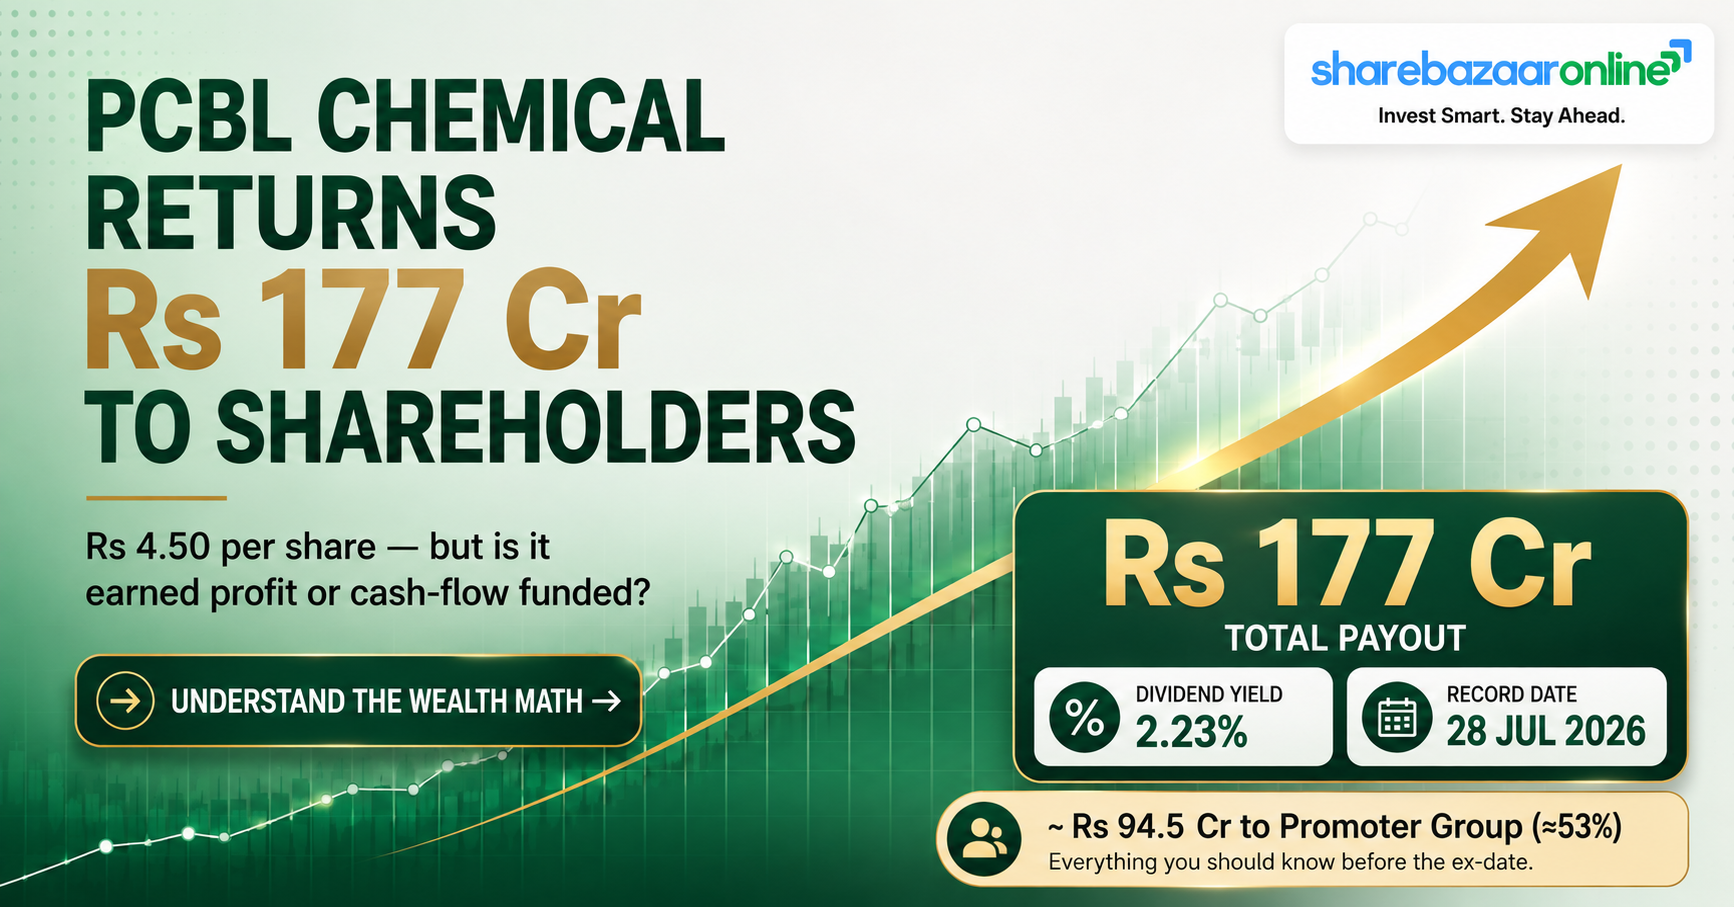
Dividend Snapshot
PCBL Chemical Limited (formerly PCBL Limited), the RP-Sanjiv Goenka Group company and India's largest carbon black producer, has declared an interim dividend of Rs 4.50 per equity share (450% on face value of Re 1) for the financial year ending 31 March 2027 (FY27). This is the first payout of FY27 and was announced alongside a strong Q1 FY27 result.
NSE: PCBL | BSE: 506590 | CIN: L23109WB1960PLC024602 | Sector: Carbon Black / Specialty Chemicals
Dividend / Share
Rs 4.50
Dividend %
450%
Type
Interim (FY27)
Record Date
04 Aug 2026
Indicative Yield*
~1.32%
Total Outflow
~Rs 177 Cr
*Yield on CMP of ~Rs 340 (30 Jul 2026, Screener). Live CMP must be re-verified at publish time — yield figures become stale quickly.
Dividend Announcement Summary
At its board meeting held on Wednesday, 29 July 2026 (commenced 12:30 PM, concluded 2:15 PM), the Board of Directors of PCBL Chemical Limited approved the unaudited standalone and consolidated financial results for the quarter ended 30 June 2026, and declared an interim dividend at 450%, i.e. Rs 4.50 per equity share of Re 1 each, for the financial year ending 31 March 2027.
The Board fixed Tuesday, 4 August 2026 as the Record Date for determining eligible shareholders. The intimation was filed with NSE and BSE under Regulations 30, 33, 51 and 52 of SEBI LODR Regulations, 2015 and signed by K. Mukherjee, Company Secretary & Chief Legal Officer.
Note on approval status: An interim dividend is declared and paid by the Board and does not require prior shareholder (AGM) approval, unlike a final dividend. It is, however, subject to confirmation at the next general meeting.
Key Dates Timeline
Ex-date basis: The company did not separately disclose an ex-date. Under India's current T+1 settlement regime, the ex-date and record date typically coincide, so the ex-date is inferred as 4 August 2026 (same as the record date). This should be confirmed against the exchange corporate-action circular before publishing.
Payment date: Not disclosed in the filing. Under the Companies Act, 2013, an interim dividend must be paid within 30 days of declaration, giving a statutory outer limit of on or before ~28 August 2026.
Dividend Yield Analysis
On the closing price of ~Rs 318.40 on the announcement date (29 Jul 2026), the Rs 4.50 interim translates to an announcement-date yield of ~1.41%. On the more recent price of ~Rs 340, the indicative yield is ~1.32%.
Announcement-date close of Rs 318.40 is Not Independently Verified; the stock traded sharply higher intraday (a reported ~16% jump to ~Rs 370) on the results. Yield moves inversely with price, so this figure must be recomputed against the live CMP at publish.
Yield reality check: This is a single interim, not a full-year figure. PCBL's trailing 12-month payout (Rs 6.00 in Oct 2025 plus Rs 5.50 earlier) supports a reported trailing yield closer to ~1.7–1.8%. The forward FY27 yield depends on whether a second-half FY27 dividend follows — historically PCBL has paid one to two times a year.
The yield sits well above pure specialty-chemical peers (see Peer Comparison), a typical trait of a commodity-linked carbon-black business that returns cash rather than reinvesting at high multiples.
Dividend History Analysis
PCBL is a consistent dividend payer with an unbroken multi-year record and a rising trend. Because the share was split from Rs 2 to Re 1 face value (record date 12 April 2022), all dividends declared before FY23 are shown below both as-declared and restated to a Re-1-equivalent basis, per Ind AS 33, so year-on-year comparison is not misleading.
| Financial Year | Declared | As-Declared DPS | Face Value | Re-1 Adjusted DPS |
|---|---|---|---|---|
| FY19 | Jan 2019 | Rs 1.75 | Rs 2 | Rs 0.88 |
| FY20 | Feb 2020 | Rs 1.75 | Rs 2 | Rs 0.88 |
| FY21 | Feb 2021 | Rs 3.50 | Rs 2 | Rs 1.75 |
| FY22 | Feb 2022 | Rs 5.00 | Rs 2 | Rs 2.50 |
| FY23 | Feb 2023 | Rs 5.50 | Re 1 | Rs 5.50 |
| FY24 | Jan 2024 | Rs 5.50 | Re 1 | Rs 5.50 |
| FY25 | Jan 2025 | Rs 5.50 | Re 1 | Rs 5.50 |
| FY26 | Oct 2025 | Rs 6.00 | Re 1 | Rs 6.00 |
| FY27* | Jul 2026 | Rs 4.50 | Re 1 | Rs 4.50 |
*FY27 reflects the first interim only; the financial year is incomplete. Source: exchange filings, TipRanks corporate-action records. Amounts Not Independently Verified against each original circular.
Classification: Consistent Payer. On a like-for-like Re-1 basis, dividends rose from Rs 0.88 (FY19) to Rs 6.00 (FY26) — no cuts, no suspensions. The FY26 step-up to Rs 6.00 is notable precisely because it came in a year when reported profit halved (see Sustainability).
Financial Performance Analysis
Q1 FY27 (Consolidated) — a sharp recovery quarter
Positive operating leverage: PAT grew far faster than revenue (+65% vs +17%), aided by margin recovery (OPM back to ~16%) and lower finance costs (Rs 112 Cr → Rs 93 Cr YoY). Carbon Black remained the profit engine; specialty blacks reportedly grew ~23% YoY.
FY26 (Consolidated) — the earnings dip behind the headline
Non-obvious finding: FY26 profit halved not because the business shrank, but because of margin compression plus a heavy interest and depreciation load from the debt-funded Aquapharm acquisition — interest rose from Rs 53 Cr (FY23) to Rs 461 Cr (FY25) / Rs 423 Cr (FY26), and depreciation from Rs 137 Cr to Rs 373 Cr. The Dec 2025 quarter was the trough (PAT ~Rs 2 Cr, tax rate ~80%).
Standalone Q1 FY27: Revenue Rs 1,653 Cr, PAT Rs 107.24 Cr, EPS Rs 2.73. The gap between consolidated PAT (Rs 155 Cr) and standalone PAT (Rs 107 Cr) reflects the contribution of eight overseas/Indian subsidiaries (led by Aquapharm), which added ~Rs 60 Cr of net profit in the quarter. This analysis is anchored on consolidated figures, which capture the full group.
Cash Flow Analysis
This is where PCBL's dividend story becomes clear. Reported profit collapsed in FY26, but cash generation did the opposite. Consolidated operating cash flow (OCF) was a record ~Rs 1,576 Cr — a CFO-to-operating-profit conversion of ~158% — and free cash flow (FCF) was ~Rs 851 Cr positive, against net profit of just Rs 198 Cr.
Why OCF >> profit: Depreciation of Rs 373 Cr is a non-cash charge added back, and working capital was released (working-capital days improved to ~-40; debtor days fell from 79 to 62). So the same acquisition that depressed accounting profit (via interest and depreciation) did not drain cash.
How the dividend is funded: The ~Rs 177 Cr FY27 interim outflow is comfortably covered by current operating cash flow, not by cash reserves, asset sales or fresh borrowing. On-hand cash is modest (standalone cash + bank ~Rs 127 Cr, i.e. ~0.72x the outflow), so the payout leans on ongoing cash generation rather than the balance-sheet buffer.
Key distinction: PCBL can afford this dividend from cash generation even though FY26 earnings did not cover the prior payout. Affordability (cash) and earned coverage (profit) point in different directions here.
Balance Sheet Strength
The leverage overhang. Consolidated borrowings jumped from ~Rs 1,029 Cr (FY23) to ~Rs 4,983 Cr (FY24) to fund the Aquapharm acquisition, and remain near Rs 5,000 Cr. This is the single biggest structural fact on the balance sheet and the direct cause of the FY26 profit squeeze.
Interest coverage is thin — a recurring flag from rating agencies and screeners. However, debtor days have improved (79 → 62), the cash conversion cycle has shortened, and standalone leverage (0.70x) is far more comfortable than consolidated (1.25x). Paying a dividend while carrying ~Rs 4,500 Cr of net debt is the central tension investors must weigh.
Dividend Sustainability Analysis
A four-test scorecard for the Rs 4.50 FY27 interim (outflow ~Rs 177 Cr):
| Test | Metric | Reading | Verdict |
|---|---|---|---|
| Earnings coverage | Q1 EPS Rs 3.94 vs DPS Rs 4.50 | 0.88x on one quarter; ~3.5x if the quarter annualises | Watch |
| OCF coverage | FY26 OCF Rs 1,576 Cr | ~8.9x outflow | Strong |
| FCF coverage | FY26 FCF Rs 851 Cr | ~4.8x outflow | Strong |
| Cash / balance-sheet | Cash + bank ~Rs 127 Cr | ~0.72x outflow; net debt ~Rs 4,537 Cr | Weak buffer |
Context flag — FY26 payout exceeded earnings. The prior Rs 6.00 (FY26) dividend represented an outflow of ~Rs 226 Cr against FY26 consolidated PAT of Rs 198 Cr — a payout of roughly 114–119% of profit. The board maintained (indeed raised) the dividend through an earnings trough, funding it from strong cash flow rather than earnings.
Verdict: Moderately Sustainable. The dividend is well covered by operating and free cash flow and PCBL has never cut it. But it is not covered by current-year earnings and sits on a leveraged balance sheet with thin interest coverage. Sustainability rests on the Q1 FY27 profit recovery continuing and on debt being paid down.
Peer Comparison
| Company | Div Yield | Payout | ROE | ROCE | Debt profile |
|---|---|---|---|---|---|
| PCBL Chemical | ~1.3–1.8% | ~114–119% (FY26) | ~5.6% (FY26) | ~7.8% (FY26) | Net debt ~Rs 4,537 Cr |
| Himadri Speciality | ~0.13% | ~5% | — | — | Low leverage |
| Deepak Nitrite | ~0.34% | — | ~22.9% | ~30% | Near debt-free |
Peer cells left blank where the figure could not be verified from primary sources. Peer metrics are indicative and Not Independently Verified at the same date as PCBL.
Reading the table: PCBL yields materially more than specialty-chemical peers because it is a commodity-linked carbon-black cash-returner, whereas Himadri and Deepak Nitrite retain earnings to compound at high ROCE (~30% for Deepak). PCBL's higher yield comes bundled with a far more leveraged balance sheet and a currently depressed ROE/ROCE — i.e., the yield premium is a risk-and-cyclicality premium, not a sign of superior returns on capital.
Promoter Impact Analysis
Promoter share of the payout: Of the ~Rs 177 Cr total outflow, the RP-Sanjiv Goenka Group promoters receive ~Rs 94.5 Cr (53.38%), while public/retail shareholders collectively receive ~Rs 50 Cr and DIIs ~Rs 20 Cr.
Alignment note: Promoter holding rose from 51.41% to 53.38% in the Dec 2025 quarter (via warrant conversion), and DII holding has climbed steadily (5.6% to 11.3% over two years). A promoter increasing its stake and drawing a rising dividend is generally read as a signal of confidence, but retail readers should note the majority of every rupee distributed flows to the promoter group.
Taxation Analysis
Since the abolition of Dividend Distribution Tax (DDT) in FY2020-21, dividends are taxable in the hands of the shareholder at their applicable income-tax slab rate (added under "Income from Other Sources").
TDS under Section 194: A company deducts 10% TDS only if total dividend from that company exceeds Rs 10,000 in a financial year (threshold raised from Rs 5,000 to Rs 10,000 with effect from FY2025-26). Without a valid PAN, TDS is 20%. For NRIs, Section 195 applies at 20% (or a lower DTAA rate). Form 15G/15H can be filed by eligible residents to avoid TDS.
Worked example — retail investor holding 1,000 shares
| Gross dividend (1,000 × Rs 4.50) | Rs 4,500 |
| TDS (Section 194) | Rs 0 — below Rs 10,000 threshold |
| Tax at 30% slab (+ cess, paid via ITR) | Rs 1,350 |
| Net dividend in hand | Rs 3,150 |
| Effective post-tax yield (on Rs 340 CMP) | ~0.93% |
A shareholder would need to hold more than ~2,222 PCBL shares for this single Rs 4.50 interim to cross the Rs 10,000 TDS threshold. Even where no TDS is cut, the dividend remains fully taxable at slab and must be reported in the ITR. This is a general illustration, not tax advice; consult a qualified professional.
Key Risks
1. Leverage and interest burden. Net debt of ~Rs 4,537 Cr and thin interest coverage mean rising rates or weaker cash flow could quickly pressure both profit and the ability to sustain payouts above earnings.
2. Crude-oil / feedstock volatility. Carbon black is derived from carbon black feedstock (a crude derivative). The company's own filing notes turnover is "highly sensitive to fluctuations in crude oil prices," which can swing margins quarter to quarter.
3. Earnings-to-dividend mismatch. FY26 paid out ~114–119% of profit. If the Q1 FY27 recovery stalls, the dividend would again outrun earnings, drawing on the balance sheet.
4. Cyclical, auto-linked demand. Rubber-grade carbon black demand tracks tyre and automobile output; a slowdown in autos (domestic or export) directly hits volumes.
5. Acquisition integration & FX. Aquapharm and eight overseas subsidiaries add integration, currency-translation and step-down-subsidiary risks; some subsidiary results are based on unreviewed management figures.
What To Monitor
1. Debt reduction trajectory. Whether gross borrowings fall below Rs 4,500 Cr and interest cost keeps declining (Rs 112 Cr → Rs 93 Cr in Q1 was encouraging).
2. Margin durability. Whether OPM holds near ~16% (Q1 FY27) rather than slipping back to the ~12–13% seen in H2 FY26.
3. Specialty-black & Aquapharm mix. Higher-margin specialty and phosphonate volumes vs commodity rubber black — the key to structurally better returns.
4. Second FY27 dividend. Whether a further interim/final follows this Rs 4.50, and at what payout ratio relative to recovering earnings.
5. Cash-flow conversion. Whether OCF/operating-profit stays high and FCF remains positive, since the dividend currently rests on cash, not earnings.
Conclusion
PCBL Chemical's Rs 4.50 (450%) interim opens FY27 on the back of a genuinely strong quarter — consolidated revenue up 17% and profit up 65% year-on-year, with margins and interest costs both moving the right way. It reinforces an unbroken, rising dividend record from a company that has never cut its payout.
The nuance that aggregator coverage misses is that PCBL is paying a rising dividend through an earnings trough. FY26 profit halved under the weight of interest and depreciation from a debt-funded acquisition, and the dividend that year exceeded reported earnings. What makes the payout defensible is cash, not accounting profit: operating and free cash flow cover it several times over. The open questions are whether the Q1 recovery holds and whether the ~Rs 4,500 Cr net debt is steadily reduced.
Positives: consistent payer, strong cash generation, Q1 recovery, promoter buying. Negatives / watch-items: high leverage, thin interest cover, payout above earnings in FY26, crude and auto-cycle sensitivity. Readers should weigh these against their own objectives.
Frequently Asked Questions
What dividend has PCBL Chemical announced?
What is the dividend yield on PCBL Chemical?
What is the record date for the PCBL dividend?
What is the ex-dividend date?
When will the dividend be paid?
Who is eligible for the dividend?
How is the PCBL dividend taxed?
Is the PCBL dividend sustainable?
Why did PCBL's FY26 profit fall so sharply?
What is PCBL's dividend history?
How much of the dividend goes to promoters?
What should investors monitor from here?
Does an interim dividend need AGM approval?
Disclaimer
This article is published by ShareBazaar Online for informational and educational purposes only and does not constitute investment, financial, legal or tax advice, nor a recommendation to buy, sell or hold any security. ShareBazaar Online is not a SEBI-registered investment adviser or research analyst. Dividend, price, yield and financial figures are drawn from company exchange filings and third-party sources believed to be reliable; several figures are inferred or unverified and are flagged as such (including the announcement-date and current market price, the inferred ex-date, and peer metrics). Live market price and the ex-date must be independently re-verified before acting. Past dividend records do not guarantee future payouts. Investors should conduct their own due diligence and consult a qualified professional. Investments in securities are subject to market risks.