
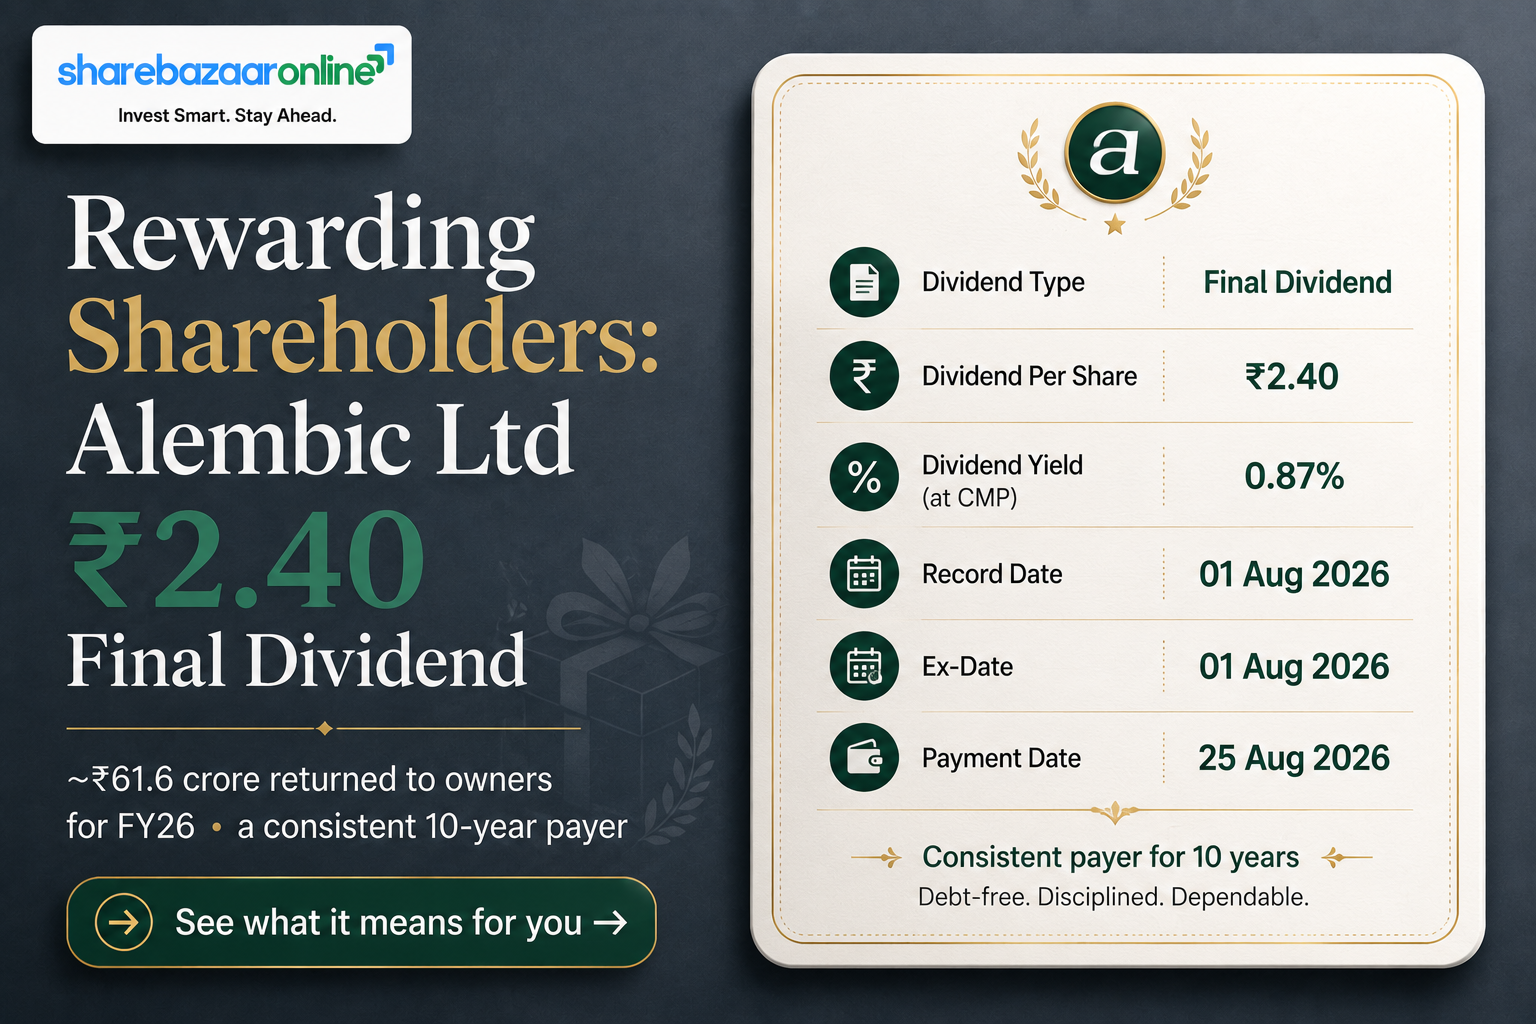
Dividend Snapshot
Company
Alembic Limited
NSE: ALEMBICLTD | BSE: 506235
CIN: L26100GJ1907PLC000033
Dividend Declared
₹2.40 per share (120%)
Type: Final Dividend | Face Value: ₹2
For the year ended 31 March 2026
Dividend Yield (on CMP ₹91.13)
2.63%
CMP as on 31 Jul 2026 (NSE) — re-verify at publish
Total Dividend Outflow
₹61.63 Crore
2.40 × 25.68 crore shares
The one-line story: Alembic Limited is not an operating company you buy for its factories — it is a holding vehicle that owns a 28.41% stake in listed Alembic Pharmaceuticals plus a real-estate business. Its entire ₹61.63 crore payout is almost exactly matched by the ₹62.95 crore of dividend it receives from that pharma stake. In effect, the dividend is largely passed through, not earned from day-to-day operations.
Dividend Announcement Summary
On 19 May 2026, the Board of Directors of Alembic Limited (in a meeting held from 4:30 p.m. to 5:45 p.m.) recommended a final dividend of ₹2.40 per equity share (120% of the ₹2 face value) for the financial year ended 31 March 2026. The same board meeting approved the audited standalone and consolidated results, which carry an unmodified (clean) audit opinion from CNK & Associates LLP.
What "120%" means
Indian companies quote dividends as a percentage of face value, not market price. 120% of a ₹2 face value = ₹2.40 per share. It has nothing to do with your buying price — your actual return is the yield of 2.63%.
Subject to approval
This is a final dividend, so it must be approved by shareholders at the Annual General Meeting before it is paid. The 119th AGM is scheduled for 11 August 2026 (confirmed via a later exchange filing; not part of the 19 May board outcome).
Key Dates Timeline
Announcement Date
19 May 2026
Board recommendation (disclosed by company)
Record Date
4 August 2026
Fixed via exchange filing dated 13 Jul 2026 (not in the 19 May outcome)
Ex-Date
3 August 2026 (Inferred)
Inferred as record date − 1 trading day under T+1; confirm against exchange circular
Payment Date
Not Disclosed by Company
Payable after AGM (11 Aug 2026); statutory outer limit is within 30 days of declaration. Historically paid mid-August.
Eligibility rule: To receive this dividend you must hold shares at the end of the record date (4 Aug 2026). Because Indian settlement is now T+1, you must buy on or before the ex-date (3 Aug 2026). Buy on the ex-date or later and the seller keeps the dividend.
Dividend Yield Analysis
Yield on Current Price (₹91.13)
2.63%
₹2.40 ÷ ₹91.13
Yield on Announcement Price (₹89.46)
2.68%
₹2.40 ÷ ₹89.46 (NSE close, 19 May 2026)
A 2.63% yield is above the healthcare-sector average (roughly 1.7%–1.8%, per TipRanks — not independently verified), but it is modest in absolute terms. Importantly, the yield here is not being propped up by a collapsing share price in the usual dangerous way: the stock is down about 20% over one year, yet the dividend has been held flat at ₹2.40 for three straight years. So the yield has crept up mainly because the price fell, while the payout stayed the same — a point worth understanding before treating 2.63% as "income growth."
Dividend History Analysis
| FY (paid in) | Dividend / Share | Ex-Date | Payment Date |
|---|---|---|---|
| FY26 (2026)* | ₹2.40 | 3 Aug 2026 (inferred) | Not Disclosed |
| FY25 (2025) | ₹2.40 | 5 Aug 2025 | 14 Aug 2025 |
| FY24 (2024) | ₹2.40 | 5 Aug 2024 | 11 Sep 2024 |
| FY23 (2023) | ₹2.20 | 3 Aug 2023 | 9 Sep 2023 |
| FY22 (2022) | ₹1.80 | 12 Sep 2022 | 23 Sep 2022 |
| FY21 (2021) | ₹0.20 | 29 Jul 2021 | 10 Aug 2021 |
| FY20 (2020) | ₹0.60 | 29 Jul 2020 | 11 Aug 2020 |
| FY19 (2019) | ₹0.20 | 18 Sep 2019 | 27 Oct 2019 |
*Current declaration. History sourced from TipRanks / exchange records — not independently verified against each year's circular.
Classification: Consistent (but plateaued) Payer
Alembic has paid a dividend every year for at least a decade with no cuts or suspensions. The payout climbed steeply from ₹0.20 (FY21) to ₹2.40 (FY24) — a 12× jump in three years — but has since been frozen at ₹2.40 for FY24, FY25 and FY26.
What the plateau signals
The three-year freeze lines up with the flat dividend Alembic itself receives from Alembic Pharma. Because the parent largely relays the pharma dividend, its own payout tends to move only when the pharma dividend moves — a structural, not a discretionary, plateau.
Financial Performance Analysis
| Consolidated (₹ Cr) | FY26 | FY25 | Change |
|---|---|---|---|
| Revenue from Operations | 240.0 | 221.9 | +8.2% |
| Profit Before Tax | 148.8 | 155.5 | −4.3% |
| Profit before associate share | 125.9 | 144.6 | −12.9% |
| Share of Associate Profit (Alembic Pharma) | 191.5 | 166.1 | +15.3% |
| Net Profit (incl. associate) | 317.4 | 310.7 | +2.2% |
| Consolidated EPS (₹) | 12.36 | 12.10 | +2.1% |
The number aggregators miss: the headline "consolidated profit up 2.2%" hides the fact that Alembic's own profit fell 12.9%. The consolidated bottom line was rescued entirely by a +15.3% rise in the associate's (Alembic Pharma's) profit share to ₹191.5 crore — a non-cash, equity-accounted number that Alembic does not control day-to-day. On a standalone basis, net profit fell from ₹141.95 Cr to ₹124.54 Cr (−12.3%), and standalone EPS slipped from ₹5.53 to ₹4.85.
Operating leverage in reverse
Revenue rose +8.2% but the core operating segment result (API + Real Estate) fell −6.4% to ₹86.8 Cr, and the real-estate segment result dropped −7.8%. Costs outran sales: employee expenses +37.1%, materials consumed +73.5%, other expenses +12.4%, depreciation +16.6%.
A rough Q4
The March-2026 quarter was weak: standalone Q4 net profit fell about 59.5% year-on-year to roughly ₹9.6 Cr, hit by an abnormally high ~47.9% tax rate and an API-segment operating loss for the quarter (Q4 tax-rate figure per Marketsmojo; not independently verified).
Cash Flow Analysis
Reported profits are opinions; cash is fact. Alembic's consolidated operating cash flow rose to ₹120.07 crore (FY25: ₹86.37 Cr) — healthy, and it comfortably covers the ₹61.63 crore dividend at 1.95×. But there is a catch in free cash flow.
Consolidated Operating Cash Flow
₹120.07 Cr
Covers dividend 1.95×
Reported Free Cash Flow (OCF − Capex)
₹43.42 Cr
Covers dividend only 0.70× — a shortfall
The key insight: after ₹76.65 crore of capital spending (largely on investment property), reported free cash flow of ₹43.42 crore is below the ₹61.63 crore dividend — a coverage of just 0.70×. That looks alarming until you see how a holding company actually works. Alembic's cash-flow statement strips the ₹62.95 crore of dividend received from Alembic Pharma out of operating cash flow and parks it under investing. Add that pass-through back and the picture flips: OCF + dividend received − capex = ₹106.4 crore, or 1.73× cover. So the dividend is funded from current cash generation (chiefly the pharma dividend it collects), not from borrowings or asset sales.
How the dividend is funded
Dividend received from Alembic Pharma: ₹62.95 Cr → Dividend paid out by Alembic: ₹61.63 Cr. That is a near-perfect 1.02× pass-through. Working capital also released cash this year (inventories fell by ₹47 Cr). Funding source: current earnings / dividend receipts — not cash reserves, not asset sales, not debt.
Balance Sheet Strength
Total Borrowings (Consolidated)
₹10.64 Cr
Debt-to-equity just 0.44% — virtually debt-free
Total Equity (Consolidated)
₹2,445 Cr
Cash + current investments: ₹98.0 Cr
The hidden value story: the biggest asset on Alembic's books is its ₹1,704 crore equity-method investment in Alembic Pharma, carried at cost-plus-share-of-profits. On the market, per Screener, Alembic's investments are worth about ₹3,886 crore — more than the company's entire market capitalisation of ~₹2,340 crore. In plain terms, the stock market values the whole company at less than its listed stake in Alembic Pharma, a textbook holding-company discount. Cash-and-investment cover for the dividend is deep: even counting only readily identifiable investments, it is 4.4×.
One caveat on reserves: a large negative Other Comprehensive Income entry of about −₹105.6 Cr (fair-value marks on investments) sat below the line this year. It does not touch distributable profit or the dividend, but it is why total comprehensive income (₹229.8 Cr) came in well below net profit (₹317.4 Cr).
Dividend Sustainability Analysis
| Sustainability Test | Result | Verdict |
|---|---|---|
| Earnings coverage — Consolidated (EPS/DPS) | 5.15× | Strong |
| Earnings coverage — Standalone (EPS/DPS) | 2.02× | Comfortable |
| Operating cash flow coverage | 1.95× | Comfortable |
| Reported free cash flow coverage | 0.70× | Watch (capex-heavy) |
| Cash + investments coverage | 4.4× | Strong |
Overall verdict: Sustainable — with one dependency flag. Four of five tests pass comfortably. The only amber light is reported FCF (0.70×), which reflects heavy investment-property capex rather than a payout that outstrips earnings. The real sustainability question is not Alembic's own operations — it is whether Alembic Pharma keeps paying its dividend. Because roughly ₹63 of every ₹62 Alembic distributes comes from the pharma dividend it receives, the parent's payout is only as durable as its associate's. Payout is a modest 19.4% of consolidated profit, but a heavier 49.5% of standalone profit — so on its own-business earnings there is less room to spare.
Peer Comparison
| Metric | Alembic Ltd | Alembic Pharma (associate) | Sector Avg |
|---|---|---|---|
| Dividend / Share | ₹2.40 | ₹11.00 | — |
| Dividend Yield | 2.63% | ~1.2% | ~1.7%–1.8% |
| Payout Ratio (consol) | ~19.4% | ~34.7% | Not Verified |
| ROE (approx.) | ~13.1% | Not Verified | Not Verified |
| P/E | ~7.4× | Not Verified | Not Verified |
| Debt / Equity | ~0.4% | Not Verified | Not Verified |
Peer/sector cells left "Not Verified" where they cannot be confirmed from primary sources. Yields & payout from TipRanks/Screener (external) — re-verify at publish.
Alembic Ltd is hard to peer-map because it is really a holding company, not a pure operating business. On yield (2.63%) it screens higher than both its own pharma associate (~1.2%) and the sector average, and it carries almost no debt. But its low P/E (~7.4×) and sub-market ROE (~13%) reflect the classic holding-company discount rather than obvious cheapness.
Promoter Impact Analysis
Promoter Holding
70.88%
Led by Nirayu Pvt Ltd (~63.06%) + Amin family. FII ~1.2%, DII ~0.05%, Public ~27.57%.
Promoter Share of Dividend
₹43.68 Cr
Of which Nirayu Pvt Ltd alone: ~₹38.86 Cr
With promoters owning nearly 71%, about ₹43.68 crore of the ₹61.63 crore payout flows to the promoter group, and public shareholders receive roughly ₹16.99 crore. Promoter holding has been rock-steady at 70.88% across the last five quarters, with no pledging flagged — a sign of stable control and aligned interests, though it also means minority holders have limited sway over payout policy.
Taxation Analysis
Since April 2020, dividends are taxed in the investor's hands at their income-tax slab rate (there is no longer a Dividend Distribution Tax paid by the company). The company deducts TDS at 10% under Section 194 only if your total dividend from that company in a financial year exceeds ₹10,000 (threshold raised from ₹5,000 with effect from FY2025-26). Submitting Form 15G/15H can avoid TDS if your income is below the taxable limit.
Worked example — investor holding 1,000 shares
| Gross dividend (1,000 × ₹2.40) | ₹2,400 |
| TDS @10% (dividend < ₹10,000 threshold) | ₹0 |
| Tax at 30% slab (+ applicable cess) | ₹720 |
| Net dividend in hand | ₹1,680 |
| Effective post-tax yield (on ₹91.13 CMP) | ~1.84% |
Illustrative only; ignores surcharge/cess nuances and assumes the 30% slab. Consult a tax adviser for your own situation.
Key Risks
1. Dividend depends on Alembic Pharma
The payout is ~1.02× funded by the pharma dividend received. If Alembic Pharma cuts or delays its dividend, Alembic Ltd's own distribution is directly at risk.
2. Core operating profit is shrinking
Standalone PAT fell −12.3% and the operating segment result −6.4%, with costs (employees +37%, materials +73.5%) outpacing an 8% revenue rise.
3. Real-estate cyclicality
Real estate is ~81% of standalone revenue and its segment profit fell −7.8%. Project timing and property-market cycles make earnings and cash flow lumpy.
4. Contingent electricity-duty liability
Auditors flag a disputed electricity-duty matter with principal of ₹20.52 Cr; ₹35 Cr has been deposited with the Supreme Court and interest is unascertained.
5. Frozen payout & falling price
The dividend has been flat at ₹2.40 for three years while the stock is down ~20% in a year — income growth has stalled even as the yield optically rises.
6. AGM approval still pending
As a final dividend it is not yet confirmed until shareholders approve it at the AGM on 11 Aug 2026.
What To Monitor
1. Alembic Pharma's dividend policy — the single biggest driver of Alembic Ltd's future payout. Watch APLLTD's annual dividend and profit trend.
2. Real-estate project pipeline & bookings — the segment funds most of the standalone business; track new launches and revenue recognition.
3. Cost trajectory — whether the sharp jumps in employee (+37%) and material (+73.5%) costs normalise or keep compressing margins.
4. Holding-company discount — the gap between the ~₹2,340 Cr market cap and ~₹3,886 Cr value of investments; any narrowing signals a re-rating.
5. Capex vs free cash flow — whether investment-property spending keeps reported FCF below the dividend, forcing reliance on the pharma pass-through.
6. Electricity-duty case — the outcome of the Supreme Court appeal and any interest crystallising on the ₹20.52 Cr disputed amount.
Conclusion
Alembic Limited's ₹2.40 final dividend (2.63% yield) is best understood for what it really is: the relay of a dividend collected from Alembic Pharmaceuticals, not a reward earned from booming operations. On the positives, the company is almost debt-free, sits on investments worth more than its entire market cap, has never cut its dividend, and covers the payout comfortably on earnings (5.15× consolidated) and operating cash flow (1.95×).
Positives
Debt-free balance sheet; deep cash + investment cover (4.4×); consistent 10-year payer; large holding-company discount to investment value; clean audit opinion.
Negatives / Watch-outs
Own profit down ~12%; reported FCF below the dividend (0.70×); payout frozen 3 years; standalone payout near 50%; dividend structurally tied to the pharma associate; AGM approval pending.
We present the evidence — positives, negatives, risks and monitoring points — and leave the decision to you. This is analysis, not advice.
Frequently Asked Questions
What dividend has Alembic Limited announced for FY26?
What is the dividend yield?
What is the record date for the Alembic dividend?
What is the ex-date?
When will the dividend be paid?
Who is eligible to receive it?
How is this dividend taxed?
Is the dividend sustainable?
What is Alembic Limited's dividend history?
What should investors monitor?
Why is consolidated profit up but standalone profit down?
Why does the stock trade below the value of its investments?
Disclaimer
This article is published by ShareBazaar Online for informational and educational purposes only and is not investment advice. It does not constitute a buy, sell, or hold recommendation. ShareBazaar Online is not a SEBI-registered investment adviser. Figures are drawn from Alembic Limited's audited results dated 19 May 2026 and from third-party sources (NSE/BSE, Screener, TipRanks, Trendlyne, company filings); some data points are labelled "Not Disclosed by Company," "Inferred," or "Not Independently Verified" and should be confirmed independently. Live market price, ex-date and payment date must be re-verified at the time of reading. Securities markets carry risk; please consult a SEBI-registered adviser and read all offer documents before investing. Past dividend performance does not guarantee future payouts.