
Dividend Snapshot
*Yield on last verified close of ₹456.10 (24 Jul 2026, NSE). CMP must be re-verified at publish time; the stock trades ex-dividend on 31 Jul 2026.
Dividend Announcement Summary
At its board meeting on 21 May 2026, the Board of Directors of Igarashi Motors India Limited recommended a final dividend of ₹1.30 per equity share of ₹10 face value for the financial year ended 31 March 2026. The recommendation was made alongside the audited FY26 results, on which the statutory auditor (B S R & Co. LLP) issued an unmodified opinion.
The headline that most aggregators miss: this ₹1.30 payout is a 48% cut from the ₹2.50 paid for FY25. The reduction was not a capital-return decision — it tracked a matching collapse in profit. Net profit for FY26 fell ~50% to ₹12.15 crore from ₹24.17 crore, even as revenue rose. Management effectively held the payout ratio near one-third of earnings, so a smaller profit produced a smaller dividend.
Key Dates Timeline
Ex-date inferred as record date under the T+1 settlement convention and confirmed by the company’s Regulation 42 record-date intimation dated 13 July 2026. Exact payment date not disclosed by company; 30-day statutory outer limit shown.
Dividend Yield Analysis
At roughly 0.29%, Igarashi’s yield is less than half the auto-ancillary average. This is not an income stock. The low yield is a product of a high share price relative to a thin dividend: the stock trades near 118× earnings despite the profit fall, so even a modest ₹1.30 payout screens as a negligible yield.
Yield reality check: the yield fell versus last year for the “wrong” reason — the dividend was cut (₹2.50 → ₹1.30), not because the price rose. A rising price cutting the yield can be benign; a shrinking dividend cutting the yield reflects weaker earnings. Here it is the latter.
Dividend History Analysis
| Financial Year | Dividend / Share | Type | Ex-Date |
|---|---|---|---|
| FY2025-26 | ₹1.30 | Final | 31 Jul 2026 |
| FY2024-25 | ₹2.50 | Final | 31 Jul 2025 |
| FY2023-24 | ₹1.00 | Final | 31 Jul 2024 |
| FY2022-23 | ₹1.00 | Final | 31 Jul 2023 |
| FY2020-21 | ₹1.50 | Final | 29 Jul 2021 |
| FY2019-20 | ₹1.20 | Final | 9 Sep 2020 |
| FY2018-19 | ₹4.90 | Final | 19 Sep 2019 |
| FY2017-18 | ₹5.34 | Final | 2 Aug 2018 |
| FY2016-17 | ₹5.88 | Final | 25 Jul 2017 |
History compiled from exchange/registrar dividend records (TipRanks, exchange filings). Figures on a ₹10 face value basis. FY2021-22 record not independently verified.
Classification: Cyclical Payer. Igarashi has paid a dividend every year, but the amount has swung widely with earnings — from ₹5–6 at the 2017–18 profit peak down to the ₹1–2.50 range since FY20. It is a consistent payer but not a consistent grower.
The FY26 ₹1.30 is the first cut in three years after two years of increases (₹1.00 → ₹2.50 → ₹1.30). Anyone extrapolating last year’s ₹2.50 would have mis-modelled 2026 income by nearly half.
Financial Performance Analysis
| Metric (₹ crore) | FY2024-25 | FY2025-26 | Change |
|---|---|---|---|
| Revenue from operations | 838.42 | 865.92 | +3.3% |
| EBITDA | 95.05 | 82.73 | −13.0% |
| EBITDA margin | 11.34% | 9.55% | −179 bps |
| Profit before tax | 32.51 | 16.51 | −49.2% |
| Net profit (PAT) | 24.17 | 12.15 | −49.7% |
| EPS (₹) | 7.68 | 3.86 | −49.7% |
The core finding wire-services skip: this is textbook negative operating leverage. Revenue grew 3.3%, yet PBT and PAT both nearly halved. When sales rise but profit falls this hard, the cause is cost structure, not demand. Two line items did the damage:
- Employee benefit expense rose ~18% (+₹6.83 crore), including a one-time ₹71.95 lakh charge from the new Labour Codes effective 21 Nov 2025.
- Other expenses rose ~23% (+₹4.77 crore) — the single largest swing factor.
- These outran a 3.3% revenue rise, and a ₹5.46 crore step-up in depreciation added further pressure. Lower finance costs (−₹2.39 crore) only partly offset the damage.
Segment split matters: the automotive segment actually grew 9.4% to ₹761.78 crore (88% of revenue), but the non-automotive segment shrank 26.8% to ₹104.14 crore — a drag the consolidated top-line partly masks. The profit decline is a margin story, not a revenue story.
Cash Flow Analysis
Reported profit is an opinion; cash is a fact. Here the two diverge favourably: PAT was only ₹12.15 crore, but the business generated ₹93.80 crore of operating cash — because a heavy ₹57 crore depreciation and amortisation charge depresses profit without consuming cash. On cash generation, FY26 was far healthier than the profit line suggests.
But the dividend is funded from current cash flow, not reserves. After ₹79.82 crore of capex — a heavy investment year — free cash flow shrinks to ₹13.98 crore. The ₹4.09 crore dividend is comfortably covered 3.4× by FCF, so it is affordable. The caveat: if capex stays this elevated and profits do not recover, the FCF cushion is thinner than the raw OCF number implies.
Cash-quality flag: trade receivables jumped +24.6% to ₹216.23 crore against only +3.3% revenue growth — roughly 91 days of sales locked in receivables. Rising receivables far ahead of sales is a classic sign that reported growth is not fully converting to collected cash, and it is a key reason the company still leans on short-term borrowings.
Balance Sheet Strength
Net worth is solid at ₹466.63 crore and gearing is moderate at 0.28×. The non-obvious point: Igarashi holds only ₹4.54 crore of cash and investments against ₹129 crore of borrowings. This is a net-debt company paying a dividend — the payout comes from operating cash flow, not a cash pile.
Because the cash balance is so thin, cash coverage of the dividend is just 1.1× — the balance sheet alone could barely fund one year’s payout. That is acceptable only because operating cash generation is strong and the dividend is small. It does, however, explain why Igarashi keeps ₹111.76 crore of current borrowings to finance its large working-capital base (receivables + inventory of ~₹333 crore).
Dividend Sustainability Analysis
| Sustainability Test | Metric | Read |
|---|---|---|
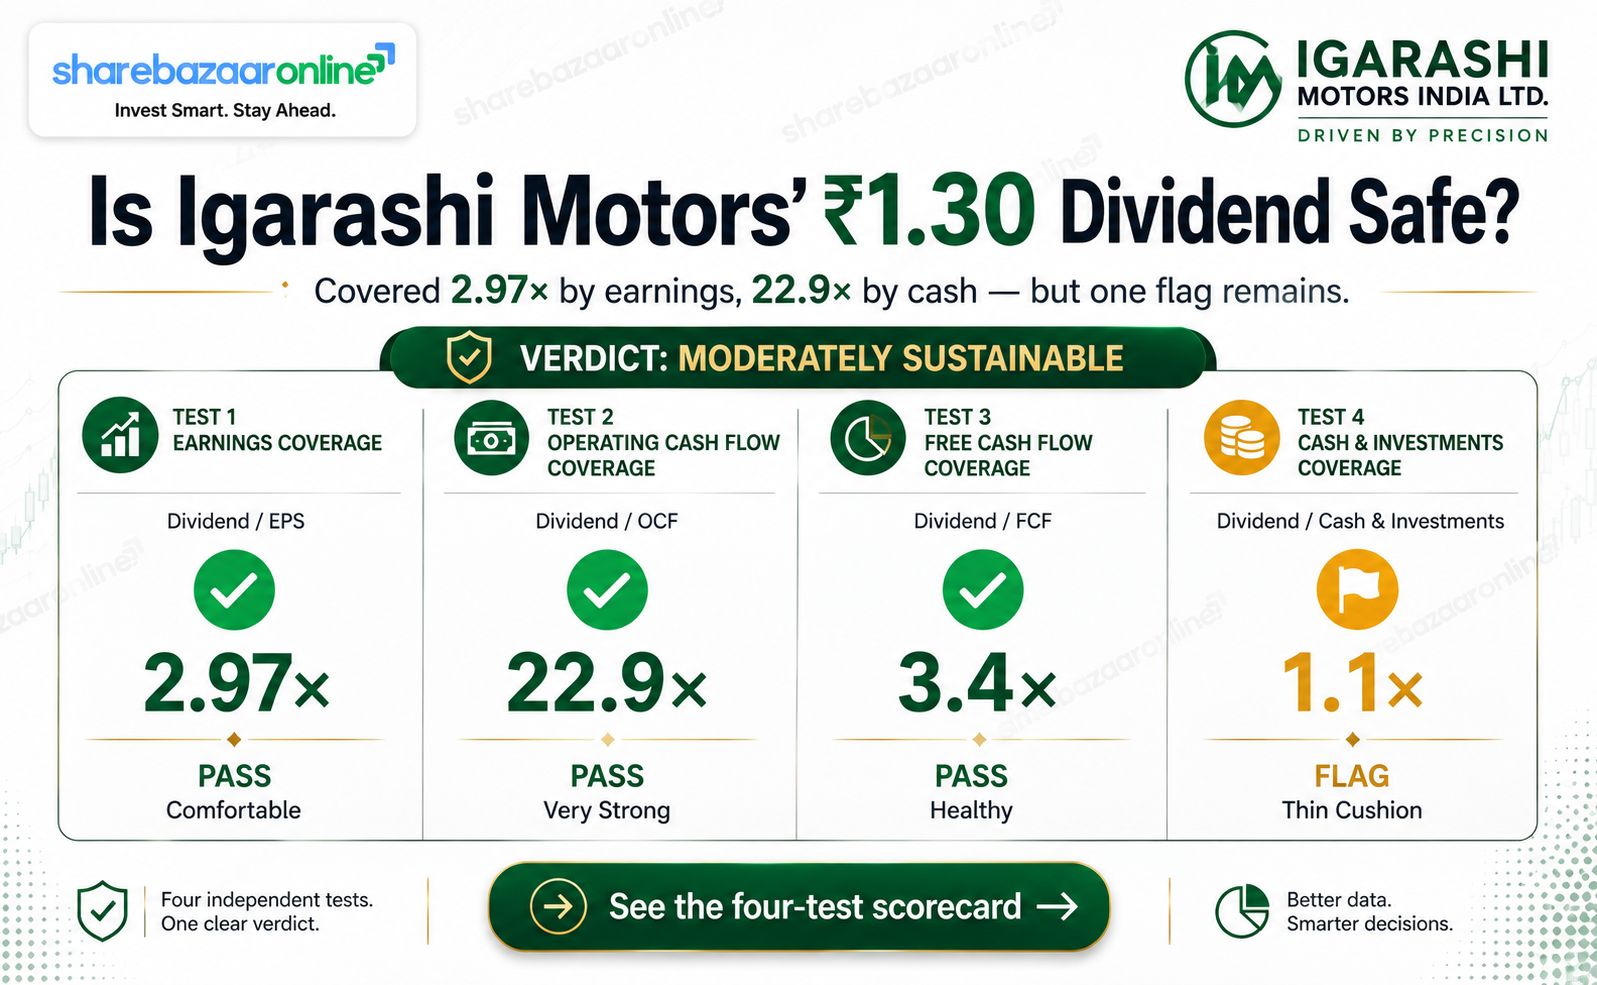
| Earnings coverage (EPS ÷ DPS) | 2.97× | Comfortable |
| OCF coverage (OCF ÷ outflow) | 22.9× | Very strong |
| FCF coverage (FCF ÷ outflow) | 3.4× | Adequate |
| Cash coverage (cash ÷ outflow) | 1.1× | Thin cushion |
Verdict: Moderately Sustainable. The dividend itself is tiny (₹4.09 crore) relative to ₹93.80 crore of operating cash, so affordability is not in question — earnings, OCF and FCF all cover it with room to spare. The flags are qualitative, not arithmetic: (1) the payout ratio at ~34% is fine, but it sits on a profit base that just halved; (2) the cash cushion is thin; and (3) the payout has already been cut once in response to weaker profit. If FY27 earnings do not stabilise, a further trim — not a suspension — would be the likely lever.
Peer Comparison
| Company | Div Yield | Payout | ROE | P/E |
|---|---|---|---|---|
| Igarashi Motors | ~0.29% | ~34% | 2.6% | ~118× |
| Sundram Fasteners | ~0.75% | ~30% | ~13.8% | ~30× |
| Suprajit Engineering | — | — | — | ~37× |
| Pricol | — | — | — | ~30× |
| Auto-components avg | ~0.6% | — | — | — |
Peer cells marked “—” are left blank where data could not be verified from primary sources. Peer figures are indicative and must be re-verified at publish time.
Against a well-run comparator like Sundram Fasteners — ~0.75% yield, ~14% ROE, ~30× P/E — Igarashi screens as lower-yielding, far lower-return, and dramatically more expensive (a 118× P/E on a 2.6% ROE). On a payout-ratio basis the two are similar (~30–34%), but the quality of the earnings backing that payout is not comparable.
Promoter Impact Analysis
The promoter group — led by Agile Electric Sub Assembly (part of the Igarashi Electric Works, Japan group) — holds 75%, so roughly ₹3.07 crore of the ₹4.09 crore flows back to promoters. Institutional interest is minimal (FII ~0.1%, DII ~2.1%), so the free-float retail and public shareholder base of ~22.8% shares the remaining ~₹1.02 crore. The distribution is proportionate to holdings — there is no preferential class — but the small free float and negligible institutional ownership are worth noting for liquidity and price-discovery.
Taxation Analysis
Since FY 2020-21, dividends in India are taxable in the hands of the shareholder at their applicable income-tax slab rate — there is no separate Dividend Distribution Tax. The company deducts TDS at 10% on dividends only where the total dividend paid to a resident shareholder in a financial year exceeds ₹5,000 (a higher 20% rate applies if PAN is not furnished). Shareholders with income below the taxable limit can file Form 15G/15H to avoid TDS. Igarashi’s intimation referenced the Income-tax Act, 2025 framework and set a 24 July 2026 deadline for submitting tax documents.
Worked example — retail investor holding 1,000 shares
Illustrative only; excludes surcharge/cess. A ₹1,300 payout is below the ₹5,000 TDS threshold, so no tax is withheld at source — but it remains taxable and must be declared. Not tax advice.
Key Risks
1. Margin compression persists
EBITDA margin fell 179 bps to 9.55% as employee and other costs outran revenue. If this cost base sticks, profit stays depressed.
2. Extreme valuation vs earnings
A ~118× P/E on a 2.6% ROE leaves little room for disappointment; any further profit miss carries de-rating risk.
3. Working-capital / receivables stretch
Receivables rose 24.6% vs 3.3% sales growth (~91 days), tying up cash and sustaining reliance on ~₹112 crore of short-term debt.
4. Non-automotive segment decline
The non-auto (incl. BLDC/consumer) segment fell 26.8%, undercutting the diversification thesis away from auto cyclicality.
5. Customer / export concentration
As a Tier-1 micro-motor supplier with heavy export exposure, Igarashi is sensitive to global auto demand, FX and a few large OEM relationships.
6. AGM approval & cyclical payout
The dividend is not final until the 7 Aug 2026 AGM, and history shows the payout can be cut sharply when earnings fall.
What To Monitor
1. Quarterly EBITDA margin trajectory
Watch whether margin recovers from 9.55% toward the ~11% prior level — the single most important swing factor for profit.
2. Receivable days & cash conversion
Track whether the 91-day receivables normalise and OCF continues to exceed reported profit.
3. Capex cycle & FCF
FY26 capex was ~₹80 crore. A moderation would rebuild the FCF cushion; continued heavy spend keeps it thin.
4. Non-automotive / BLDC recovery
Re-acceleration of the non-auto and ESDM/BLDC lines would validate diversification and lift blended margins.
5. Order book & new-programme wins
New actuator/EV motor programmes and export order momentum drive the multi-year revenue base.
6. Debt & interest cost
Whether short-term borrowings (~₹112 crore) fall as working capital eases, and the direction of finance costs.
Conclusion
Positives
- Strong operating cash generation — ₹93.80 crore OCF, 7.7× PAT.
- Dividend comfortably covered by earnings (2.97×) and FCF (3.4×); every-year payer.
- Moderate gearing (0.28×) and a solid ₹466 crore net worth; automotive segment grew 9.4%.
Negatives
- Profit nearly halved despite revenue growth — sharp negative operating leverage.
- Dividend cut 48% (₹2.50 → ₹1.30); yield a negligible ~0.29%.
- Very thin cash cushion (1.1×), 24.6% receivables jump, and a ~118× P/E on 2.6% ROE.
Igarashi’s FY26 dividend is safe but small, and lower than last year for a reason: earnings, not generosity, set the payout. For income seekers the ~0.29% yield is immaterial. The more important story for any shareholder is whether margins recover — the dividend will follow the profit, as it always has. We present the evidence; the decision is yours.
Frequently Asked Questions
What dividend has Igarashi Motors announced for FY2025-26?
What is the dividend yield?
What is the record date?
What is the ex-date?
When will the dividend be paid?
Who is eligible for the dividend?
How is the dividend taxed?
Is the dividend sustainable?
What is Igarashi’s dividend history?
Why did profit fall when revenue rose?
Is the dividend funded from cash reserves or borrowings?
How much of the dividend goes to promoters?
What should investors monitor from here?
What does Igarashi Motors India do?
Disclaimer
This article is published by ShareBazaar Online for informational and educational purposes only and does not constitute investment, financial, legal or tax advice, nor a recommendation to buy, sell or hold any security. ShareBazaar Online is not a SEBI-registered investment adviser or research analyst. Figures are drawn from the company’s audited FY2025-26 results, exchange filings and third-party market data; some market figures (current market price, exact announcement-date price and certain peer metrics) are indicative and must be independently re-verified at the time of reading, as prices and yields change continuously. The recommended dividend is subject to shareholder approval at the AGM. Readers should conduct their own due diligence and consult a SEBI-registered adviser and a qualified tax professional before making any decision. ShareBazaar Online accepts no liability for any loss arising from the use of this information.