
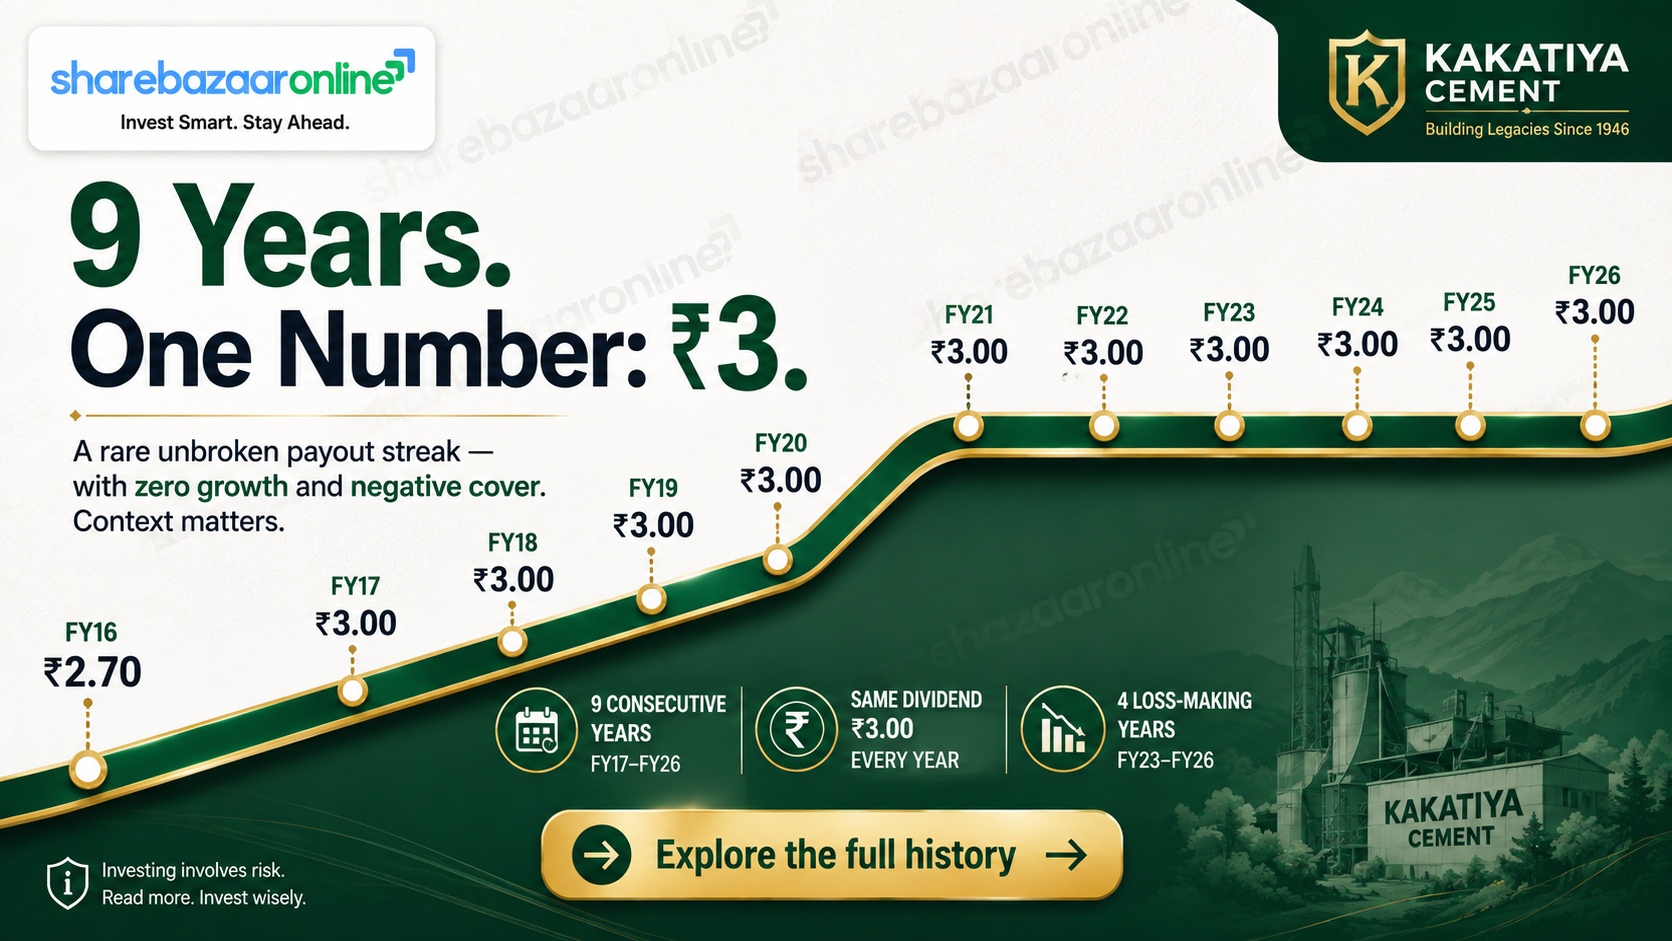
Dividend Snapshot
Kakatiya Cement Sugar & Industries Limited (NSE: KAKATCEM, BSE: 500234) has fixed a record date of 3 August 2026 for its FY2025-26 final dividend of ₹3.00 per share (a 30% payout on the ₹10 face value). The payout is subject to shareholder approval at the 47th Annual General Meeting on 10 August 2026.
Dividend per share: ₹3.00
Dividend type: Final Dividend (FY2025-26)
Dividend percentage: 30% on ₹10 face value
Face value: ₹10
Dividend yield (at CMP ₹122.40): 2.45%
ISIN: INE437B01014
Record date: 3 August 2026
Ex-date: 3 August 2026 (inferred under T+1 convention)
Book closure: 4 August – 10 August 2026
AGM date: 10 August 2026
Payment date: Not Disclosed by Company
Total dividend outflow: ₹2.33 crore
The non-obvious point: This ₹3.00 dividend is being paid in a year the company reported a net loss of ₹24.1 crore — the fourth consecutive loss-making year. The dividend is therefore funded from accumulated reserves (₹175 crore), not from current profits or cash generation. Wire-service listings that only quote the "2.45% yield" miss this entirely.
Dividend Announcement Summary
The Board of Directors recommended a final dividend of ₹3.00 per equity share for the financial year ended 31 March 2026 at its board meeting held on 28 May 2026. Subsequently, on 8 July 2026, the company filed a Book Closure / Record Date intimation with BSE and NSE under Regulation 42 of SEBI (LODR) Regulations, 2015, confirming the record date and the AGM schedule.
What the company disclosed
- Register of Members closed 4–10 August 2026 (both days inclusive)
- Record date: 3 August 2026
- Purpose: AGM and payment of dividend
- 47th AGM: Monday, 10 August 2026
What the company did NOT disclose
- Exact dividend payment date — Not Disclosed by Company
- Ex-date is not stated in the circular (inferred under T+1)
- Final dividend remains subject to AGM approval before it becomes a liability
Key Dates Timeline
| Event | Date | Source / Note |
|---|---|---|
| Board recommendation | 28 May 2026 | Board meeting (FY26 results + dividend) |
| Record date circular filed | 8 July 2026 | Reg. 42 intimation to BSE/NSE |
| Ex-date | 3 August 2026 | Inferred under T+1 convention |
| Record date | 3 August 2026 | Company disclosed |
| Book closure | 4–10 August 2026 | Company disclosed |
| AGM (approval) | 10 August 2026 | Dividend approval vote |
| Payment date | Not Disclosed by Company | Statutory outer limit: within 30 days of AGM approval |
Under India's T+1 settlement, the ex-date and record date fall on the same day. To be eligible for this dividend, an investor must hold the shares at the end of 3 August 2026. Buying on the ex-date itself does not confer eligibility. Investors should re-confirm the ex-date against the exchange corporate-action circular before acting.
Dividend Yield Analysis
Yield at current price (₹122.40, 2 Aug 2026): 2.45%
Yield at announcement (~₹130, late May 2026): ~2.31% (approx, not independently verified)
Sector (Basic Materials) average yield: ~0.5%
Post-tax yield (30% slab): ~1.72%
Yield reality check
KAKATCEM's 2.45% yield is roughly 5x the ~0.5% sector average. But a high yield here is not a sign of strength. It is the arithmetic result of a flat ₹3.00 dividend divided by a share price that has fallen ~24% over the past year (from a 52-week high near ₹165–₹179 down to ₹122). A falling denominator, not a rising numerator, is doing the work.
Bottom line: The optically attractive yield reflects a de-rated, loss-making business maintaining a token dividend, not a cash-rich compounder rewarding shareholders. Treat the yield as a symptom, not a signal.
Dividend History Analysis
| Financial Year | Dividend / Share | Ex / Record Date | Payment Date |
|---|---|---|---|
| FY2025-26 | ₹3.00 | 3 Aug 2026 | Not Disclosed |
| FY2024-25 | ₹3.00 | 21 Aug 2025 | 27 Sep 2025 |
| FY2023-24 | ₹3.00 | 22 Aug 2024 | 28 Sep 2024 |
| FY2022-23 | ₹3.00 | 18 Sep 2023 | 24 Oct 2023 |
| FY2021-22 | ₹3.00 | 30 Aug 2022 | 07 Oct 2022 |
| FY2020-21 | ₹3.00 | 25 Aug 2021 | 01 Oct 2021 |
| FY2019-20 | ₹3.00 | 01 Sep 2020 | 08 Oct 2020 |
| FY2018-19 | ₹3.00 | 03 Jul 2019 | 09 Aug 2019 |
| FY2017-18 | ₹3.00 | 11 Sep 2018 | 19 Oct 2018 |
| FY2016-17 | ₹3.00 | 15 Sep 2017 | 24 Oct 2017 |
| FY2015-16 | ₹2.70 | 12 Sep 2016 | 26 Oct 2016 |
Dividend history sourced from TipRanks / exchange corporate-action records. Historical dates not re-verified line-by-line.
Classification: Consistent Payer (flat, zero-growth)
The company has paid ₹3.00 per share every year for nine consecutive years (since FY2016-17), up marginally from ₹2.70 in FY2015-16. On consistency, the record is genuinely strong — no cuts, no suspensions, no missed years.
The catch: consistency without growth or cover
Zero dividend growth over nine years means no real income growth for holders. More importantly, the dividend has stayed flat even as the business swung from a ₹19 crore profit (FY22) to losses in FY23, FY24, FY25 and FY26 — so consistency here reflects board policy, not earnings power.
Financial Performance Analysis
| ₹ Crore | FY22 | FY23 | FY24 | FY25 | FY26 |
|---|---|---|---|---|---|
| Revenue | 154 | 154 | 156 | 89 | 79 |
| Operating Profit | 22 | -19 | -7 | -21 | -21 |
| OPM % | 14% | -12% | -4% | -24% | -27% |
| Net Profit | 19 | -4 | -1 | -13 | -24 |
| EPS (₹) | 24.90 | -5.74 | -1.72 | -17.12 | -30.95 |
Source: Screener.in (standalone; company has no material subsidiaries).
Operating leverage in reverse
Revenue has halved from ₹156 crore (FY24) to ₹79 crore (FY26), a ~49% collapse in two years. Because cement and sugar are high fixed-cost businesses, falling volumes drop straight through to the bottom line: operating margins went from -4% to -27% as revenue fell. This is negative operating leverage — the exact opposite of a scaling business.
Losses are widening, not narrowing
The net loss deepened from ₹1 crore (FY24) to ₹13 crore (FY25) to ₹24 crore (FY26). FY22 was the last profitable year. The trend line is deteriorating, and the ₹24 crore FY26 loss is the largest in the visible ten-year history.
Cash Flow Analysis
| ₹ Crore | FY23 | FY24 | FY25 | FY26 |
|---|---|---|---|---|
| Operating Cash Flow | -38 | -13 | 14 | -21 |
| Investing Cash Flow | -2 | 9 | 106 | -13 |
| Financing Cash Flow | 40 | 3 | -83 | -2 |
| Free Cash Flow | -39 | -17 | 14 | -22 |
Source: Screener.in cash-flow statement.
How is this dividend actually funded?
In FY26, operating cash flow was -₹21 crore and free cash flow was -₹22 crore. The ₹2.33 crore dividend is not funded by current earnings (loss), not by operating cash (negative), and not by free cash flow (negative). It is funded from accumulated reserves and the cash cushion built up earlier.
The FY25 clue: a one-time asset monetisation
FY25 showed an unusual +₹106 crore investing inflow, which the company used to repay ~₹83 crore of borrowings (financing outflow). This looks like a one-time asset/investment monetisation that deleveraged the balance sheet — a non-recurring event, not recurring operating strength.
Cash discipline: The company is not borrowing to pay the dividend — borrowings actually fell. But it is drawing down reserves for both operating losses and the payout. That is affordable today, but it is capital erosion, not capital return from profits.
Balance Sheet Strength
Net worth (Mar 2026): ₹183 crore (Equity ₹8 Cr + Reserves ₹175 Cr)
Borrowings: ₹20 crore (down from ₹94 Cr in FY24)
Book value per share: ₹235
Price-to-book (at ₹122.40): 0.52x
Reserve cover of dividend: ~75x
The strength: low debt, deep reserves
On paper the balance sheet is comfortable: low leverage, ₹175 crore of reserves against a tiny ₹2.33 crore payout, and the stock trades at roughly half its book value (0.52x). The company can keep paying ₹3.00 for decades from reserves alone — affordability is not the concern.
The hidden strain: working capital
Beneath the tidy top line, working capital has ballooned. Inventory days jumped to ~853 (from ~338), debtor days rose to 83 (from 66), and the cash conversion cycle stretched to ~732 days. Cash is being trapped in unsold inventory and receivables — a key reason operating cash flow turned negative.
Contingent liabilities dwarf market cap
The company carries contingent liabilities of ~₹168 crore — larger than its entire ₹94 crore market capitalisation. These are off-balance-sheet claims (typically tax/legal disputes) that do not appear in reported profit but represent a real tail risk. Nature and probability not independently verified; see annual report.
Dividend Sustainability Analysis
| Coverage Test | Metric | Verdict |
|---|---|---|
| 1. Earnings coverage (EPS ÷ DPS) | -₹30.95 ÷ ₹3.00 = -10.3x | FAIL — loss |
| 2. Operating cash flow coverage | -₹21 Cr ÷ ₹2.33 Cr = -9.0x | FAIL — negative OCF |
| 3. Free cash flow coverage | -₹22 Cr ÷ ₹2.33 Cr = -9.4x | FAIL — negative FCF |
| 4. Reserve / balance-sheet coverage | ₹175 Cr ÷ ₹2.33 Cr = 75x | PASS — reserve-funded |
Verdict: Moderately Sustainable — affordable but unearned
Three of the four tests fail: the dividend is not covered by earnings, operating cash, or free cash flow. It passes only the balance-sheet test — reserves are so large relative to the ₹2.33 crore outflow that the company could sustain this token payout for decades even without a single profitable year. So the near-term risk of a cut is low, but the dividend is being funded by shrinking the company's own capital, not by the business earning it. Watch flag: if reserves keep eroding at ₹20–24 crore of annual losses, the buffer that makes this "sustainable" will thin over time.
Peer Comparison
| Company | Dividend / Share | Dividend Yield | ROE | Note |
|---|---|---|---|---|
| Kakatiya Cement | ₹3.00 | 2.45% | -8.5% | Flat 9 yrs; loss-making |
| Deccan Cements | ₹0.60 | ~0.06–0.44% | ~5.2% | Cut from ₹3.00 to ₹0.60 |
| Sagar Cements | ₹0.70 | ~0.3–0.4% | Not Verified | Payout well covered by cash |
| NCL Industries | Not Verified | Not Verified | Not Verified | Regional South peer |
| Sector (Basic Materials) avg | — | ~0.5% | — | Industry benchmark |
Peer figures from TipRanks / SimplyWallSt; cells marked "Not Verified" could not be confirmed from primary sources. Re-verify at publish time.
Read-through: KAKATCEM offers the highest headline yield in the peer set, but for the wrong reason — a de-rated price on a flat payout. Notably, a close comparable, Deccan Cements, actually cut its dividend from ₹3.00 to ₹0.60 when earnings weakened, while Kakatiya has held its payout flat through losses. That is a genuine capital-allocation divergence worth watching: one peer chose to conserve cash; Kakatiya chose to maintain the signal.
Promoter Impact Analysis
Promoter holding: 54.25%
Public holding: 45.75%
FII / DII holding: 0.00% / 0.00%
Total dividend outflow: ₹2.33 crore
Promoter share of dividend: ₹1.27 crore
Public share of dividend: ₹1.07 crore
Who benefits?
Of the ₹2.33 crore paid out, ~₹1.27 crore (54.25%) flows to the promoter group and ~₹1.07 crore to public shareholders. With no institutional holders (FII and DII both 0%), the entire non-promoter benefit accrues to ~18,571 retail shareholders.
Alignment note: Because the promoter owns a majority stake, a flat dividend maintained through losses provides the promoter a steady ₹1.27 crore/year cash stream from company reserves. This is not improper, but minority investors should recognise that the payout is drawn from shared reserves during a downturn rather than earned — a distribution that benefits the majority owner too.
Taxation Analysis
Since 1 April 2020, dividends in India are taxable in the hands of the shareholder at their applicable income-tax slab rate (the old Dividend Distribution Tax was abolished). The company must deduct TDS under Section 194 at 10% — but only if the total dividend paid to a shareholder in a financial year exceeds ₹5,000. Resident investors can file Form 15G / 15H to avoid TDS if their income is below the taxable limit; non-residents are taxed under Section 195 (subject to DTAA relief).
Worked example — retail investor, 1,000 shares
- Shares held: 1,000 | Dividend: ₹3.00/share | Tax slab: 30%
- Gross dividend: 1,000 × ₹3.00 = ₹3,000
- TDS under Section 194 (10%): ₹0 — because ₹3,000 is below the ₹5,000 threshold, no TDS is deducted
- Tax payable at 30% slab: ₹3,000 × 30% = ₹900
- Net dividend in hand (after tax): ₹2,100
- Effective post-tax yield (at ₹122.40): ~1.72%
Note: even though no TDS is deducted here, the ₹3,000 is still fully taxable and must be declared in the investor's return. A holder with more than ~1,667 shares would cross the ₹5,000 annual-dividend threshold and face 10% TDS at source.
Key Risks
- Widening losses: Net loss deepened to ₹24 crore in FY26, the largest in a decade, with operating margins at -27%. Continued losses steadily erode the reserve buffer.
- Revenue collapse: Sales fell ~49% from ₹156 crore (FY24) to ₹79 crore (FY26), pointing to lost volumes / weak realisations in cement and sugar.
- Working-capital lock-up: Inventory days near 853 and a cash conversion cycle of ~732 days trap cash and drive negative operating cash flow.
- Contingent liabilities (~₹168 crore): Larger than the ₹94 crore market cap; an adverse ruling could materially impair net worth.
- Reserve-funded dividend: Paying ₹3.00 while loss-making draws down capital; prolonged losses could eventually force a cut, mirroring peer Deccan Cements.
- Thin liquidity: The stock trades in the NSE trade-to-trade (BE) segment with very low volumes, making entry/exit difficult and prices volatile.
What To Monitor
- Return to operating profit: Watch quarterly operating margin — a move back above breakeven would be the first real turnaround signal.
- Operating cash flow trend: Track whether OCF turns positive; the dividend only becomes "earned" when cash generation recovers.
- Inventory and receivable days: A fall in inventory days (from ~853) would show demand recovering and cash unlocking.
- Reserve depletion pace: Monitor net worth (₹183 crore) each year — the speed at which losses shrink it determines dividend longevity.
- Segment performance (cement / sugar / power): Watch which division is dragging; sugar and power can offset cement cyclicality.
- Resolution of contingent liabilities: Any settlement or ruling on the ~₹168 crore exposure disclosed in the annual report.
Conclusion
Kakatiya Cement's ₹3.00 final dividend for FY2025-26 continues a genuinely rare nine-year streak of unbroken payouts. But the analysis underneath the headline yield tells a more careful story. The company is in its fourth straight loss-making year, revenue has nearly halved, and both operating and free cash flow are negative. The dividend is not earned — it is funded from ₹175 crore of accumulated reserves.
On the positive side, the balance sheet is lightly leveraged (₹20 crore debt), reserves cover the tiny ₹2.33 crore payout roughly 75 times over, and the stock trades at ~0.52x book value. So an immediate dividend cut looks unlikely. On the negative side, the 2.45% yield is a product of a falling share price, working capital is locked up, and contingent liabilities exceed the market cap. This is a classic case of an affordable-but-unearned dividend from a business in contraction. The facts are laid out above; the decision is the reader's.
Frequently Asked Questions
What dividend has Kakatiya Cement announced?
What is the dividend yield?
What is the record date?
What is the ex-date?
When will the dividend be paid?
Who is eligible for the dividend?
How is this dividend taxed?
Is the dividend sustainable?
What is Kakatiya Cement's dividend history?
Why is the company paying a dividend if it is loss-making?
How much of the dividend goes to promoters?
What should investors monitor going forward?
Is the high yield a good reason to buy?
Disclaimer
This article is published by ShareBazaar Online for informational and educational purposes only and does not constitute investment, financial, legal or tax advice, nor a recommendation to buy, sell or hold any security. ShareBazaar Online is not a SEBI-registered investment adviser. Figures are compiled from company filings and third-party sources (Screener.in, TipRanks, exchange disclosures) believed to be reliable but not independently guaranteed; certain items are labelled "Not Disclosed by Company", "Not Verified" or "inferred" accordingly. The current market price, ex-date and payment date must be re-verified against live exchange data before acting. The final dividend remains subject to shareholder approval at the AGM. Investing in equities carries risk, including loss of capital. Readers should consult a SEBI-registered adviser and conduct their own due diligence. Data as of 2 August 2026.