
Dividend Snapshot
Company
Coforge Limited
NSE: COFORGE | BSE: 532541 | ISIN: INE591G01025
Sector: IT Services & Consulting (Mid-cap)
Dividend Declared
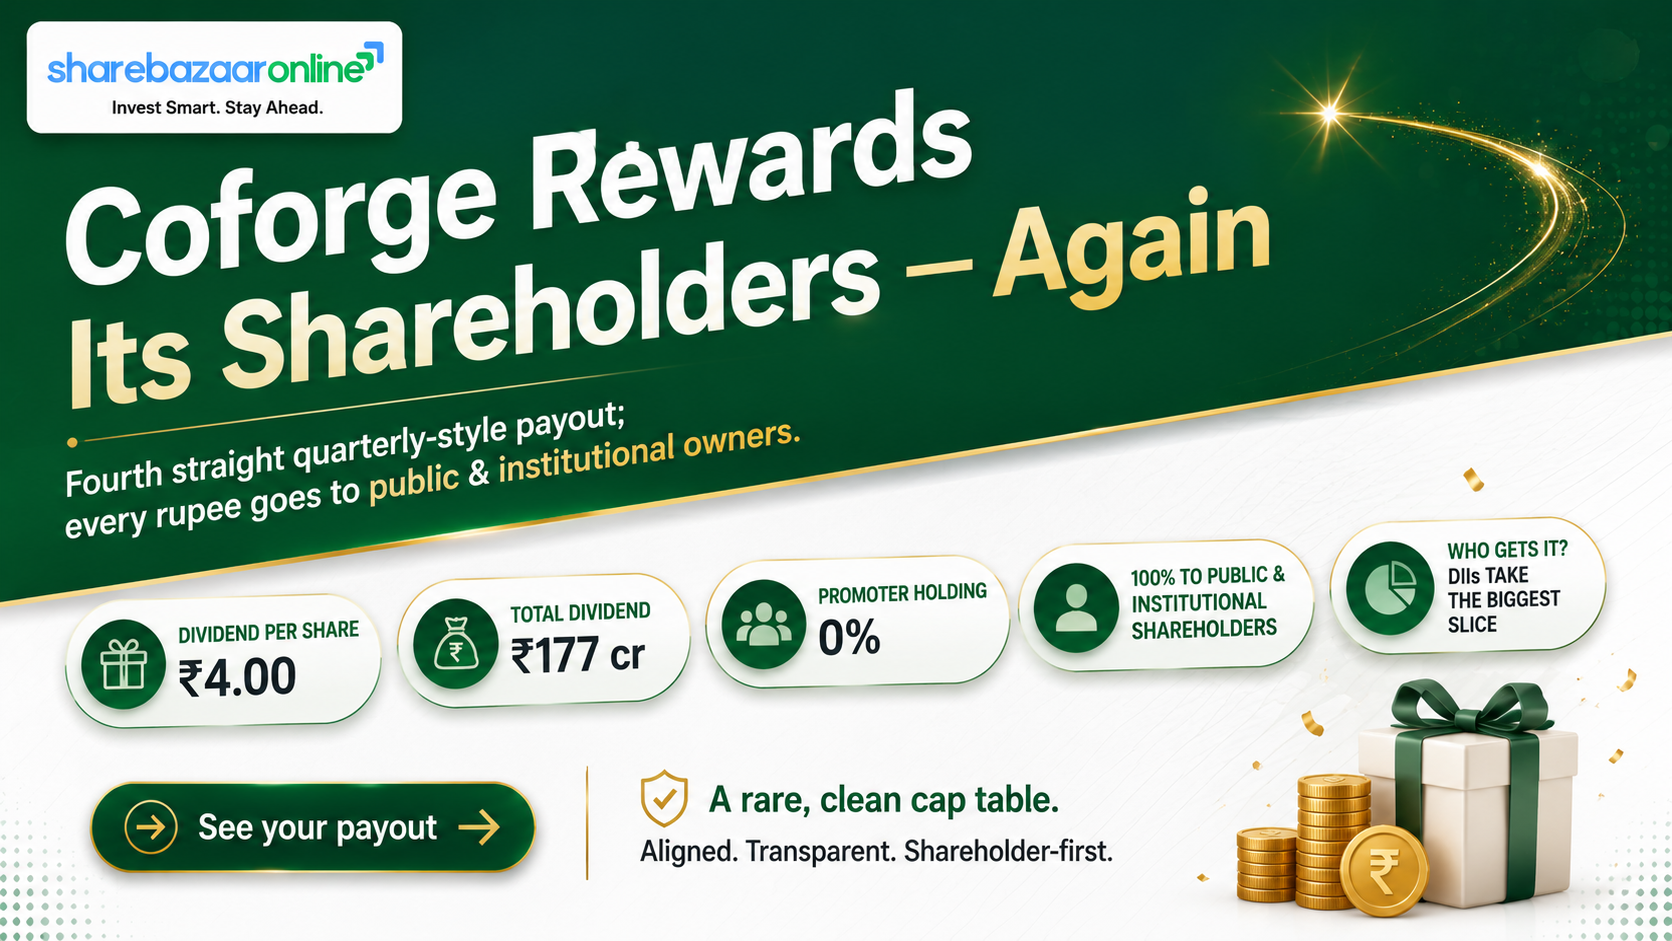
Interim Dividend — Rs 4.00 per share
On face value of Rs 2 = 200% of face value
For Financial Year 2026-27 (FY27)
Yield & Payout (computed)
Single-payment yield: 0.23%
Annualised trailing yield: ~0.93%
Payout (Rs 4 vs Q1FY27 EPS Rs 12.34): 32.4%
CMP Rs 1,721 (NSE close, 31-Jul-2026)
Key Dates
Announcement (Board): 27-Jul-2026
Record Date: 03-Aug-2026
Ex-Date: 03-Aug-2026 (same as record date under T+1)
Payment: within 30 days of declaration
Our one-line read: A modest, well-covered quarterly-style interim on an earnings basis (3.1x cover) — but at a run-rate the annual dividend now absorbs almost the entire free cash flow of a company that has just taken on acquisition debt. The story here is less the Rs 4 and more what the Encora deal has done to Coforge's cash engine.
Dividend Announcement Summary
At its board meeting held on 27 July 2026 (which ran from 7:00 PM to 11:05 PM IST), the Board of Coforge Limited declared an interim dividend of Rs 4 per equity share of face value Rs 2 each, fully paid-up, for the financial year 2026-27. The declaration was made under Regulation 30 and the record date fixed under Regulation 42 of the SEBI Listing Regulations. The same meeting approved the unaudited standalone and consolidated results for the quarter ended 30 June 2026, on which the statutory auditor (S R Batliboi & Associates LLP) issued an unmodified limited review opinion.
Because it is an interim dividend…
It does not require shareholder (AGM) approval — the Board's declaration is final and the payment obligation is already fixed. This is different from a final dividend, which is only a recommendation until members vote at the AGM.
Other board decisions the same evening
Re-appointment of Mr. O P Bhatt as Independent Director & Chairperson (May 2027–Apr 2032, subject to member approval), and in-principle approval to set up an entity in China for expansion. Both are structurally relevant to how future cash is deployed.
Key Dates Timeline
Board Declaration Date
27 July 2026
Company-disclosed
Exchange Intimation
28 July 2026
Reg 30 / Reg 42 filing to BSE & NSE
Record Date
03 August 2026
Company-disclosed (eligibility cut-off)
Ex-Dividend Date
03 August 2026
Under India's T+1 settlement, ex-date = record date. (Externally confirmed as 3-Aug-2026.)
Payment Date
Not Disclosed by Company
Statutory outer limit: within 30 days of declaration (i.e., on or before ~26-Aug-2026)
To be eligible, you must hold…
on/before 03-Aug-2026
Buying on the ex-date does not qualify you for this payout.
Dividend Yield Analysis
This single interim
Rs 4 ÷ Rs 1,721 = 0.23%
One payment only — not an annual figure.
Annualised (run-rate)
~Rs 16 ÷ Rs 1,721 = ~0.93%
Assumes four ~Rs 4 quarterly payments continue. Not guaranteed.
Yield Reality Check — why the yield looks small
Coforge's yield is low not because the dividend is weak, but because the share price is high. The stock trades near Rs 1,721 with a trailing P/E in the 37–56x range depending on the earnings base used — a growth-and-re-rating stock, not an income stock. Even a healthy Rs 16 annual payout divided into that price produces under 1%, which is below the Indian IT sector average of roughly 1.5–1.7%. Investors here are paid mainly through capital appreciation, with the dividend as a small top-up. Note also that all pre-2025 per-share dividend figures must be read on a split-adjusted basis — Coforge sub-divided its shares (face value Rs 10 → Rs 2), so an old "Rs 19" dividend is the same as today's "Rs 3.80."
Dividend History Analysis
All figures split-adjusted to current Rs 2 face value. Source: exchange corporate-action records (TipRanks/Trendlyne); FY totals inferred.
| Payout (Ex-Date) | Type | DPS (Rs, adj.) |
|---|---|---|
| 03-Aug-2026 | Interim (FY27) | 4.00 |
| ~Jan-2026 | Interim (FY26) | 4.00 |
| ~Oct-2025 | Interim (FY26) | 4.00 |
| 31-Jul-2025 | Interim (FY26) | 4.00 |
| 09-May-2025 | Final (FY25) | 3.80 |
| FY2024-25 | 4 payouts | ~15.20 |
| FY2023-24 | 4 payouts | ~15.20 |
Classification: Consistent Payer
Coforge has paid a dividend every year for the last decade and moved to a regular quarterly rhythm. The per-share amount has stepped up gradually (Rs 3.80 → Rs 4.00). No suspensions in recent years.
The caveat history hides
Longer-run data shows the dividend has not always risen smoothly — there have been reductions in the more distant past. Independent trackers flag the 10-year payout as "volatile" despite a high average growth rate. Consistency of frequency is not the same as consistency of amount.
Financial Performance Analysis
Consolidated, Rs Crore (converted from Rs Mn in filing). Q1 = quarter ended 30-Jun.
| Metric | Q1 FY27 | Q1 FY26 | YoY |
|---|---|---|---|
| Revenue from operations | 5,527.7 | 3,704.4 | +49.2% |
| Profit before exceptional & tax | 757.1 | 390.2 | +94.0% |
| PAT (continuing) | 531.7 | 286.2 | +85.8% |
| PAT (owners of Coforge) | 518.6 | — | — |
| Basic EPS (Rs) | 12.34 | 9.47 | +30.3% |
The number the headlines will miss: how much of this growth is bought, not built
The eye-catching +49% revenue jump is heavily acquisition-led. Coforge completed its 100% acquisition of Encora (a ~USD 550 million-funded, Rs 22,192 crore total-consideration deal) on 23 April 2026. The filing discloses that Encora alone contributed ~Rs 958 crore of revenue (about 17% of consolidated Q1 revenue) and ~Rs 158 crore of post-acquisition PAT (roughly 30% of consolidated Q1 profit). Strip Encora out and the organic YoY revenue growth is closer to ~23% — still strong, but a very different story from "49%." The Cigniti merger (12.67 million shares issued in June 2026) further inflates the consolidated base. Naive year-on-year comparisons overstate the organic momentum.
Operating leverage — the good part
Employee cost fell as a share of revenue from 59.8% to 56.5%, so profit before exceptionals grew faster (+94%) than revenue (+49%). Management guided FY26 EBIT margin at 14.4% (+370 bps) and targets FY27 consolidated EBITDA above 20.5%.
One-offs to note
Q1 carried Rs 55 crore of net exceptional expense (acquisition/integration Rs 61.3 cr, legal Rs 5 cr, a customer-receivable provision Rs 10.8 cr, offset by a Rs 22.1 cr FX gain on Bolivian-currency devaluation). Reported profit is clean-ish but not free of noise.
Cash Flow Analysis
Reported profits are opinions; cash is fact
On the latest trailing-twelve-month basis (externally sourced; Not Independently Verified against the annual report), Coforge generated roughly Rs 1,739 crore of operating cash flow, spent about Rs 1,031 crore on capital expenditure, and was left with approximately Rs 708 crore of free cash flow. The quarterly cash flow statement was not part of this results filing, so these are indicative TTM figures pending the FY26 annual report.
Heavy capex is the swing factor
Coforge converts profit to operating cash reasonably well, but capex of ~Rs 1,031 crore consumes well over half of operating cash flow. This is a capital-intensive phase (delivery build-out, integration, and now a China entity), so free cash flow is materially thinner than headline profit suggests.
How is the dividend funded?
A single Rs 4 interim (Rs 177 cr) is comfortably covered by free cash flow (about 4x). But the annualised Rs 16 run-rate (Rs 708 cr) is funded almost entirely out of that same Rs 708 cr of free cash — a ~1.0x FCF coverage. With acquisition borrowings now on the books, at the run-rate there is little cash cushion after the dividend.
Balance Sheet Strength
The most un-IT thing about Coforge right now: it carries debt
Most large Indian IT firms are net-cash. Coforge is not. To fund Encora, the group raised USD 550 million of borrowings (~Rs 4,600 crore) and the deal created ~Rs 12,089 crore of goodwill. Consequently, consolidated finance costs jumped ~87% year-on-year to Rs 86.6 crore in Q1 FY27. Externally sourced balance-sheet snapshots (cash ~Rs 571 cr, borrowings ~Rs 972 cr) predate the full acquisition draw and are Not Independently Verified; the true net-debt figure is higher once the USD 550 million is reflected.
Equity base has expanded
Other equity stood at Rs 9,470 crore at FY26 year-end. Share swaps for Encora and Cigniti have increased the share count, which is why per-share returns (ROE ~15% on the enlarged base) look lower than Coforge's historically high-20s ROE.
Goodwill is now large
A ~Rs 12,089 crore goodwill balance means future returns depend on Encora delivering. Any impairment would hit reported profit (though not cash or the dividend directly). This is a quality-of-balance-sheet watch item.
Dividend Sustainability Analysis
Test 1 — Earnings cover: Pass
Q1 EPS Rs 12.34 covers the Rs 4 interim 3.1x; annual payout ratio ~34.5% of FY26 EPS — conservative.
Test 2 — Operating cash cover: Pass
TTM OCF ~Rs 1,739 cr covers the annual Rs 708 cr run-rate ~2.5x.
Test 3 — Free cash cover: Watch
FCF ~Rs 708 cr vs annual dividend ~Rs 708 cr = ~1.0x. The run-rate dividend eats nearly all free cash after heavy capex.
Test 4 — Balance-sheet cover: Watch
Company now carries acquisition debt (USD 550 mn) rather than a large net-cash buffer. Less shock absorption than a typical IT peer.
Verdict: Sustainable on earnings — Moderately Sustainable on cash
The dividend is safe from an earnings standpoint and is a small fraction of profit. The honest flag is that at the current run-rate it is funded out of essentially all free cash flow while the company is simultaneously investing heavily and servicing new debt. If capex stays elevated or integration costs run over, Coforge would likely prioritise growth and de-leveraging over dividend increases. Expect steady, not rapidly rising, per-share dividends near-term.
Peer Comparison
Cells marked "NIV" = Not Independently Verified from primary sources at publish time; re-confirm before publishing. Yields move daily.
| Company | Approx. Yield | Payout | ROE (3-yr) | Balance sheet |
|---|---|---|---|---|
| Coforge | ~0.93% | ~34.5% | ~15% (post-deal) | Net debt (post-Encora) |
| Persistent Systems | ~0.7–0.8% | ~36.5% | ~25.6% | Net cash |
| LTIMindtree | NIV | NIV | NIV | Net cash |
| Mphasis | NIV | NIV | NIV | Net cash |
| IT sector (avg) | ~1.5–1.7% | NIV | NIV | Mostly net cash |
The takeaway is relative: Coforge yields less than most mid-cap IT peers and, uniquely among them, is not sitting on a net-cash pile — it has chosen aggressive M&A-led growth over cash-return maximisation. For a dividend-first investor, peers like Persistent offer comparable-or-better yield with a cleaner balance sheet. For a growth investor, Coforge's lower payout and reinvestment are the point.
Promoter Impact Analysis
There is no promoter — and that changes the whole story
Coforge's promoter holding is 0%. The erstwhile promoter (Hulst BV, part of the Baring PE lineage) exited entirely over the years. This is a genuinely professionally-managed, board-controlled company — unusual for an Indian mid-cap. So the frequent Indian criticism that "dividends mainly enrich the promoter family" simply does not apply here. Every rupee of the Rs 177 crore single payout flows to public and institutional shareholders.
Where the Rs 177 cr goes
DIIs (42.62%) receive ~Rs 75 cr; FIIs (24.31%) ~Rs 43 cr; public/retail (~33%) ~Rs 58 cr; promoter Rs 0.
What to infer from it
With mutual funds as the largest owners, dividend policy is set with institutional discipline, not family cash needs. That tends to favour capital allocation toward growth — consistent with the modest payout ratio.
Taxation Analysis
How dividends are taxed in India (post-2020 rules)
Since the abolition of Dividend Distribution Tax, dividends are taxable in the hands of the shareholder at their applicable income-tax slab rate. The company deducts TDS under Section 194 at 10% if total dividend paid to a resident shareholder from that company exceeds Rs 10,000 in a financial year (revised threshold; historically Rs 5,000). Submitting Form 15G/15H can prevent TDS where income is below the taxable limit. Non-residents are taxed under Section 195, subject to applicable DTAA relief.
Worked example — a retail investor with 1,000 shares
| Shares held | 1,000 |
| Interim dividend @ Rs 4 | Gross Rs 4,000 |
| TDS on this payment | Nil (below the annual TDS threshold on a single payout) |
| Tax at 30% slab + 4% cess (31.2%) | Rs 1,248 |
| Net dividend in hand | Rs 2,752 |
| Effective post-tax yield (on CMP Rs 1,721) | ~0.16% for this single payout |
If your annual Coforge dividends cross the TDS threshold, 10% is deducted at source and adjusted against your final tax. Illustrative only — not tax advice.
Key Risks
1. Integration & goodwill risk
A ~Rs 12,089 cr goodwill balance from Encora means returns depend on integration going to plan; a shortfall risks impairment and margin drag.
2. Leverage & interest-rate risk
USD 550 mn of borrowings pushed finance costs up ~87% YoY. Higher-for-longer rates or a weaker rupee raise servicing costs.
3. Client-concentration & discretionary-spend risk
As a mid-cap IT services firm, Coforge is exposed to slower US/Europe tech budgets and to any large-client ramp-down.
4. Litigation overhang
A class-action complaint tied to a customer's cybersecurity incident remains open; the company disputes liability, but outcomes are uncertain.
5. Valuation & FX risk
A rich multiple (P/E ~37–56x) leaves little room for disappointment; a large share of revenue is USD/GBP/EUR-linked, adding currency volatility.
6. Dividend-growth risk
With run-rate dividend near 1.0x FCF and heavy reinvestment, meaningful per-share hikes may be paused in favour of growth/de-leveraging.
What To Monitor
1. FY27 EBITDA vs the 20.5% guide
Management targets consolidated EBITDA above 20.5%. Track each quarter to see whether Encora is accretive or dilutive to margin.
2. Free cash flow & capex trajectory
Watch whether FCF rebuilds a cushion above the dividend as capex normalises post-integration.
3. Net-debt reduction pace
How quickly the USD 550 mn is repaid signals whether the balance sheet returns to the IT-sector norm of net cash.
4. Order intake & executable book
The ~USD 1.75 bn 12-month executable book and quarterly large-deal wins are the leading indicators of revenue durability.
5. Organic (ex-Encora) growth
Once acquisitions anniversary, the "clean" organic growth rate is what matters. Watch for it to hold in the high-teens/low-20s.
6. Dividend policy signals
Whether the Rs 4 quarterly cadence holds, rises, or pauses is the clearest read on management's cash-return intent.
Conclusion
Positives
Consistent quarterly payer with a conservative ~34% payout, strong earnings coverage (3.1x on this interim), improving operating margins, a large executable order book, and a clean ownership structure with no promoter conflict.
Negatives / cautions
Low absolute yield (~0.93% annualised, below sector), run-rate dividend near 1.0x free cash flow, newly-added acquisition debt and heavy goodwill, elevated capex, an open litigation matter, and a headline growth rate flattered by the Encora and Cigniti consolidations.
Net-net: this is a growth company that pays a small, dependable dividend, not an income stock. The Rs 4 interim is safe and well-covered on earnings; the more interesting question for shareholders is how the Encora bet plays out for cash generation over the next few quarters. We present the facts above; the decision is yours.
Frequently Asked Questions
What dividend has Coforge announced?
What is the dividend yield?
What is the record date?
What is the ex-date?
When will the dividend be paid?
Who is eligible for the dividend?
How is this dividend taxed?
Is the dividend sustainable?
What is Coforge's dividend history?
Why did revenue jump ~49% — is the business really growing that fast?
Does the promoter benefit from this dividend?
What should investors monitor going forward?
Disclaimer
This article is for informational and educational purposes only and does not constitute investment, financial, legal or tax advice, nor a recommendation to buy, sell or hold any security. ShareBazaar Online is not a SEBI-registered investment adviser or research analyst. Figures are drawn from Coforge Limited's exchange filing dated 27–28 July 2026 and from third-party sources believed reliable; items labelled "Not Independently Verified" or "Not Disclosed by Company" should be independently confirmed. Market price, yield, and balance-sheet figures change continuously and were current only as of the referenced dates. Dividend receipt is subject to the record date and applicable regulations. Please consult a SEBI-registered adviser and a qualified tax professional before acting. Investments in securities are subject to market risks; read all related documents carefully.