
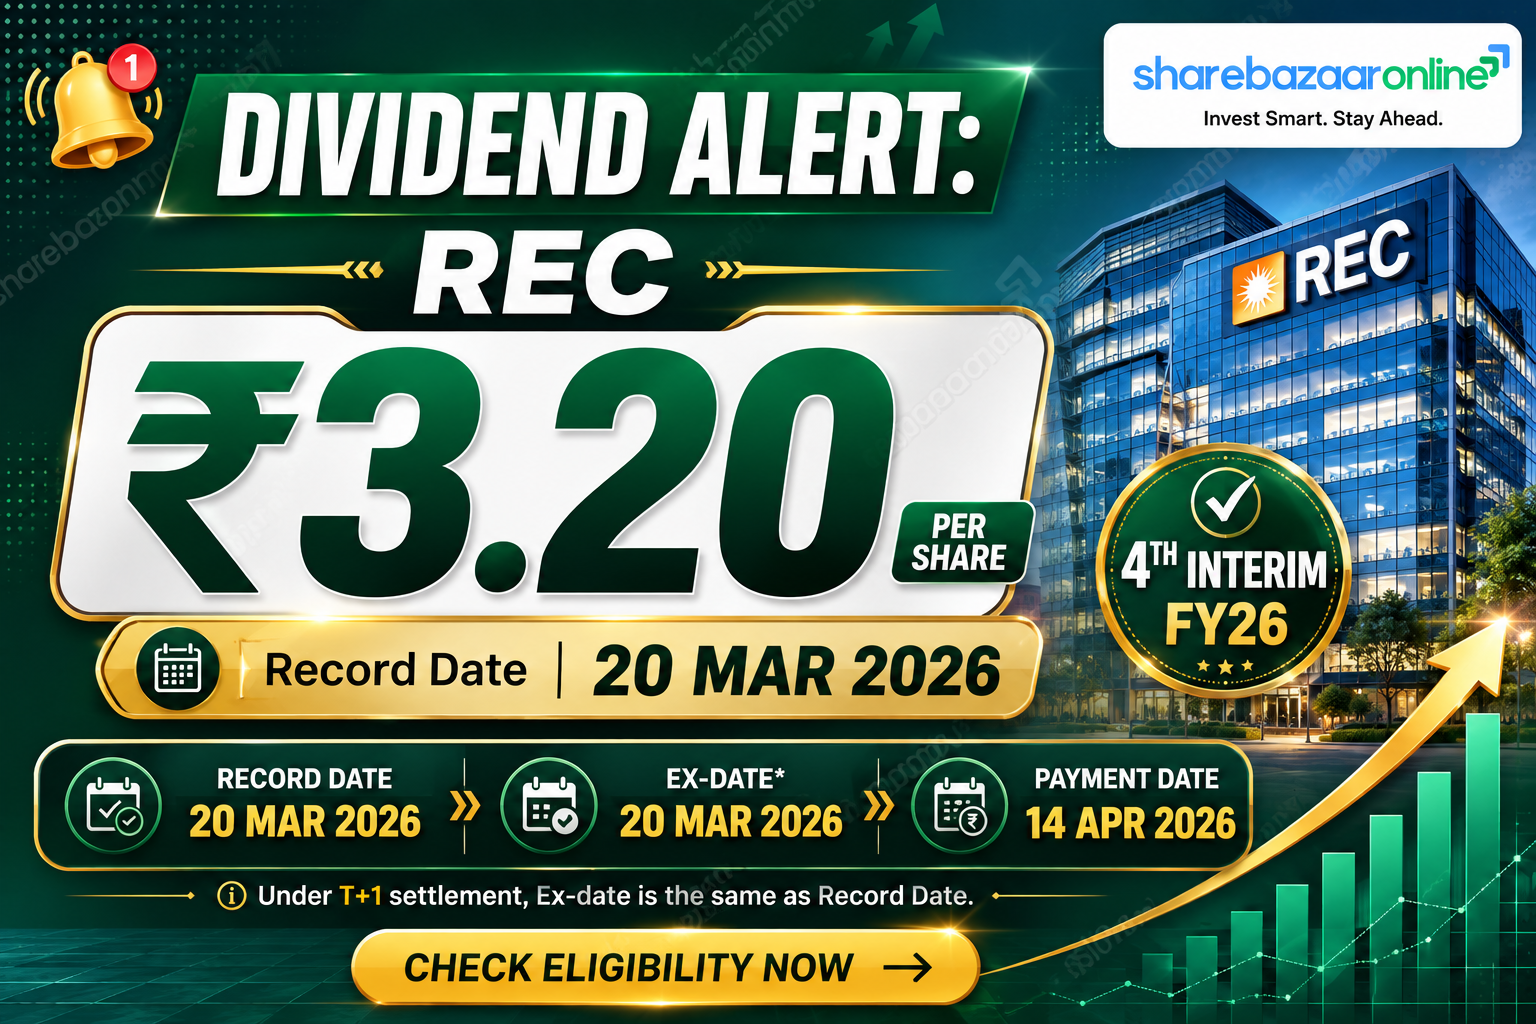
Dividend Snapshot
Company
REC Limited (Maharatna CPSE)
NSE: RECLTD · BSE: 532955 · ISIN: INE020B01018
Sector: Power-sector financing NBFC (Financials)
This Dividend
₹3.20 / share — 4th Interim, FY2025-26
32% on face value of ₹10
Board meeting: 16 Mar 2026 (2:00–2:40 PM)
Record Date
20 Mar 2026
Ex-Date
20 Mar 2026
Same as record date under T+1
Payment By
14 Apr 2026
4th-Interim Yield*
~0.86%
This tranche alone
The one number that matters: Taken in isolation, ₹3.20 is only a ~0.86% yield at the latest price of ~₹374. The widely-quoted "~5% yield" on REC comes from adding up all ₹18.55 of FY26 dividends, not this single tranche. *Yield re-verify required at publish.
Dividend Announcement Summary
On 16 March 2026, the Board of Directors of REC Limited declared a fourth interim dividend of ₹3.20 per equity share (32% of the ₹10 face value) for the financial year 2025-26, under Regulation 30 of SEBI LODR. The board fixed Friday, 20 March 2026 as the record date and stated the dividend would be paid on or before 14 April 2026, exclusively through electronic mode (physical warrants have been discontinued).
What ShareBazaar flags that wire services miss
This ₹3.20 tranche is smaller than each of the three earlier FY26 interims of ₹4.60. The step-down coincides with a softer fourth quarter: consolidated Q4FY26 net profit fell ~21.7% year-on-year to ₹3,375 crore, partly on a higher effective tax rate (~24% vs ~21%). The board front-loaded FY26 payouts and trimmed the last tranche.
The bigger story behind the dividend
REC is set to be merged into Power Finance Corporation (PFC). Both boards approved the scheme on 28 June 2026; REC will be dissolved and shareholders will receive PFC shares at a swap ratio that is not yet fixed. Target effective date: 1 April 2027, subject to shareholder, creditor and regulatory approvals. This is more consequential than any single dividend.
Key Dates Timeline
Board Meeting / Announcement
16 March 2026
Interim dividend declared (no AGM needed for interims)
Ex-Date
20 March 2026
Under T+1 settlement, the ex-date and record date fall on the same day — buy on/before 19 Mar 2026 to qualify
Record Date
Friday, 20 March 2026
Company-disclosed in the filing
Payment Date
On or before 14 April 2026
Statutory outer limit stated by company; exact credit date Not Disclosed by Company
Note: The older "ex-date = record date minus one trading day" convention no longer applies. India moved to T+1 settlement, so exchanges now set the ex-date equal to the record date. The eligibility cut-off for buyers is therefore the trading day before, i.e. 19 March 2026.
Dividend Yield Analysis
Yield depends entirely on which dividend figure you use and at what price. Here is the honest breakdown (prices to be re-verified at publish time):
| Basis | Dividend | Price | Yield |
|---|---|---|---|
| 4th interim only (@ announcement) | ₹3.20 | ~₹332 (16-17 Mar 2026)* | ~0.96% |
| 4th interim only (@ latest) | ₹3.20 | ~₹374 (29 Jul 2026)* | ~0.86% |
| FY26 interims total | ₹17.00 | ~₹374* | ~4.54% |
| FY26 total (incl. ₹1.55 final) | ₹18.55 | ~₹374* | ~4.96% |
*Prices sourced externally (NSE/Screener/market data) and must be re-confirmed on the publish date.
Yield reality check — why the ~5% is "real" but the ₹3.20 is not the driver
REC's attractive ~5% yield is driven by a strong, consistent full-year payout (₹18.55), not by a falling price or a one-off special dividend. The share is actually down roughly 6-11% over the past year, which nudges the trailing yield slightly higher, but the core support is genuine earnings and a stable 30% payout policy. Do not annualise the ₹3.20 tranche on its own — that would misrepresent the yield.
Dividend History Analysis
FY2025-26 dividend tranches
| Tranche | Per Share | Declared |
|---|---|---|
| 1st interim | ₹4.60 | Q1 FY26 (Jul 2025) |
| 2nd interim | ₹4.60 | 17 Oct 2025 |
| 3rd interim | ₹4.60 | 29 Jan 2026 |
| 4th interim (this) | ₹3.20 | 16 Mar 2026 |
| Final (proposed, AGM) | ₹1.55 | 28 Apr 2026 |
| FY26 Total | ₹18.55 | — |
Multi-year trend
REC has paid dividends every year for over a decade, typically in multiple tranches. Recent full-year totals were roughly ₹16 (FY24) and ₹18 (FY25), rising to ₹18.55 (FY26). The payout ratio has held steady near 30% of profit for several years — a disciplined, policy-driven approach rather than erratic special payouts.
Classification
Consistent Payer
No dividend cuts or suspensions in recent history; growth broadly tracks earnings. A mild caveat: the individual tranche sizes vary quarter to quarter (₹4.60 → ₹3.20 here), so investors should track the annual total, not any single instalment.
Financial Performance Analysis
Consolidated headline numbers (FY2025-26)
Revenue
₹59,584 Cr
Net Profit
₹16,308 Cr
EPS
₹61.93
ROE
20.0%
Operating leverage — growth is decelerating
Over five years, revenue compounded at ~10.9% and profit at ~14.2% — solid. But the near-term picture is flatter: FY26 revenue rose just ~5.7% and PAT only ~2.7% year-on-year. The slowdown reflects margin compression — REC has been rationalising (cutting) its lending rates to pass benefits to power utilities, with financing margin easing to ~30% in Q4FY26 from ~41% a year earlier.
The base-effect distortion in Q4
Q4FY26 PAT of ₹3,375 Cr fell ~21.7% YoY. This is not a collapse in the business — the prior-year quarter benefited from lower provisioning and a favourable base, while Q4FY26 carried a higher effective tax rate (~24% vs ~21%) and softer margins. Full-year profit still grew. Reading the quarter alone overstates the deterioration.
Cash Flow Analysis
Read this before judging "FCF coverage" — REC is a lending NBFC
For a finance company, loan disbursements are counted as operating cash outflows. So in any year REC grows its loan book, reported operating cash flow (OCF) and "free cash flow" look deeply negative — for example OCF was −₹39,064 Cr in FY25 and −₹57,723 Cr in FY24. That is normal and does not mean the dividend is unfunded. Applying a manufacturing-style "FCF must cover dividend" test to an NBFC is a classic misreading.
FY26 turned positive — but understand why
FY26 OCF was +₹5,972 Cr and FCF +₹5,896 Cr, positive for the first time in years. This mainly reflects slower net loan growth and higher prepayments in FY26, not a step-change in cash generation. On this basis the FY26 total dividend of ~₹4,883 Cr is technically covered ~1.2x by OCF — but that ratio will swing back negative whenever loan growth re-accelerates.
How the dividend is actually funded
REC pays dividends out of accounting profits and its balance sheet, refinancing loan growth through fresh borrowings — standard for a regulated, systemically-important NBFC. The right sustainability lens here is earnings coverage and capital adequacy, not FCF. Receivables (the loan book) grow with revenue by design; that is the business, not a warning sign.
Balance Sheet Strength
Net Worth (FY26)
₹85,054 Cr
Book Value / Share
₹323
Borrowings
₹5.15 lakh Cr
Debt / Equity
~6.05x
A debt-to-equity near 6x looks alarming to an equity investor but is routine for a lending NBFC — borrowing is REC's raw material. Net worth has grown ~15% YoY to ₹91,836 Cr as on 30 Jun 2026. ROE of ~20% is healthy; ROCE of ~9.71% looks low only because interest expense sits "above the line" for a financier. The key watch item for any NBFC is asset quality (NPAs), which management describes as improving, aided by a stronger power sector.
Dividend Sustainability Analysis
Test 1 — Earnings coverage
EPS ₹61.93 vs full-year DPS ₹18.55 = ~3.34x cover (payout ~30%). Comfortable.
Test 2 — Operating cash flow
FY26 OCF +₹5,972 Cr covers the ~₹4,883 Cr payout ~1.2x, but is structurally volatile for an NBFC. Not the right primary lens.
Test 3 — Free cash flow
FCF is positive in FY26 but negative in loan-growth years by design. Reframe: fund via balance sheet.
Test 4 — Capital / balance sheet
Net worth ₹85,000+ Cr and steady internal accruals; the ~₹4,883 Cr outflow is a small fraction of equity. Well supported.
Verdict: Sustainable — funded comfortably from profits under a stable ~30% payout policy. Watch flags: (1) decelerating profit growth (FY26 PAT +2.7%) and margin compression could cap future DPS growth; (2) the PFC merger means the FY26 final dividend and all future payouts will ultimately be decided by / paid through the merged entity.
Peer Comparison
| Metric | REC Ltd | PFC (parent / acquirer) |
|---|---|---|
| Dividend Yield (trailing) | ~5.0% | ~3.9-4.0% |
| Payout Ratio | ~30% | ~22% |
| ROE | ~20% | ~21% |
| P/E | ~5.8x | ~7.4x |
| P/B | ~1.1x | ~1.35x |
| Cash / Investments | Not independently verified (peer cell) | Not independently verified (peer cell) |
Peer figures are approximate market data; blank/flagged cells indicate data not verified from primary sources.
REC offers a higher yield and payout at a lower valuation than PFC, with similar ROE. But because the two are merging, the "comparison" is temporary — from FY28 they become one entity, and any valuation gap will be resolved by the still-unannounced share swap ratio, which is the real arbitrage variable to watch.
Promoter Impact Analysis
Who receives the dividend
Promoter PFC holds 52.63% of REC. On this 4th interim (~₹842 Cr total outflow), PFC's share is ~₹443 Cr. Across all of FY26 (~₹4,883 Cr total outflow), PFC collects an estimated ~₹2,570 Cr, while non-promoter (minority) shareholders receive ~₹2,313 Cr.
Institutional trend — a quiet FII exit
FII holding fell from ~21.9% (Jun 2023) to 15.79% (Mar 2026), while DIIs rose to 16.36% and retail/public to ~15.17%. Domestic institutions have been absorbing foreign selling — worth noting for anyone assuming "institutions are buying."
Distribution impact: Because the promoter is itself a listed PSU (PFC) that is absorbing REC, dividends flowing up to PFC effectively stay within the same about-to-merge group. Minority holders benefit from the same per-share payout, but their ultimate return will hinge on the merger swap ratio, not this dividend.
Taxation Analysis
Since FY2020-21, dividends are taxable in the hands of the shareholder at their income-tax slab rate (there is no Dividend Distribution Tax). Under Section 194, the company deducts TDS at 10% if a resident shareholder's total dividend from that company in a financial year exceeds ₹5,000 (₹10,000 from FY2025-26 under recent changes; REC applies the prevailing threshold). Investors eligible for nil/lower TDS can file Form 15G/15H or relevant declarations with the RTA before the record date.
Worked example — this ₹3.20 tranche
Investor holds 1,000 shares, 30% slab:
- Gross dividend: 1,000 × ₹3.20 = ₹3,200
- TDS u/s 194: NIL (below the per-company threshold)
- Tax at 30% slab: ₹960
- Net in hand: ₹2,240
Worked example — full FY26 (₹18.55)
Same 1,000 shares, 30% slab, whole year:
- Gross dividend: 1,000 × ₹18.55 = ₹18,550
- TDS at 10% (crosses threshold): ₹1,855 (adjustable against final tax)
- Total tax at 30% slab: ₹5,565
- Net after tax: ₹12,985
Effective post-tax yield for a 30%-slab investor at ~₹374 works out to roughly ~3.5% on the full-year ₹18.55 (versus ~5.0% pre-tax). Lower-slab and senior-citizen investors keep more. NRIs face higher TDS (typically 20% plus surcharge/cess, subject to DTAA relief).
Key Risks
1. Merger / swap-ratio uncertainty. REC merges into PFC (target 1 Apr 2027). The share swap ratio is not yet fixed, and dividend policy of the merged entity is undecided — the single biggest overhang for REC holders.
2. Margin compression. REC is cutting lending rates to help utilities; financing margin fell toward ~30% in Q4FY26. Sustained NIM pressure would slow profit and cap dividend growth.
3. Earnings deceleration. FY26 PAT grew only ~2.7% and Q4 fell ~21.7% YoY. A slower profit trajectory limits how fast payouts can rise.
4. Concentration & asset quality. A large, power-sector-concentrated loan book (₹5.9 lakh crore standalone) means any stress in discoms or big projects can hit NPAs and provisioning.
5. Rate & funding risk. As a wholesale-funded NBFC with ~6x leverage, higher borrowing costs or tighter liquidity squeeze spreads directly.
6. Policy / government-ownership risk. As a PSU, capital-allocation and dividend decisions can be influenced by government fiscal needs rather than pure shareholder-return logic.
What To Monitor
1. PFC-REC swap ratio & merger milestones — shareholder/creditor/NCLT approvals and the effective date. This determines what REC holders actually end up owning.
2. Net interest margin (NIM) — currently ~3.34%; further compression would pressure profits and future dividends.
3. Loan-book growth & disbursements — the engine of future earnings; renewable/infra mix is rising (renewables ~13% of book).
4. Gross & net NPA trends — the core sustainability signal for any lender; management guides to improving asset quality.
5. FY26 final dividend approval — the ₹1.55 final needs AGM sign-off (25 Aug 2026, record date 14 Aug 2026).
6. Payout-policy continuity — whether the ~30% payout ratio is maintained through and after the merger.
Conclusion
REC's 4th interim dividend of ₹3.20 completes a full-year payout of ₹18.55 for FY26 — a ~5% trailing yield backed by ~30% payout and ~3.3x earnings cover. On the numbers, the dividend is sustainable, funded from steady profits rather than one-off gains, and REC remains a consistent payer.
Positives: high yield, low valuation (P/E ~5.8x, P/B ~1.1x), 20% ROE, disciplined payout. Negatives / watch-items: decelerating profit growth, margin compression, ~6x leverage, and above all the PFC merger with an unfixed swap ratio, which will reshape what REC shareholders ultimately hold. Income-focused readers should weigh the attractive yield against these forward uncertainties and decide for themselves.
Frequently Asked Questions
What dividend has REC Limited announced?
What is the dividend yield?
What is the record date?
What is the ex-date?
When will the dividend be paid?
Who is eligible for the dividend?
How is the dividend taxed?
Is the dividend sustainable?
What is REC's dividend history?
What should investors monitor?
Why is REC merging with PFC and what happens to my shares?
Why was this 4th interim (₹3.20) smaller than the earlier ₹4.60 tranches?
Disclaimer
This article is published by ShareBazaar Online for informational and educational purposes only and does not constitute investment advice or any buy/sell/hold recommendation. ShareBazaar Online is not a SEBI-registered investment adviser. Dividend, price, and financial figures are drawn from company filings (BSE/NSE, Regulation 30) and third-party sources such as exchange data and Screener.in; some figures are inferred or not independently verified and are labelled accordingly. Market prices, yields, and the status of the PFC-REC merger change continually and must be re-verified before acting. Dividends are subject to applicable taxes and, for the proposed final dividend, to shareholder approval. Please consult a SEBI-registered adviser and your tax professional before making any decision. Investments in securities are subject to market risks.