
Dividend Snapshot
Dividend / Share
₹10.00
Dividend %
200%
Face Value
₹5
Dividend Type
Final
Yield (at CMP)
1.14%
Payout Ratio
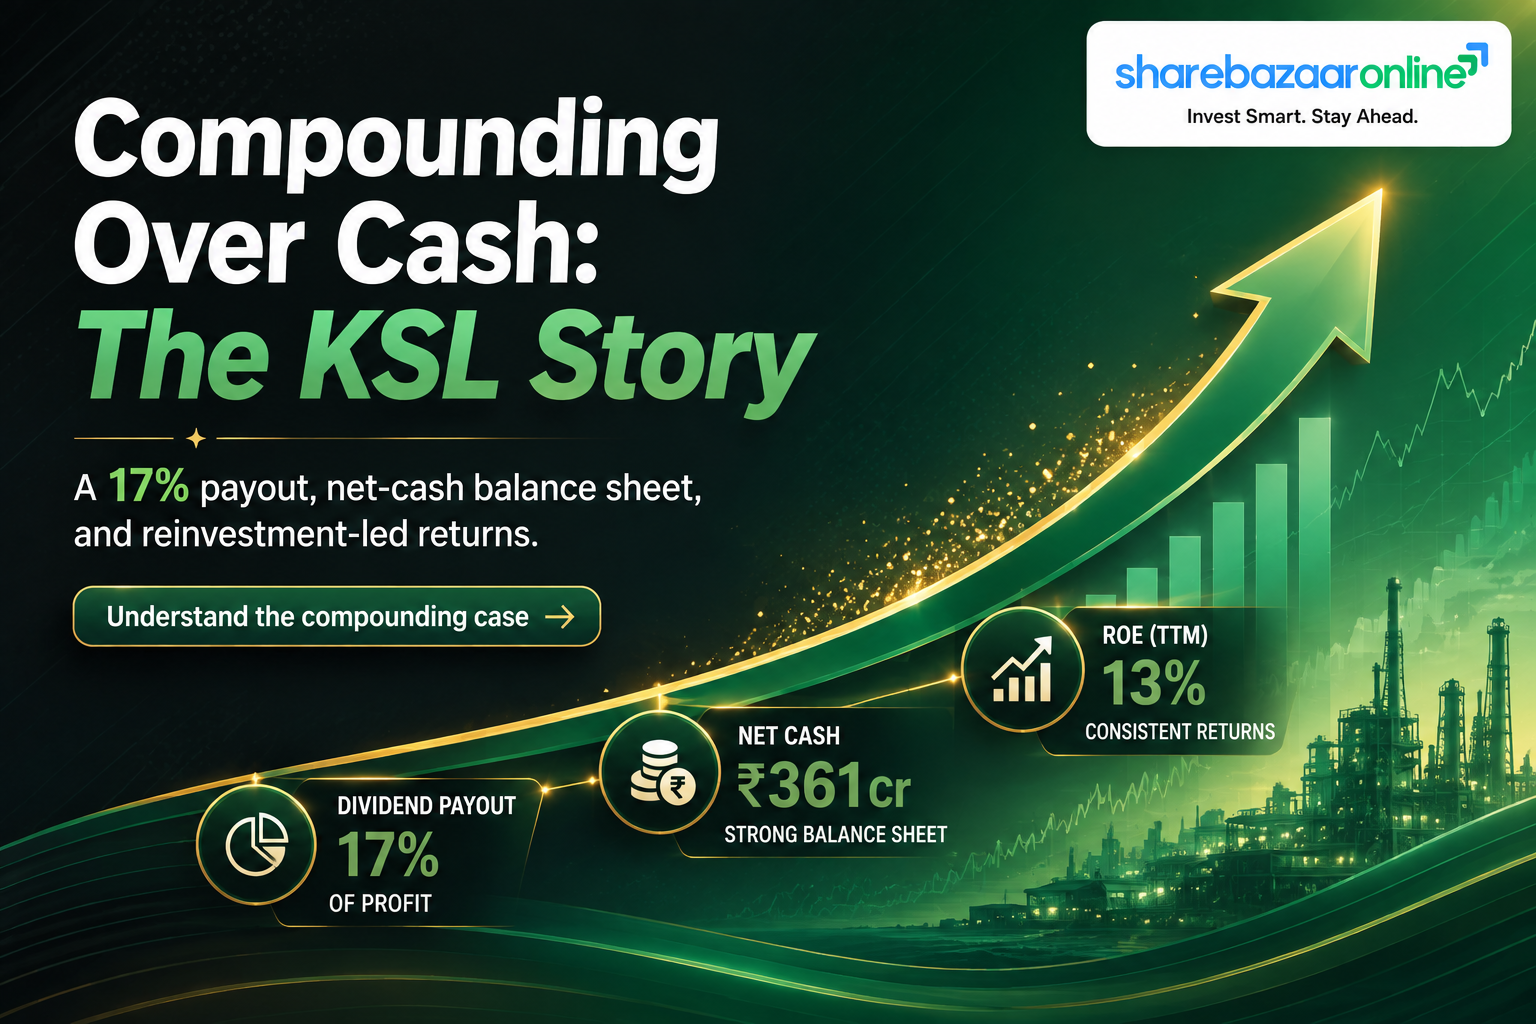
~17%
Total Outflow
₹43.73 Cr
Payer Profile
Consistent
CMP used: ₹881 (as on 30 Jul 2026). Yield must be re-verified at publish time — it moves with the live price. All financial figures below are on a consolidated basis unless stated otherwise, and are drawn from the audited results for the year ended 31 March 2026.
Dividend Announcement Summary
At its Board meeting on 8 May 2026, the Directors of Kalyani Steels recommended a final dividend of ₹10 per share for FY 2025-26 alongside audited standalone and consolidated results carrying an unmodified (clean) audit opinion from Kirtane & Pandit LLP. The same meeting saw two leadership changes: Mr. Shishir Joshipura (ex-CEO of Praj Industries) was appointed an Additional Independent Director, and Mr. Bantu Upendra Kumar Patro was appointed Chief Financial Officer effective 9 May 2026.
Why "recommended", not "declared": A final dividend is only a Board recommendation until members approve it at the AGM. Until 27 August 2026, the ₹10 payout is technically conditional — a distinction wire services usually skip.
Key Dates Timeline
Announcement Date
8 May 2026
Board meeting — confirmed by company filing
Record Date
31 July 2026 (Today)
Per company / AGM notice
Ex-Date
31 July 2026 (Inferred, T+1)
Under T+1 settlement, ex-date typically coincides with record date. Confirm against the exchange corporate-action circular.
Payment Date
Not Disclosed by Company
Statutory outer limit: within 30 days of AGM approval (AGM: 27 Aug 2026)
Dividend Yield Analysis
At a market price of ₹881, the ₹10 dividend gives a yield of 1.14%. That is a modest yield — and deliberately so. Kalyani Steels is not a high-yield stock; it is a low-payout compounder that returns roughly one-sixth of profit and reinvests the rest. The yield has stayed in a 1.1%–1.3% band across recent years, which tells you the payout has broadly tracked the share price rather than being juiced up.
Reality check: This yield is driven by a stable, modest dividend, not by a collapsing share price or a one-off special dividend. The stock is down only mildly over the past year, so the low yield reflects a full valuation on a low payout ratio, not distress. Investors chasing income should note the yield sits below a typical savings account; the case here is total return, not cash income.
Dividend History Analysis
| Financial Year | EPS (₹) | DPS (₹) | Payout % |
|---|---|---|---|
| FY 2025-26 | 58.45 | 10.00 | 17% |
| FY 2024-25 | 57.96 | 10.00 | 17% |
| FY 2023-24 | 56.69 | 10.00 | 18% |
| FY 2022-23 | 38.26 | 10.00 | 26% |
| FY 2021-22 | 55.65 | 10.00 | 18% |
| FY 2020-21 | 43.59 | 7.50 | 17% |
Source: company filings / Screener.in. Standalone EPS shown. Historical DPS/payout not independently re-audited — verify against annual reports before publishing.
Classification: Consistent Payer. KSL has paid a dividend every year for close to a decade, held the absolute payout at ₹10 since FY22, and kept the payout ratio anchored near 17%. The one outlier — 26% in FY23 — was a payout-ratio spike caused by a temporary dip in EPS to ₹38.26, not a bigger cheque. There have been no dividend cuts and no suspensions in the recent record, though there was no dividend in the earlier FY15–FY16 period.
Financial Performance Analysis
Revenue (Consol)
₹1,845.61 Cr
▼ 6.88% YoY (from ₹1,981.90 Cr)
Net Profit (Consol)
₹257.87 Cr
▲ 0.63% YoY (from ₹256.25 Cr)
EBITDA Margin
~19.6%
Broadly stable operating margin
EPS (Consol)
₹59.07
Standalone: ₹58.45
The non-obvious part: revenue fell nearly 7%, yet profit was flat to marginally higher. That is not an operating win — it is a cost-line rescue. Two items did the heavy lifting: finance costs collapsed to ₹8.6 Cr (from ₹18.6 Cr) as working-capital borrowing costs fell, and depreciation eased to ₹57 Cr (from ₹63.4 Cr). A ₹7.93 Cr exceptional charge (a one-time employee-benefit provision tied to the new Labour Codes) also hit the year. In short: the top line shrank, and the profit was held together below the operating line — a distinction that flatters the headline "profit grew".
Cash Flow Analysis
⚠ Headline Finding — Cash Conversion Deteriorated Sharply
Reported profit was flat, but the cash behind that profit shrank hard. Operating cash flow fell 63% — from ₹381.8 Cr to ₹140.8 Cr. Cash conversion (OCF as a share of PAT) dropped from a healthy 149% to just ~55%. Free cash flow followed: from ₹356.7 Cr down to ₹79.3 Cr. This is the single most important fact in this dividend event, and it is absent from wire-service coverage.
Operating Cash Flow FY26
₹140.76 Cr
▼ 63% (FY25: ₹381.83 Cr)
Free Cash Flow FY26
₹79.32 Cr
▼ 78% (FY25: ₹356.72 Cr)
Why did cash fall? The drop is working-capital driven, not a profit problem. Trade receivables rose ₹65 Cr (debtor days climbed from ~79 to ~98) while trade payables shrank ₹36 Cr — the company collected slower and paid suppliers faster, both of which drain cash. On top of this, capex more than doubled to ₹61.4 Cr (from ₹25.1 Cr), reflecting an expansion push visible in a large ₹560 Cr capital-work-in-progress balance.
How is this dividend funded? The ₹43.73 Cr outflow is still comfortably covered by this year's FCF (1.8x) and OCF (3.2x). But the coverage cushion has thinned dramatically — last year FCF covered the dividend roughly 8x over. This year the dividend leans far more on the balance-sheet cash pile than on freshly earned cash. Affordable: yes. Earned as comfortably as before: no.
Balance Sheet Strength
Cash + Bank + Investments
₹835.98 Cr
Total Borrowings
₹475.03 Cr
All current / working-capital; nil long-term debt
Net Position
Net Cash ₹360.95 Cr
Book Value / Share
₹481
Debt/Equity ~0.23
This is a fortress balance sheet. The company carries zero long-term debt; all ₹475 Cr of borrowings are short-term working-capital lines (including bill discounting). Against that sits ₹836 Cr of cash and investments, leaving KSL in a net-cash position of ~₹361 Cr. The dividend outflow is a rounding error against this — cash covers the payout ~19 times over. Balance-sheet risk to the dividend is negligible; the real question is the quality of cash generation, covered above.
Dividend Sustainability Analysis
Test 1 — Earnings Coverage
PASS • 5.9x
EPS ₹58.45 vs DPS ₹10
Test 2 — OCF Coverage
PASS • 3.2x
Cushion down sharply YoY
Test 3 — FCF Coverage
PASS (thin) • 1.8x
Was ~8x last year
Test 4 — Cash / Balance Sheet
PASS • 19x
Net cash ₹361 Cr
Verdict: Sustainable — with a cash-conversion watch flag
On every static test the dividend passes, some comfortably. The ₹10 payout is trivially affordable from a net-cash balance sheet and is well covered by earnings. The watch flag is directional, not structural: the FCF cushion thinned from ~8x to 1.8x in a single year because cash conversion fell. If receivables keep climbing and capex stays elevated, a low-payout policy like this can still be maintained from reserves — but the market prizes cash-backed dividends, and this year's was less cash-backed than usual.
Peer Comparison
| Metric | Kalyani Steels | Sector / Peer Context |
|---|---|---|
| Dividend Yield | 1.14% | Verify vs peers at publish |
| Payout Ratio | ~17% | — |
| ROE | 13.0% | — |
| ROCE | 14.7% | — |
| Net Debt / Position | Net Cash | — |
| Stock P/E | ~15x | Industry P/E ~23x |
Peer-cell values intentionally left blank where they cannot be verified from primary sources. Populate with a named, like-for-like special/alloy-steel peer set (e.g. Sunflag Iron & Steel, Mukand, Kirloskar Ferrous) before publishing — do not fill from memory.
Against the broader steel space, KSL screens as a low-yield, low-payout, high-quality specialty-steel play rather than an income stock. Its net-cash balance sheet and mid-teens ROE/ROCE are its differentiators; its sub-1.2% yield is not competitive for income seekers. It trades at a discount to the industry P/E, consistent with the recent revenue softness.
Promoter Impact Analysis
Promoter Holding
64.70%
Promoter dividend: ~₹28.29 Cr
Non-Promoter Split
Public 22.33% → ₹9.76 Cr
DIIs 11.14% → ₹4.87 Cr
FIIs 1.82% → ₹0.80 Cr
The Kalyani promoter group (linked to the wider Bharat Forge / Kalyani Group) holds 64.70% — a stake that has been rock-steady for years — and will therefore receive roughly ₹28.3 Cr of the ₹43.7 Cr distribution. This is normal for a promoter-controlled company, but it frames the low-payout policy honestly: because promoters take the majority of every rupee paid out, retaining ~83% of profit inside the company aligns promoter and minority interests toward reinvestment and compounding rather than income. Minority holders should be comfortable with capital-appreciation-led returns, not dividends.
Taxation Analysis
Since April 2020, dividends are taxed in the hands of the investor at their income-tax slab rate (there is no longer a Dividend Distribution Tax borne by the company). Under Section 194, the company deducts TDS at 10% if your total dividend from that company in a year exceeds ₹5,000 (a PAN must be on record, else 20%). Investors with income below the taxable limit can file Form 15G / 15H to avoid TDS.
Worked Example — 1,000 shares, 30% tax slab
| Gross dividend (1,000 × ₹10) | ₹10,000 |
| Less: TDS u/s 194 @10% (as > ₹5,000) | ₹1,000 |
| Credited to bank | ₹9,000 |
| Total tax at 30% slab (TDS is adjusted against this) | ₹3,000 |
| Net dividend after full tax | ₹7,000 |
| Pre-tax yield / Post-tax yield (@CMP) | 1.14% / ~0.79% |
Illustrative. Actual tax depends on your total income, surcharge/cess, and slab. Not tax advice — consult a professional.
Key Risks
1. Environmental / regulatory shutdown risk (live). The CPCB ordered closure of KSL's Ginigera (Koppal) plant — its primary integrated facility — on 3 July 2026; power was cut on 14 July and operations halted. A conditional revocation came on 16 July and production resumed on 17 July 2026. The reprieve is conditional on ongoing compliance with Air/Water Act norms, so this risk is not fully closed.
2. Deteriorating cash conversion. OCF fell 63% and FCF fell ~78% in FY26 on rising receivables and higher capex. Persistent weak conversion would erode the dividend's cash backing even if the headline profit holds.
3. Revenue contraction & steel-cycle exposure. Revenue fell ~6.9% and 5-year sales growth is a weak ~9%. As a specialty/forging-grade steel maker tied to autos and capital goods, KSL is exposed to demand cyclicality and raw-material (iron ore, coke) price swings.
4. Governance / related-party history. The FY26 BRSR disclosed a SEBI settlement order relating to prior related-party-transaction non-compliance; the AGM also seeks large RPT approvals. Worth monitoring for a company where promoters hold nearly two-thirds.
5. Capex execution risk. A large ₹560 Cr capital-work-in-progress balance means significant capital is tied up in projects yet to generate returns; delays or cost overruns would pressure future FCF and returns.
What To Monitor
1. CPCB compliance status — any fresh directions, or confirmation that Ginigera-plant compliance conditions are permanently met.
2. Debtor days & operating cash flow — whether receivables normalise back toward ~79 days and OCF/PAT recovers above 100%.
3. Capex-to-commissioning — conversion of the ₹560 Cr CWIP into revenue-generating assets and the resulting volume/margin uplift.
4. Volume & realisation trend — whether the ~7% revenue decline reverses, and the auto/capital-goods demand pull for forging-grade steel.
5. New CFO / board actions on governance — how the incoming CFO (from 9 May 2026) and new independent directors handle RPT disclosure and capital allocation.
Conclusion
Kalyani Steels' ₹10 final dividend (200%) is the seventh straight year of a stable, low-payout distribution — a consistent-payer profile backed by a net-cash balance sheet and 5.9x earnings coverage. On affordability, there is no debate: cash covers the payout ~19 times over. The positives are the fortress balance sheet, clean audit, and disciplined 17% payout. The negatives are a ~7% revenue decline, a profit propped up below the operating line, and — most importantly — a 63% collapse in operating cash flow that thinned FCF dividend coverage from ~8x to 1.8x. Layered on top is a live environmental-compliance risk at the company's main plant, only conditionally resolved. The dividend itself is safe; the quality of the cash behind it, and the regulatory overhang, are what deserve watching. This is analysis, not advice — the positives, negatives, risks and monitorables are laid out so you can decide for yourself.
Frequently Asked Questions
What dividend has Kalyani Steels announced for FY 2025-26?
What is the dividend yield of Kalyani Steels?
What is the record date for the Kalyani Steels dividend?
What is the ex-dividend date?
When will the dividend be paid?
Who is eligible to receive the dividend?
How is this dividend taxed?
Is the Kalyani Steels dividend sustainable?
What is Kalyani Steels' dividend history?
Why did profit rise when revenue fell?
What was the CPCB plant-closure issue?
How much of the dividend goes to promoters?
What should investors monitor going forward?
Does Kalyani Steels have debt?
Disclaimer
This article is for informational and educational purposes only and does not constitute investment, financial, legal or tax advice, nor a recommendation to buy, sell or hold any security. ShareBazaar Online is not a SEBI-registered investment adviser. Figures are drawn from the company's audited filing dated 8 May 2026 and publicly available sources; market data and yields are time-sensitive and must be re-verified against live exchange data before acting. Some dates (ex-date, payment date) are inferred or undisclosed and are flagged as such. Dividends are subject to shareholder approval at the AGM. Investors should conduct their own due diligence and consult a qualified financial adviser. ShareBazaar Online accepts no liability for decisions taken on the basis of this content.