
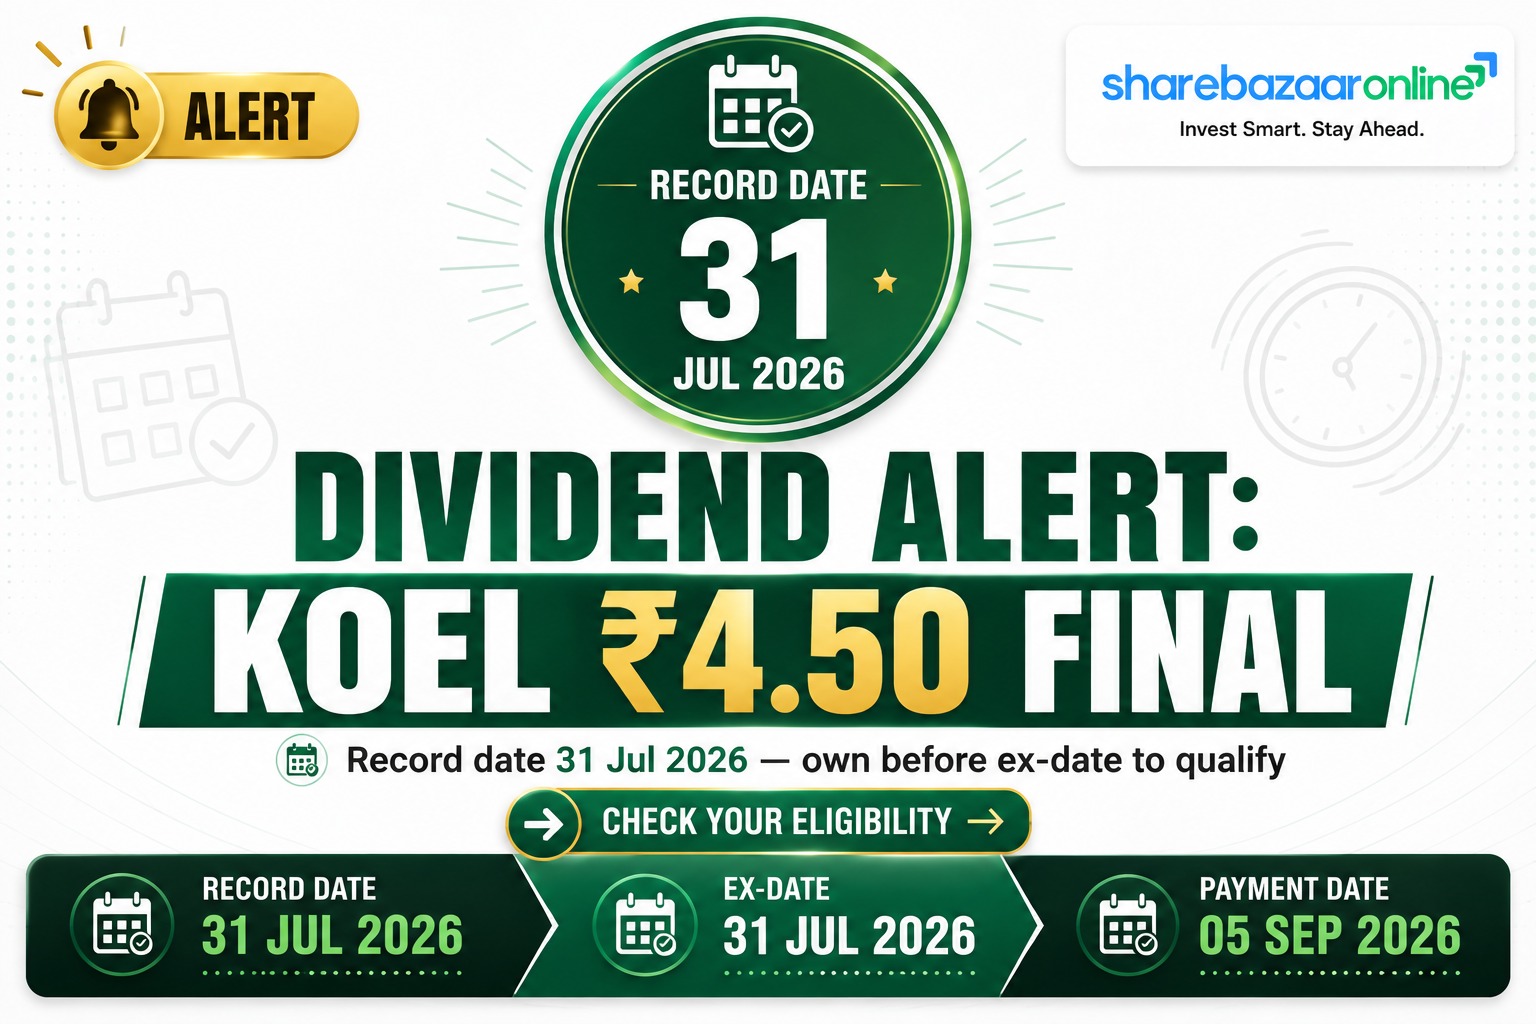
Dividend Snapshot
*Yield computed on latest market price of ~₹2,179 (NSE, 23-Jul-2026). Verify against live NSE/BSE bhavcopy before publication.
Dividend Announcement Summary
At its board meeting on 14 May 2026, the Board of Directors of Kirloskar Oil Engines Ltd recommended a final dividend of ₹4.50 per equity share (225% of the ₹2 face value) for the financial year 2025-26. The recommendation is made under Regulations 30 and 33 of SEBI (LODR), 2015, and is subject to approval by members at the ensuing Annual General Meeting.
KOEL had already paid an interim dividend of ₹2.50 per share earlier in FY26. Together with this final dividend, the company’s total FY26 payout works out to ₹7.00 per share, versus ₹6.50 in FY25 (interim ₹2.50 + final ₹4.00) — a 7.7% increase in the annual per-share distribution.
The company’s standalone and consolidated audited results for FY26 were approved in the same meeting, and the statutory auditors, G. D. Apte & Co., issued an unmodified (clean) audit opinion. Dividend will be paid electronically via NECS.
Key Dates Timeline
Record date, ex-date and AGM/book-closure dates are sourced from the company’s corporate-action and AGM intimation, not from the 14-May dividend recommendation letter itself. Under India’s T+1 settlement cycle, the ex-date and record date fall on the same trading day. Payment date is the statutory outer limit stated by the company (“on or before 05-09-2026”), not a confirmed credit date.
Dividend Yield Analysis
At the latest market price of about ₹2,179, the final dividend of ₹4.50 gives a yield of roughly 0.21%, and the full-year FY26 payout of ₹7.00 gives about 0.32%. On the announcement-day price of around ₹2,250, the full-year yield was close to 0.31%.
Yield reality check
This is a very low yield — but the reason is the share price, not the dividend. KOEL’s stock has risen roughly 140% over the past year and more than 440% over three years. The per-share dividend actually rose 7.7% year-on-year. When a fast-rising share price outruns dividend growth, the yield compresses even as the cash payout grows. Investors should read this as a capital-appreciation stock that also pays a modest, growing dividend, not as an income stock.
Dividend History Analysis
| Financial Year | Interim (₹) | Final (₹) | Total (₹) |
|---|---|---|---|
| FY2025-26 | 2.50 | 4.50 | 7.00 |
| FY2024-25 | 2.50 | 4.00 | 6.50 |
| FY2023-24 | 2.50 | 2.50 | 5.00 |
| FY2022-23 | 1.50 | 2.50 | 4.00 |
KOEL has paid a dividend every year for at least the last decade and has moved to a twice-a-year (interim + final) rhythm. The per-share payout has climbed steadily from about ₹4.00 to ₹7.00 over four years. Third-party data providers note the dividend has been cut at least once in the last 10 years, so the record is best described as consistent but mildly cyclical rather than perfectly smooth.
FY26 and FY25 amounts are confirmed from exchange filings. FY24 and FY23 splits are compiled from public dividend databases and are marked Not Independently Verified — confirm against BSE/NSE corporate-action records before publication. Face value has been ₹2 throughout, so no bonus/split restatement is required.
Financial Performance Analysis
Standalone FY26 vs FY25
Consolidated FY26 vs FY25
Why standalone profit grew only 6.7% while revenue jumped ~25%
The apparent lag is not an operating problem. Standalone operating EBITDA actually grew ~24% in line with revenue, and margins held at ~13.1%. The muted bottom-line growth is entirely below EBITDA: a one-time exceptional charge of ₹29.68 Cr for the incremental impact of the new Labour Codes, plus a smaller contribution from discontinued operations (₹19.52 Cr vs ₹42.11 Cr a year earlier). Stripping these out, continuing-operations profit rose ~13.3% and consolidated profit to owners rose ~25.6%. Wire-service coverage that simply reports “profit up 7%” misses this.
*EBITDA and margins are computed from disclosed line items and are approximate. Segment mix (FY26): B2B ~74% (Powergen + Industrial engines), plus B2C and a Financial Services arm (NBFC subsidiary Arka Fincap).
Cash Flow Analysis
Standalone FY26
Consolidated FY26
On a standalone basis — which is what actually funds the parent’s dividend — cash generation is healthy. Operating cash flow of ₹511 Cr comfortably converted profit into cash, and after ₹317 Cr of capex the company still produced positive free cash flow of ~₹194 Cr. This is worth flagging because, in earlier years, external analysts repeatedly noted KOEL was paying dividends without positive free cash flow; on this year’s standalone numbers that concern has eased.
Forensic note on the ₹932 Cr consolidated OCF
The headline consolidated OCF of ₹932 Cr looks stronger than the standalone figure, but a large part of it comes from the NBFC subsidiary (Arka Fincap) shrinking its loan book — a ~₹432 Cr release from “loans & receivables of financial services business”. That is a balance-sheet run-off, not recurring core operating cash. Consolidated cash-flow figures for a group with a lending arm should always be read with this in mind; the standalone engine/genset business is the cleaner gauge of dividend-paying capacity.
Balance Sheet Strength
Standalone Liquidity
Standalone Leverage
On a standalone basis the parent is effectively debt-free: against ~₹104 Cr of borrowings it holds ~₹713 Cr of cash and liquid investments, i.e. a net cash position of roughly ₹608 Cr. The ₹65 Cr final dividend (and the ₹102 Cr full-year payout) is small against this cushion. Note that consolidated borrowings are far larger (~₹5,300 Cr) — but this is almost entirely the Arka Fincap lending book, which is the NBFC’s raw material, not distress debt at the engine business.
Dividend Sustainability Analysis
Verdict: Sustainable
The full-year dividend is covered 4.5x by earnings and ~1.9x by standalone free cash flow, the payout ratio is a conservative ~22%, and the parent sits on ~₹608 Cr of net cash. All four sustainability tests — earnings coverage, FCF coverage, cash coverage and balance-sheet strength — are comfortably passed. The only caveat is the historically cyclical nature of the payout, which tracks a business exposed to power-gen and industrial demand cycles.
Peer Comparison
| Company | Div Yield | Payout | ROE |
|---|---|---|---|
| Kirloskar Oil Engines | ~0.3% | ~22% | ~16.8% |
| Cummins India | |||
| Greaves Cotton | |||
| Swaraj Engines |
Among diesel-engine and industrial-machinery peers — Cummins India, Greaves Cotton and Swaraj Engines — KOEL is a low-yield, capital-appreciation name. Peers such as Cummins India and Swaraj Engines have historically distributed a much larger share of profits and carry higher headline yields, whereas KOEL retains most earnings to fund its Vision-2030 growth plan.
Peer yield, payout and ROE cells are intentionally left blank rather than populated with unverified figures. Populate from Screener.in / live exchange data before publication; do not estimate.
Promoter Impact Analysis
Shareholding (Jun 2026)
Dividend Income Split (FY26 total ₹101.75 Cr)
With a 41.13% promoter holding, roughly ₹41.85 Cr of the ₹101.75 Cr full-year cash payout flows to the Kirloskar promoter group. The remaining ~₹60 Cr accrues to non-promoter shareholders — institutions and retail. Because the payout ratio is modest (~22%), most FY26 earnings are being retained for reinvestment rather than distributed, which broadly aligns promoter and minority interests around growth.
Taxation Analysis
Since April 2020, dividends in India are taxed in the hands of the shareholder at their applicable income-tax slab rate. The company deducts TDS at 10% on dividends exceeding ₹5,000 per shareholder in a financial year (20% if PAN is not furnished). There is no separate Dividend Distribution Tax.
Worked Example — 1,000 shares, 30% slab (FY26 total dividend ₹7.00/share)
*On an investment of ~₹21.79 lakh (1,000 shares × ~₹2,179). TDS is adjustable against final tax liability. Illustration only; individual tax outcomes vary.
Key Risks
1. Rich valuation. The stock trades at a consolidated P/E of roughly 55x and P/B near 8.8x. At these multiples, any earnings disappointment can hurt the share price far more than the ~0.3% dividend can cushion.
2. Cyclical demand. Power-gen and industrial engine demand is tied to infrastructure, construction and data-centre capex cycles; a slowdown would pressure both earnings and future dividends.
3. NBFC exposure. The consolidated balance sheet carries a large lending book via Arka Fincap. Credit-cost cycles, funding costs and regulatory change in the NBFC affect group profits.
4. Regulatory / cost shocks. The FY26 accounts already absorbed a ₹29.68 Cr exceptional charge from the new Labour Codes; further wage, emission-norm or compliance costs could recur.
5. Dividend is discretionary and historically variable. KOEL has cut its dividend at least once in the past decade; the payout is not a fixed commitment and can move with the earnings cycle.
What To Monitor
1. Standalone free cash flow trend — whether the parent keeps generating positive FCF after its Vision-2030 capex, since this (not consolidated OCF) funds the dividend.
2. Powergen & industrial order intake — the ~74% B2B mix and 28% domestic power-gen share drive the core cash engine.
3. Arka Fincap loan-book quality — growth, margins and credit costs at the NBFC, which increasingly shapes consolidated profit.
4. Margin trajectory — whether the Sanand plant transition and mix improvement lift EBITDA margins above the current ~13%.
5. Payout-ratio policy — whether management raises the ~22% payout as FCF matures, or keeps retaining earnings for the $2bn Vision-2030 target.
Conclusion
Kirloskar Oil Engines’ ₹4.50 final dividend lifts FY26’s total payout to ₹7.00 per share (+7.7% YoY) — a modest but growing cash return backed by ~25% revenue growth, ~13% stable margins, positive standalone free cash flow and a ~₹608 Cr net-cash balance sheet. The payout is clearly sustainable (4.5x earnings cover, ~22% payout).
The headline yield of ~0.3% is low purely because the share price has roughly doubled in a year, not because the dividend is weak. The two nuances a careful reader should carry away: the standalone profit “lag” is a one-off labour-code charge, not an operating slip; and the impressive consolidated cash flow is partly a one-time NBFC loan-book run-off, so the standalone business is the truer dividend gauge.
Frequently Asked Questions
What dividend has Kirloskar Oil Engines announced?
What is the total dividend for FY2025-26?
What is the dividend yield?
What is the record date?
What is the ex-dividend date?
When will the dividend be paid?
Who is eligible to receive the dividend?
When is the AGM?
How is this dividend taxed?
Is the dividend sustainable?
What is KOEL’s dividend history?
Why did standalone profit grow only ~7% when revenue rose ~25%?
How much of the dividend goes to promoters?
Did the auditors flag anything?
What should investors watch going forward?
Disclaimer
This article is for informational and educational purposes only and does not constitute investment, financial or tax advice, nor a recommendation to buy, sell or hold any security. Figures are drawn from the company’s exchange filings and publicly available sources; some data points (current market price, peer metrics and older dividend splits) require independent verification against live NSE/BSE data before acting. Market prices and yields change continuously. Dividends are subject to shareholder approval and can be revised, deferred or cancelled. Please consult a SEBI-registered investment adviser and a qualified tax professional before making any decision. ShareBazaar Online and its authors accept no liability for actions taken based on this content.