
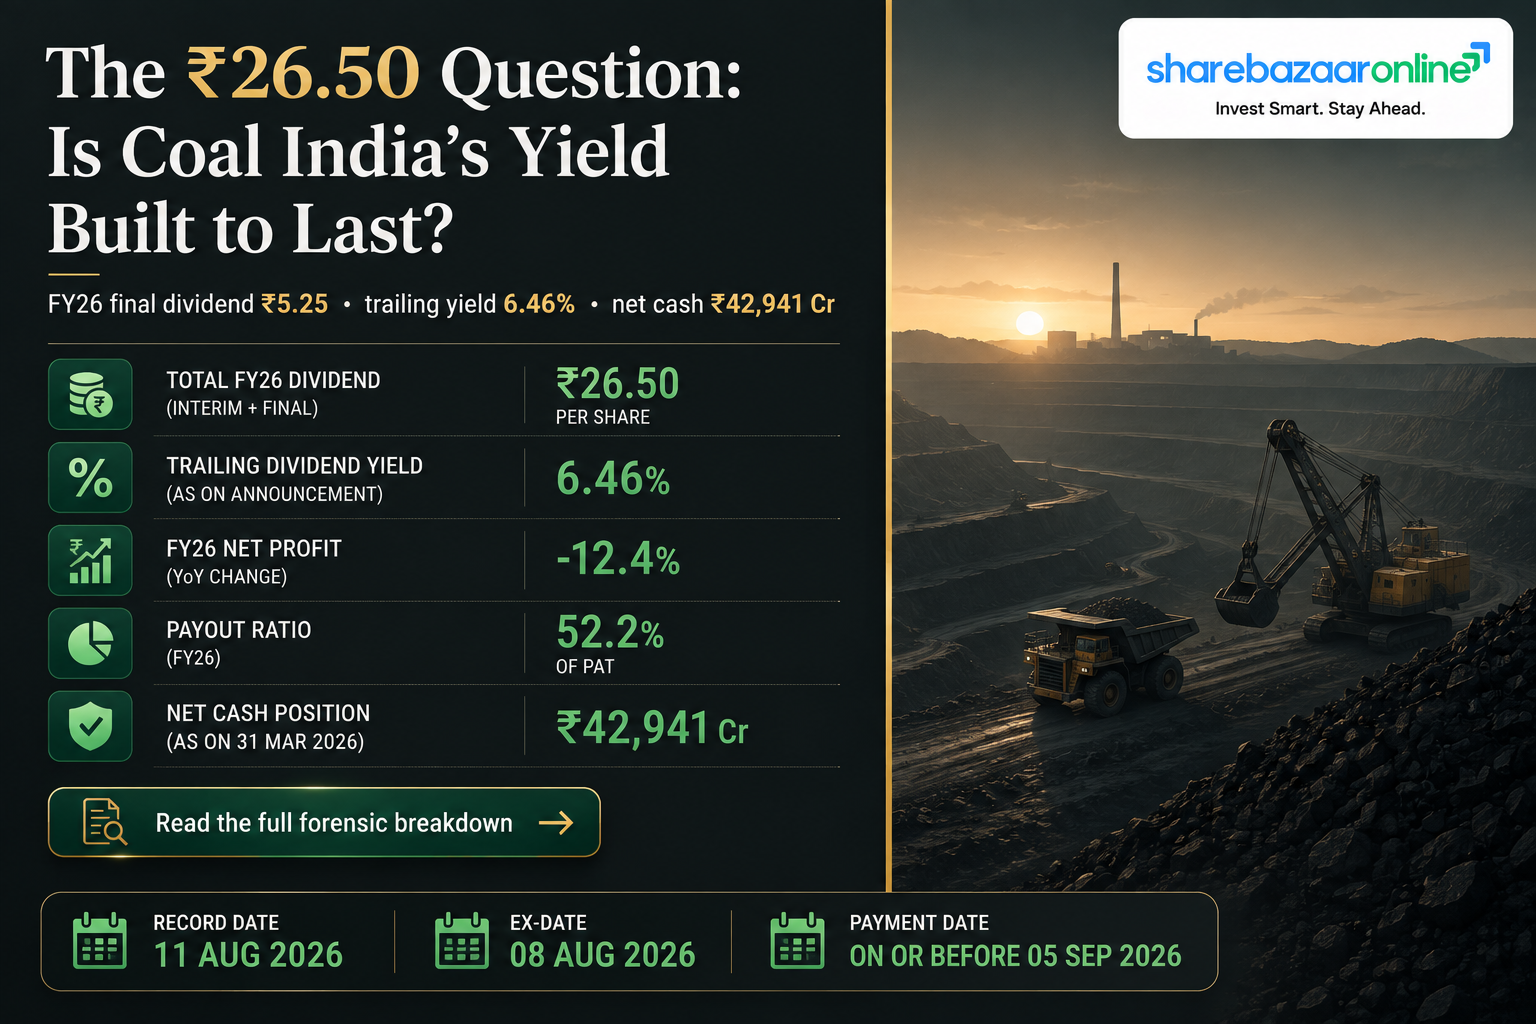
Dividend Snapshot
*Yields computed on a latest reference price of ~₹410 (NSE, 30-Jul-2026). Live market price must be re-verified before publication.
Dividend Announcement Summary
The Board of Directors of Coal India Limited, at its meeting held on 27 April 2026 (commenced 15:00 hrs, concluded 20:00 hrs), declared a Final Dividend of ₹5.25 per equity share of face value ₹10 for the financial year 2025-26, as recommended by the Audit Committee. The dividend is expressly stated to be subject to shareholder approval at the ensuing Annual General Meeting.
The final dividend is the fourth payout of FY 2025-26, following three interim dividends (₹5.50 + ₹10.25 + ₹5.50). Together they take the full-year distribution to ₹26.50 per share. The company also confirmed it will pay dividends only through RBI-approved electronic modes — no physical warrants, cheques or demand drafts — following SEBI's 18-Nov-2025 amendment omitting the first and second proviso to Regulation 12. Shareholders are urged to update KYC in their demat accounts.
Beyond the wire: The headline "₹5.25 final dividend" understates the real story. On its own the final payout yields barely 1.28%. The reason Coal India screens as a ~6.5% yielder is the full-year ₹26.50 distribution — and part of that optical yield comes from a share price that has fallen roughly 13% from ~₹473 (28-Apr-2026) to ~₹410 (end-Jul-2026), not from a bigger dividend. See the Yield Reality Check below.
Key Dates Timeline
Sourcing note: The record date of 04-Sep-2026 and the AGM date were not in the 27-Apr-2026 board declaration letter — they were disclosed in the company's subsequent Regulation 42 intimation and AGM notice. Ex-date is inferred to equal the record date under India's T+1 settlement. The payment date is not disclosed; under the Companies Act 2013 it must fall within 30 days of AGM approval (i.e., by ~30-Sep-2026). Both inferred fields must be flagged as such and re-verified against the final NSE/BSE corporate-action notice.
Dividend Yield Analysis
Final Dividend Only (₹5.25)
A single final payout of ₹5.25 is a modest income event on its own.
Full-Year FY26 (₹26.50)
This is the number that makes Coal India one of the highest-yielding large-caps on the exchange.
For context, the broad Nifty dividend yield sits near 1.2-1.4%. Coal India's ~6.5% trailing yield is roughly 4-5x the market average and comfortably above metals/mining peers such as Hindustan Zinc (~5.8%) and NMDC (~4.2%).
Dividend History Analysis
| Financial Year | Interim(s) | Final | Total DPS |
|---|---|---|---|
| FY 2025-26 | 5.50 + 10.25 + 5.50 | 5.25 | ₹26.50 |
| FY 2024-25 | 15.75 + 5.60 | 5.15 | ₹26.50 |
| FY 2023-24 | 15.25 + 5.25 | 5.00 | ₹25.50 |
| FY 2022-23 | 15.00 + 5.25 | 4.00 | ₹24.25 |
| FY 2021-22 (verify) | — | — | ~₹17.00 |
Per-share figures aggregated from exchange filings and corporate-action records. FY2021-22 and earlier are flagged for independent verification before publication.
Consistency
Coal India has paid a dividend every single year since listing. The full-year DPS has climbed steadily from ₹24.25 (FY23) to ₹26.50 (FY26), with multiple payouts each year.
Classification
Consistent Payer. No cuts, no suspensions in the recent record. Note FY26's ₹26.50 is flat versus FY25's ₹26.50 — the growth streak paused even as the mix shifted toward a heavier second interim.
Financial Performance Analysis
| Metric (Consolidated) | FY 2025-26 | FY 2024-25 | Change |
|---|---|---|---|
| Net Profit (PAT) | ₹31,071 Cr | ₹35,450 Cr | -12.4% |
| EPS | ₹50.46 | ₹57.61 | -12.4% |
| Operating Cash Flow | ₹43,215 Cr | ₹30,237 Cr | +42.9% |
| Q4 PAT | ₹10,849 Cr | ₹9,752 Cr | +11.2% |
Why profit fell while cash rose — the non-obvious part
Full-year PAT dropped 12.4%, but this was driven largely by non-operating and one-off charges, not a collapse in the business. Two factors stand out: (1) a one-time salary provision of ₹1,457.90 Cr for executive pay-scale arrears (Aug-2023 to Dec-2025) following a Jabalpur High Court order in Jan-2026; and (2) higher employee and other costs catching up with near-flat volumes. Encouragingly, Q4 PAT actually rose 11.2% and operating cash flow jumped ~43% — signalling the operating engine remained healthy even as the reported bottom line optically weakened.
Restatement flag: CIL restated FY25 financials — statutory levies on coal now recognised on a gross (principal) basis rather than net (agency). This inflates reported revenue and makes some YoY revenue comparisons look worse than the operating reality. PAT figures across sources vary marginally (₹31,071 Cr vs ₹31,186 Cr) due to restatement; verify against the audited annual report.
Cash Flow Analysis
Reported profit is an opinion; cash is a fact. On the cash test Coal India looks stronger than its headline PAT suggests. FY26 operating cash flow of ₹43,215 Cr exceeded reported PAT of ₹31,071 Cr — an OCF/PAT ratio of about 1.39x. A number above 1.0x means the company is converting profits into real cash and then some, which is exactly what you want to see behind a large dividend.
Is the dividend funded by cash?
The full-year dividend outflow of ~₹16,331 Cr is covered 2.6x by operating cash flow alone. The final ₹5.25 payout (~₹3,235 Cr outflow) is covered 13.4x. This dividend is funded from current cash generation, not from borrowing or asset sales.
Free cash flow caveat
Coal India is in a heavy capex phase (targeting ~1 billion tonnes, ~₹1.4 lakh Cr of sanctioned projects). Exact FY26 free cash flow is Not Independently Verified here. Even so, OCF of ₹43,215 Cr provides a very wide margin over the dividend after reasonable capex.
Balance Sheet Strength
Coal India is an effectively net-cash company with ₹42,941 Cr more cash and investments than debt, a ~35% ROE and a ~24% ROCE. The balance sheet can absorb the entire FY26 dividend more than three times over from the cash pile alone — a rare margin of safety.
Dividend Sustainability Analysis
- Earnings coverage: EPS ₹50.46 vs total DPS ₹26.50 = 1.9x ✔
- Cash-flow coverage: OCF covers total dividend 2.6x ✔
- Cash coverage: Cash & investments cover it 3.5x ✔
- Debt: Net cash of ₹42,941 Cr — dividend not debt-funded ✔
Watch-outs on the sustainability thesis
Coverage is comfortable but tightening at the earnings level: the 1.9x EPS cover is thinner than the double-digit cash cover, because CIL now distributes over half its profit. If PAT keeps declining (it fell 12.4% in FY26) while payout stays high, earnings cover could compress further. The dividend is safe today, but is best described as sustainable-but-flat rather than sustainable-and-growing.
Peer Comparison
| Company | Trailing Yield | Payout Ratio | ROE |
|---|---|---|---|
| Coal India | ~6.5% | ~52.6% | 35.3% |
| Hindustan Zinc | ~5.8% | ~33% | |
| NMDC | ~4.2% | ~32-41% |
Blank cells left intentionally empty where a figure could not be verified from primary/exchange sources at research time, rather than populated with an estimate. Peer prices/yields are live-moving — re-verify before publication.
Within the resources/PSU dividend universe, Coal India offers the highest trailing yield of the group, but it also runs the highest payout ratio — meaning less of its profit is retained for growth. Hindustan Zinc and NMDC yield less but retain more, a different risk/return trade-off for income investors to weigh.
Promoter Impact Analysis
As majority owner, the Government of India is by far the largest beneficiary — collecting an estimated ₹9,983 Cr from the full-year FY26 distribution. Coal India's large, regular dividend is partly a function of its role as a reliable source of non-tax revenue for the exchequer. Alignment note: because the promoter and minority shareholders receive the same per-share dividend, the interests are aligned — but investors should recognise that the government's fiscal needs are a structural reason the payout stays high, which cuts both ways.
Flag: Government holding recently fell from ~63.13% (Mar-2026) to ~61.13% (Jun-2026), likely via an offer-for-sale. Confirm the promoter % effective on the 04-Sep-2026 record date before finalising the promoter-income figure.
Taxation Analysis
Since FY 2020-21, dividends are taxed in the hands of the shareholder at their applicable income-tax slab rate. Companies deduct TDS at 10% under Section 194 when total dividend paid to a resident shareholder in a financial year exceeds ₹5,000 (₹10,000 for some categories; verify current threshold). For those without a valid PAN, TDS is 20%. NRIs face 20% (plus surcharge/cess), subject to DTAA relief. Coal India requires TDS-exemption/lower-rate forms to be filed via its CIL Tax Portal.
Worked example — final dividend
Investor holds 1,000 shares · final ₹5.25/share · 30% slab
Worked example — full FY26
Investor holds 1,000 shares · total ₹26.50/share · 30% slab
*on ~₹410 reference price
Key Risks
1. Energy-transition / demand risk. A rising share of renewables and captive coal mining could erode Coal India's ~80% domestic market share over time.
2. Earnings pressure. FY26 PAT fell 12.4%; if e-auction premiums or volumes soften, high-payout dividends draw down harder on earnings cover.
3. Cost inflation. Employee costs (incl. the ₹1,457.90 Cr pay-scale catch-up) and other expenses are rising against near-flat volumes, compressing margins.
4. Regulatory / levy risk. Abrupt central or state taxes, duties and rehabilitation charges (e.g. Singrauli charge) can hit realisations unpredictably.
5. Government overhang. As majority owner, the government's disinvestment (OFS) actions and fiscal priorities influence both the stock's float and the payout policy.
6. Heavy capex cycle. The ~₹1.4 lakh Cr expansion toward 1 billion tonnes could compete with dividends for cash if returns disappoint.
What To Monitor
1. Coal production & offtake trends — monthly volume data versus the 1-billion-tonne target.
2. E-auction premium & realisation — the key swing factor for EBITDA/tonne.
3. Dividend payout vs earnings cover — whether the ~1.9x EPS cover holds if PAT keeps sliding.
4. Capex spend & free cash flow — how much of the cash pile the expansion programme consumes.
5. Government stake actions — further OFS, and any change in the payout stance.
6. Renewable / diversification progress — solar JVs (e.g. 600 MW Jalaun) and their contribution.
Conclusion
Coal India's ₹5.25 final dividend caps a full-year FY26 distribution of ₹26.50 per share — flat versus FY25 but backed by one of the strongest cash and balance-sheet profiles in the large-cap PSU space (₹42,941 Cr net cash, ~35% ROE, OCF covering the dividend 2.6x). The payout screens as Sustainable today.
Positives
- ~6.5% trailing yield, 4-5x the market
- Net cash of ₹42,941 Cr; dividend not debt-funded
- OCF up 43%; Q4 PAT up 11%
- Consistent multi-decade payer
Negatives / Watch
- FY26 PAT down 12.4%; DPS growth paused
- High ~52.6% payout thins earnings cover
- Structural energy-transition headwind
- Share price down ~13% since the announcement
This section presents positives, negatives, risks and monitoring factors so readers can form their own view. It contains no buy, sell or hold recommendation.
Frequently Asked Questions
What dividend has Coal India announced?
What is the dividend yield?
What is the record date?
What is the ex-date?
When will the dividend be paid?
Who is eligible for the dividend?
How is the dividend taxed?
Is the dividend sustainable?
What is Coal India's dividend history?
Why did profit fall but cash flow rise?
How much does the government earn from this dividend?
What should investors monitor going forward?
Disclaimer
This article is for informational and educational purposes only and does not constitute investment, tax or legal advice, nor a recommendation to buy, sell or hold any security. Event facts (dividend amount, face value, announcement, AGM) are sourced from Coal India Limited's exchange filings. Market price, yield, financial and shareholding figures are drawn from third-party sources and must be independently re-verified against live NSE/BSE data and the audited annual report before any decision. Certain dates (ex-date, payment date) are inferred and flagged as such. Figures marked "Not Disclosed by Company" or "Not Independently Verified" were unavailable from primary filings at research time. Securities investments are subject to market risks; consult a SEBI-registered adviser. ShareBazaar Online and its authors accept no liability for actions taken based on this content.