
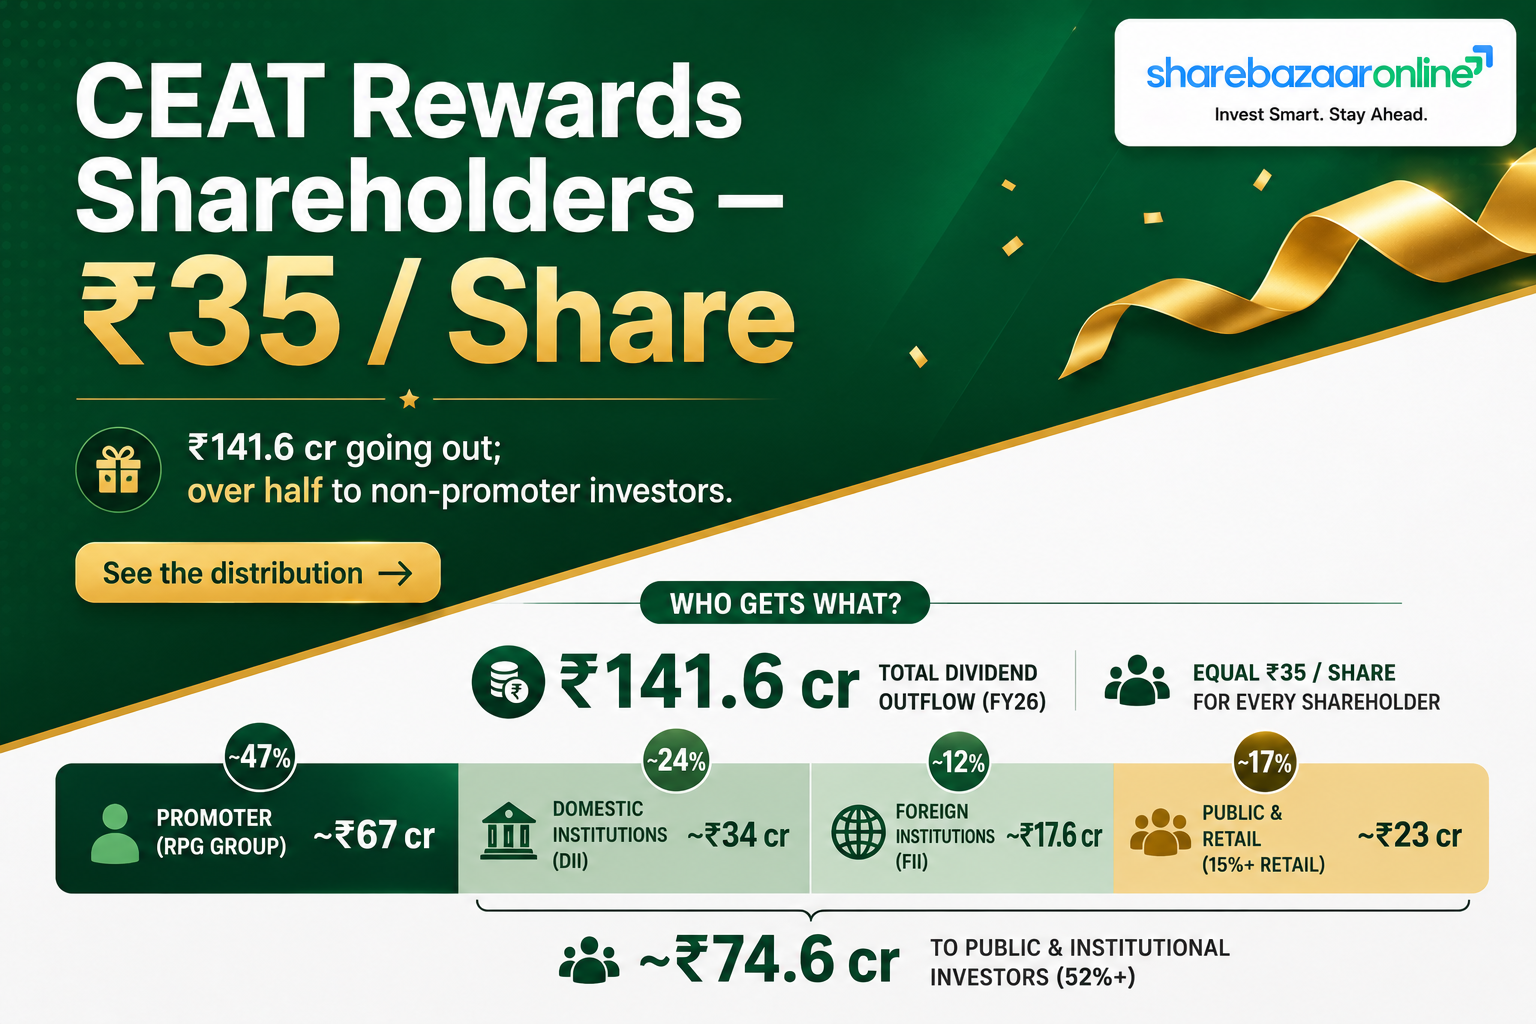
Dividend Snapshot
Key Facts
- CompanyCEAT Limited
- NSE / BSECEATLTD / 500878
- ISININE482A01020
- Dividend TypeFinal Dividend
- Dividend / Share₹35 (350%)
- Face Value₹10
At a Glance
- Financial YearFY2025-26
- Yield (on announce CMP)~1.00%
- Total Outflow~₹141.6 cr
- Payout Ratio (cons.)~20.3%
- Coverage (EPS/DPS)4.94x
- SustainabilitySustainable
CMP on announcement date (28 Apr 2026): ₹3,516.70 (NSE close). Latest market price must be re-verified against live NSE/BSE data before publication.
Dividend Announcement Summary
At its board meeting held on 28 April 2026, the Board of Directors of CEAT Limited recommended a final dividend of ₹35 per equity share (350% on the face value of ₹10) for the financial year ended 31 March 2026. The recommendation is subject to shareholder approval at the ensuing Annual General Meeting, after which the dividend will be paid or dispatched within 30 days.
This is CEAT's highest-ever dividend, up from ₹30 per share in FY2024-25 — an increase of 16.7%. The payout accompanies a record year: consolidated revenue crossed the ₹15,000 crore milestone at ₹15,678 crore (up 18.6%) and consolidated net profit reached ₹697 crore, the company's highest ever.
Non-obvious point wire services missed: Even though earnings jumped, CEAT lowered its payout ratio from ~25.7% (FY25) to ~20.3% (FY26). The dividend rose 16.7% while EPS rose ~48%. Management retained more cash — consistent with a year of heavy debt-funded capital expenditure and the CAMSO acquisition.
Key Dates Timeline
- 28 April 2026 — Board Meeting & Dividend Recommendation (Confirmed)
- Annual General Meeting — Date Not Disclosed by Company (to be intimated separately)
- Record Date — Not Disclosed by Company
- Ex-Date — Not Disclosed by Company (typically record date minus one trading day, once announced)
- Payment Date — Within 30 days of AGM approval (statutory / company-stated outer limit, exact date not yet disclosed)
CEAT has not yet filed its Regulation 42 record-date intimation. Do not state ex-date or payment date as confirmed until the company files them.
Dividend Yield Analysis
The Math
- Dividend / share₹35
- CMP on 28 Apr 2026₹3,516.70
- Yield on announce CMP0.99%
- Yield on 52-wk high (₹4,438)0.79%
Yield Reality Check
CEAT is a low-yield, growth-oriented tyre stock, not an income stock. At roughly 1%, the yield sits below the sector's larger dividend payers. The yield is not elevated by a falling share price or a one-time special payout — it is simply the natural result of a high share price (₹3,500+) against a modest absolute dividend.
Note: The stock fell from a 52-week high of ₹4,438 (Oct 2025) to ~₹3,517 by the announcement, which mechanically lifts yield slightly — but the effect is marginal at these levels.
Dividend History Analysis
| Financial Year | Dividend / Share | % | Type |
|---|---|---|---|
| FY2025-26 | ₹35.00 | 350% | Final |
| FY2024-25 | ₹30.00 | 300% | Final |
| FY2023-24 | ₹30.00 | 300% | Final |
| FY2022-23 | ₹12.00 | 120% | Final |
| FY2021-22 | ₹3.00 | 30% | Final |
| FY2020-21 | ₹18.00 | 180% | Final |
| FY2019-20 | ₹12.00 | 120% | Interim |
| FY2018-19 | ₹12.00 | 120% | Final |
| FY2017-18 | ₹11.50 | 115% | Final |
Classification: Consistent but cyclical payer. CEAT has paid a dividend every year for over a decade, but the amount swings with the raw-material and margin cycle — note the drop to just ₹3 in FY22 (a rubber-cost squeeze year) followed by recovery to ₹12, ₹30 and now ₹35. The dividend has grown at roughly 12% CAGR over ten years, but with real cuts along the way, so it should not be treated as a bond-like income stream.
Dividend history compiled from CEAT investor disclosures and corporate-action records; figures are as approved for each year. Not Independently Verified line-by-line against every year's AGM notice.
Financial Performance Analysis
| Metric (Consolidated) | FY2025-26 | FY2024-25 | Growth |
|---|---|---|---|
| Revenue from operations | ₹15,678 cr | ₹13,218 cr | +18.6% |
| EBITDA margin | 13.16% | ~12.6% | Expanded |
| Net profit (owners) | ₹697 cr | ₹471 cr | +48.1% |
| EPS (Basic) | ₹172.78 | ₹116.85 | +47.9% |
Operating Leverage — the hidden story
Revenue grew 18.6% but profit grew 48% — strong positive operating leverage. Two things amplified this: (1) EBITDA margin expansion on scale and cost discipline, and (2) a low FY25 base that had been dented by exceptional items. In FY26 the company still absorbed ₹70.73 cr of exceptional charges standalone (New Labour Codes provision ₹57.81 cr + Voluntary Retirement Scheme ₹12.92 cr) — so underlying operating profit was even higher than the headline suggests.
Caution flag: FY26 results include the CAMSO off-highway business only from 1 September 2025, so the year is not strictly comparable with FY25. Part of the revenue and cost growth is inorganic.
Cash Flow Analysis
Cash Generation (Consolidated)
- Operating cash flow (OCF)₹1,785.5 cr
- Capex (incl. intangibles)₹1,146.5 cr
- Free cash flow (FCF)₹639.0 cr
- OCF ÷ Net profit2.56x
How the Dividend is Funded
- Dividend outflow₹141.6 cr
- FCF coverage (cons.)4.51x
- FCF coverage (standalone)5.40x
- Funded fromCurrent cash flow
The finding wire services skip: profits are cash-backed, but reserves are thin
Reported profit is opinion; cash is fact — and CEAT's cash generation is genuinely strong: operating cash flow of ₹1,785.5 cr is 2.56x reported net profit, and free cash flow of ₹639 cr covers the dividend 4.5 times over. However, the ₹141.6 cr dividend is not paid from cash sitting on the balance sheet: standalone cash & equivalents are just ₹30.9 cr (cash coverage of only 0.22x). CEAT runs a lean-cash, high-throughput balance sheet and funds the dividend directly out of the year's operating cash flow — sustainable while cash generation holds up, but it leaves little buffer if a single weak quarter hits.
Balance Sheet Strength
Leverage (Consolidated)
- Net worth₹5,046 cr
- Gross borrowings FY26₹3,010.8 cr
- Gross borrowings FY25₹1,928.4 cr
- Debt increase+56.1%
- Debt / Equity0.60x
Returns
- ROE (consolidated)~13.8%
- ROE (standalone)~16.0%
- ROCE (standalone, est.)~17.2%
- Interest coverage5.17x
The debt-and-dividend tension
In the same year CEAT raised its dividend to a record ₹35, its gross debt rose ~56% (₹1,928 cr → ₹3,011 cr). The bulk of this went into the ~₹1,120 cr CAMSO off-highway acquisition (₹273.98 cr as equity + ₹719 cr as loan to the subsidiary) and an aggressive capex cycle. So a shareholder is receiving a bigger dividend while the company simultaneously levers up for growth — the payout is comfortably covered by cash flow, but debt-servicing capacity is now the metric to watch. Management has flagged plans to avail a further credit facility of up to ₹1,000 cr in FY27.
Dividend Sustainability Analysis
Grounded in four independent tests below.
1. Earnings coverage
EPS ₹172.78 covers the ₹35 dividend 4.94x. Payout only ~20%. Pass.
2. FCF coverage
Free cash flow ₹639 cr covers dividend 4.51x. Pass.
3. Cash on balance sheet
Standalone cash only ₹30.9 cr — 0.22x the dividend. Funded from flow, not reserves. Watch.
4. Balance-sheet strength
D/E 0.60x is manageable, but debt jumped 56% YoY. Watch.
Verdict: The FY26 dividend is Sustainable on earnings and cash-flow coverage. The two caveats — thin cash reserves and a sharp rise in debt — mean sustainability depends on CEAT holding its margins. That matters because early FY27 results have shown severe margin pressure (see Key Risks).
Peer Comparison
| Company | Latest Dividend / Sh | Approx. Yield | ROE (indic.) | Payout |
|---|---|---|---|---|
| CEAT | ₹35 (FY26) | ~1.0% | ~13.8% | ~20% |
| Apollo Tyres | Not verified | ~1.3–2.2% | ~8–9% | |
| MRF | Not verified | low (<0.2%) | ~5–7% | |
| Balkrishna Inds. | Not verified | ~13–14% | ||
| JK Tyre | Not verified |
Read-across: Every listed Indian tyre maker is a low-yield stock — the sector rewards shareholders mainly through capital appreciation and reinvestment, not dividends. CEAT's ~1% yield and ~20% payout are typical for the group. Its ROE (~13.8% consolidated) is competitive with Balkrishna and ahead of MRF and Apollo on the figures available.
Peer yield/ROE figures are indicative from third-party aggregators across differing reference dates and are Not Independently Verified. Blank cells indicate data not available from primary filings at research time and are deliberately left empty rather than estimated.
Promoter Impact Analysis
Shareholding (Mar 2026)
- Promoter (RPG Group)~47.29%
- DII~20.89%
- FII~16.55%
- Public / Others~15.27%
Where the ₹141.6 cr Goes
- To promoters (47.29%)~₹66.95 cr
- To DIIs (20.89%)~₹29.6 cr
- To FIIs (16.55%)~₹23.4 cr
- To public (~15.27%)~₹21.6 cr
With ~47% ownership, the RPG Group promoter receives an estimated ₹66.95 cr of the dividend. This is a normal outcome of a proportionate cash dividend — all shareholders receive the same ₹35 per share, so minority investors are not disadvantaged. The majority (~52.7%) of the payout flows to non-promoter investors, including institutions and retail.
Shareholding % from third-party aggregators for the Mar-2026 quarter; verify against CEAT's filed shareholding pattern before publication.
Taxation Analysis
How Dividends are Taxed in India
Since FY2020-21, dividends are taxed in the hands of the shareholder at their applicable income-tax slab rate (there is no separate Dividend Distribution Tax). The company must deduct TDS at 10% under Section 194 if a resident shareholder's total dividend in the financial year exceeds ₹5,000 (10% here reflects the standard rate; a higher rate applies if PAN is not furnished). The TDS is adjustable against final tax liability.
Worked Example — 1,000 shares, 30% slab
| Gross dividend (1,000 × ₹35) | ₹35,000 |
| TDS deducted @ 10% (> ₹5,000) | ₹3,500 |
| Net amount credited to bank | ₹31,500 |
| Total tax at 30% slab (on gross) | ₹10,500 |
| Net dividend after full tax | ₹24,500 |
| Effective post-tax yield (on ₹3,516.70) | ~0.70% |
Illustrative only; excludes surcharge and cess, which apply at higher income levels. Not tax advice — consult a qualified professional.
Key Risks
- 1.Raw-material inflation. Natural rubber and crude-linked input costs drive tyre margins. Management explicitly flagged a "steep increase in raw material cost" as a near-term challenge — the single biggest swing factor for CEAT's profits and, by extension, future dividends.
- 2.Sharp early-FY27 earnings deterioration. Post-announcement, CEAT's Q1 FY27 net profit reportedly collapsed to a low single-digit crore figure (a ~96% YoY fall) on raw-material inflation and forex losses, with EBITDA margin dropping to ~8.5%. The record FY26 dividend was declared just before this weakness surfaced.
- 3.Rising leverage. Gross debt jumped ~56% to ~₹3,011 cr to fund CAMSO and capex, with a further ₹1,000 cr facility planned for FY27. Higher interest costs compete with cash available for dividends.
- 4.Thin cash buffer. Standalone cash of ~₹30.9 cr means dividends depend on continuous operating cash generation rather than a reserve cushion.
- 5.Cyclicality & global exposure. Tyre demand tracks the auto cycle, and international/OEM exposure (now including CAMSO) adds currency and geopolitical sensitivity — the same forex swings that hurt early-FY27 profit.
- 6.Integration risk. The CAMSO off-highway business was consolidated only from Sep 2025; acquisition benefits and synergies are still unproven over a full cycle.
What To Monitor
- ✓EBITDA margin trajectory — whether the H2 FY27 price hikes management promised restore margins from the ~8.5% Q1 low back toward the ~13% FY26 level.
- ✓Raw-material cost index — natural rubber and crude prices, and CEAT's ability to pass them through via pricing.
- ✓Gross debt & interest cost — whether the planned ₹1,000 cr FY27 facility is drawn and how D/E and interest coverage move.
- ✓Free cash flow conversion — the real test of dividend durability given thin cash reserves.
- ✓CAMSO integration & off-highway volumes — revenue contribution and margins from the new business.
- ✓Record-date & AGM notice — the official Regulation 42 filing that will confirm ex-date and payment date.
Conclusion
Positives: CEAT's FY26 ₹35 dividend is its highest ever, comes off a record ₹15,678 cr revenue and ₹697 cr profit year, and is comfortably covered — 4.94x by earnings and 4.5x by free cash flow. Cash conversion is strong (OCF 2.56x net profit), and ROE/ROCE of ~14%/~17% are competitive within the tyre sector.
Negatives / watch-items: The payout ratio actually fell to ~20% as management retained cash; balance-sheet cash is thin (~₹30.9 cr, 0.22x the dividend); and gross debt rose ~56% to fund CAMSO and capex. Most importantly, early-FY27 results show a sharp margin and profit collapse on raw-material and forex pressure — the record dividend was declared just before that weakness became visible.
Net picture: A well-covered, sustainable dividend from a growth-oriented, cyclical tyre major — but one whose future increases hinge on margin recovery and disciplined debt management, not on any dividend-yield appeal. This is a report of facts and ratios, not a recommendation; investors should weigh the positives and risks against their own objectives.
Frequently Asked Questions
What dividend has CEAT announced for FY2025-26?
What is the CEAT dividend yield?
What is the record date for the CEAT dividend?
What is the ex-date for the CEAT dividend?
When will the CEAT dividend be paid?
Who is eligible to receive the dividend?
How is the CEAT dividend taxed?
Is the CEAT dividend sustainable?
What is CEAT's dividend history?
Why did CEAT lower its payout ratio despite higher profit?
How much dividend will the promoter (RPG Group) receive?
What should investors monitor after this dividend?
Disclaimer
This article is for informational and educational purposes only and does not constitute investment, financial, or tax advice, nor a recommendation to buy, sell, or hold any security. Dividend figures, dates, and financial data are based on CEAT Limited's board outcome and audited FY2025-26 results dated 28 April 2026, supplemented by third-party market data. Record date, ex-date, and payment date are not yet officially disclosed. Market prices and market-derived figures must be verified against live NSE/BSE data before acting. ShareBazaar Online is not a registered investment adviser. Investments in securities are subject to market risks; please read all related documents carefully and consult a SEBI-registered adviser before investing.