
Dividend Snapshot
Dividend Per Share
₹15.00 (150% of ₹10 FV)
Dividend Yield (approx.)
~1.15%
On CMP ~₹1,308 — verify live price
Dividend Type
Final Dividend (FY26)
Total Outflow
~₹11.36 crore
₹15 × ~0.757 cr shares
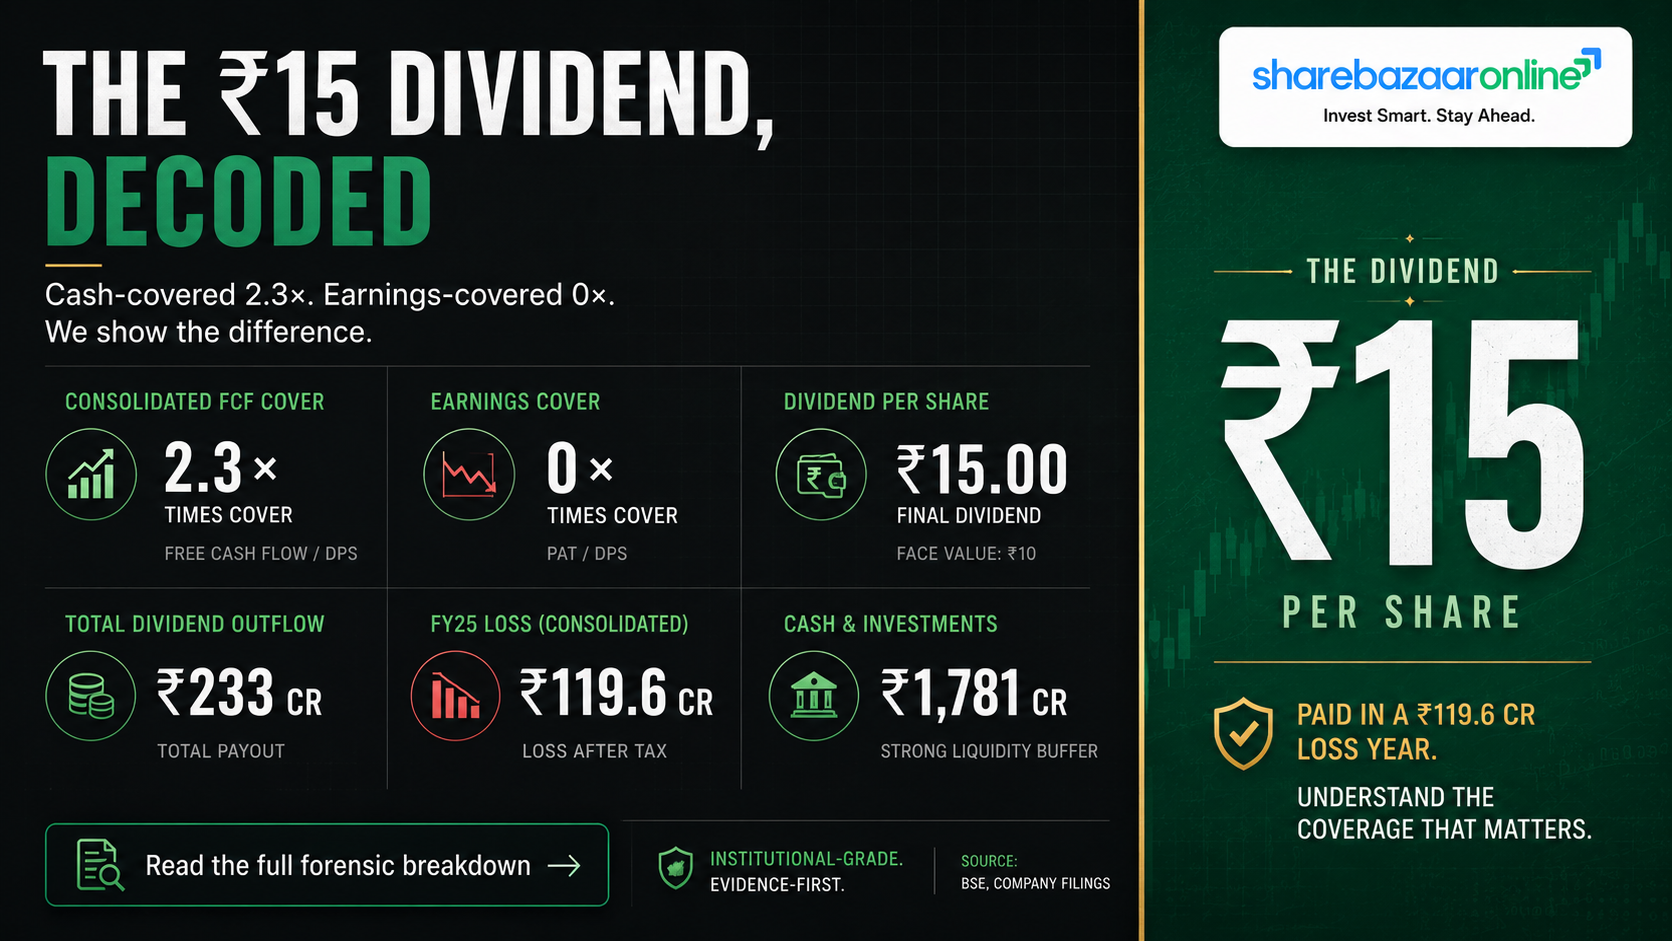
The one-line takeaway: BirlaNu is rewarding shareholders even though it reported a consolidated net loss of ₹119.56 crore in FY26. The ₹15 payout is a 50% cut from last year's ₹30 — a signal in itself. What keeps the dividend defensible is not profit but cash: consolidated free cash flow of ~₹26.3 crore covers the outflow ~2.3×.
NSE / BSE
BIRLANU / 509675
ISIN
INE557A01011
Sector
Building Materials (CK Birla Group)
Dividend Announcement Summary
At its board meeting on 12 May 2026 (2:20–4:00 pm IST), the Board of BirlaNu Limited recommended a final dividend of ₹15 per equity share (150%) on a face value of ₹10, for the financial year ended 31 March 2026. The dividend is subject to shareholder approval at the 79th AGM and, if approved, will be paid within 30 days of declaration.
What the same board meeting also did
- Approved audited standalone & consolidated FY26 results (unmodified audit opinion by B S R and Co).
- Appointed Mr. Pardha Saradhi Nooney as Chief Procurement Officer (SMP).
- Re-appointed Ernst & Young LLP as Internal Auditor for FY27.
- Re-appointed S.S. Zanwar & Associates as Cost Auditor for FY27.
Why this dividend is unusual
A dividend from a company that lost money at the group level is not automatically a red flag — but it does shift the question from "how much of profit is being shared?" to "can the balance sheet and cash flows afford it?" That is the lens this analysis uses throughout.
Key Dates Timeline
Announcement / Board Meeting
12 May 2026
Record Date
30 July 2026
Ex-Date (T+1)
30 July 2026
79th AGM
6 August 2026 (3:00 pm, VC/OAVM)
Payment Date
On or before 21 August 2026
Financial Year
FY2025–26 (ended 31 Mar 2026)
Note on ex-date: Under the current T+1 rolling settlement regime, the ex-date and record date fall on the same trading day. Both are exchange-confirmed via the company's Regulation 42 intimation.
Dividend Yield Analysis
Yield at current price
₹15 ÷ ~₹1,308 (CMP, mid-Jul 2026) = ~1.15%
Yield at announcement price
₹15 ÷ ~₹1,558 (BSE, 12–13 May 2026) = ~0.96%
Yield reality check — why the "yield" quoted online varies so much
Several data portals still show a trailing yield of ~2% because they use last year's ₹30 dividend. That number is stale. On the new ₹15 payout, the forward yield is a modest ~1.1–1.2%. Crucially, this is not a "high-yield because price crashed" situation in the classic value-trap sense — the yield is low precisely because the dividend was halved even as the share price also fell (down ~40%+ over the past year). Both moved down together, so the headline yield stays small.
Verify before publish: CMP and yield must be recomputed against the live NSE/BSE price on publication day.
Dividend History Analysis
| Financial Year | Dividend / Share | % of FV (₹10) | Trend |
|---|---|---|---|
| FY26 (current) | ₹15.00 | 150% | ▼ Cut 50% |
| FY25 | ₹30.00 | 300% | ▼ Cut 20% |
| FY24 | ₹37.50 (₹15 interim + ₹22.50 final) | 375% | — |
| FY23 | ₹45.00 (approx., interim + final) | 450% | ▲ |
Sourced from exchange corporate-action records / market data aggregators. FY23 split not independently reconciled — Not Independently Verified. Cross-check against BSE corporate actions before publishing older rows.
Payer classification
Historically a Consistent Payer — BirlaNu/HIL has paid a dividend every year for two decades. But it has now moved into a clear declining phase: the payout has fallen ~60% in two years (₹37.50 → ₹30 → ₹15), tracking the collapse in earnings.
The non-obvious point
The cut is arguably the responsible signal here. A board that maintained ₹30 into a ₹120 crore loss year would be funding dividends purely from reserves and debt. Halving it shows management is rationing cash — even if the optics of "dividend during a loss" look generous.
Financial Performance Analysis
Consolidated results (₹ crore)
| Metric | FY26 | FY25 | Change |
|---|---|---|---|
| Revenue from operations | 3,730.40 | 3,615.23 | +3.2% |
| EBITDA (derived) | 64.27 | 88.06 | −27.0% |
| Loss before tax | (116.01) | (43.45) | Wider |
| Net loss | (119.56) | (32.90) | +263% loss |
| EPS (₹) | (158.55) | (43.63) | — |
Operating-leverage breakdown — revenue rose, losses tripled. Why?
- Employee cost +10.8% (₹529 cr → ₹586 cr) vs revenue +3.2% — costs grew 3× faster than sales.
- Other expenses +8.8% (₹912 cr → ₹993 cr) — also outpacing revenue.
- A ₹4.34 cr incremental charge from the new Labour Codes (group-level) hit FY26.
- The result: EBITDA margin compressed from 2.4% to 1.7% — razor-thin for a ₹3,700 cr business.
The single biggest driver: Floors (Parador, Germany)
Segment PBT for FY26: Roofs +₹104.26 cr, Walls +₹26.57 cr, Pipes & Construction Chemicals −₹32.05 cr, and Floors −₹142.93 cr. The German flooring business (Parador) single-handedly dragged the entire group into the red. India's core (Roofs + Walls) remains profitable.
Standalone vs consolidated — a critical divergence
Standalone (India parent) net loss was only ₹14.04 cr vs the ₹119.56 cr consolidated loss. The gap is the overseas subsidiaries. Also note: standalone "profit before exceptional items" of ₹22.15 cr was almost entirely ₹21.75 cr of dividend income received from subsidiary Clean Coats — strip that out and standalone operations were roughly breakeven.
Exceptional items (standalone): a ₹39.41 cr gain on sale of held-for-sale assets was more than wiped out by a ₹74.20 cr provision for diminution in the value of the German holding company (BirlaNu International GmbH) — a write-down that flags stress in the overseas arm.
Cash Flow Analysis
Reported profit is an opinion; cash is a fact. This is where BirlaNu's dividend story gets more defensible than the loss headline suggests. Despite the ₹119.56 cr accounting loss, the group generated ₹118.55 cr of operating cash flow in FY26 — because the loss was driven by non-cash items (₹151.40 cr depreciation, the ₹74.20 cr / ₹28.70 cr impairments, fair-value losses) rather than a cash drain.
Free cash flow (consolidated)
OCF ₹118.55 cr − Capex ₹92.25 cr = FCF ₹26.30 cr
FCF covers the ₹11.36 cr dividend ~2.3×.
Free cash flow (standalone)
OCF ₹143.85 cr − Capex ₹81.49 cr = FCF ₹62.36 cr
The India parent — which actually pays the dividend — covers it ~5.5× from its own FCF.
How is the dividend funded? (honest answer)
Not from current-year profit (there was none), but from operating cash flow and reserves at the standalone level. A caution: standalone cash on hand is thin at ₹8.78 cr — less than the ₹11.36 cr dividend itself. So the payout will draw on operating inflows and liquid investments, not idle cash. Meanwhile the group added ~₹142 cr of borrowings during the year, so at a consolidated level the dividend coincides with rising leverage.
Balance Sheet Strength
Total equity (consol.)
₹1,110.38 cr
Gross borrowings (consol.)
₹852.33 cr
+20% YoY
Net debt / equity
~0.72×
Reading the balance sheet
- Consolidated borrowings rose from ~₹710 cr to ₹852 cr (+₹142 cr) — debt is increasing while dividends are being paid, a combination worth monitoring.
- Screener/aggregators flag a low interest-coverage ratio — unsurprising given the operating loss.
- Book value is high (~₹1,467/share consolidated), and the stock trades around 0.9–1.0× book — the market is pricing in the earnings stress.
- Positive: the auditors issued an unmodified (clean) opinion and no going-concern doubt was raised.
Dividend Sustainability Analysis
| Test | Result | Verdict |
|---|---|---|
| Earnings coverage | Net loss FY26; EPS (158.55) | ✗ Fails |
| FCF coverage (consol.) | ₹26.3 cr FCF vs ₹11.36 cr — 2.3× | ✓ Passes |
| FCF coverage (standalone) | ₹62.4 cr FCF — 5.5× | ✓ Passes |
| Cash on hand (standalone) | ₹8.78 cr < ₹11.36 cr outflow | △ Thin |
| Balance-sheet strength | Debt +20% YoY; low interest cover | △ Weakening |
Bottom line: On earnings the dividend is unsustainable — there were no FY26 profits to distribute. On cash flow it is comfortably covered. The tie-breaker is direction of travel: losses are widening, debt is rising, and the board has already cut the payout by half. If Parador does not turn around, a further cut or a pause is a realistic scenario. The current ₹15 is affordable; its durability is not guaranteed.
Peer Comparison
Fibre-cement / building-products peers — FY26
| Company | Revenue (₹cr) | Net Profit (₹cr) | DPS (₹) | FV (₹) |
|---|---|---|---|---|
| BirlaNu | 3,730 | (119.6) | 15.00 | 10 |
| Visaka Industries | ~1,678 | ~85 | 1.20 | 10 |
| Everest Industries | 1,417 | (101.7) | 1.00 | 10 |
| Ramco Industries | ~1,510 (FY25) | ~56 (FY25) | Not yet verified | 1 |
Peer figures from company results / market data — Not Independently Verified; confirm before publish. Ramco FY26 dividend left blank rather than estimated. Different face values make absolute DPS non-comparable — read alongside yield.
What the peer set actually reveals
The whole sector is under margin stress — two of the four majors (BirlaNu and Everest) reported FY26 losses. Against that backdrop, BirlaNu pays by far the largest absolute dividend (₹15 vs ₹1.00–1.20 for peers) — but this is partly a face-value/share-price artefact. On yield, BirlaNu's ~1.15% is broadly in line with peers. The genuinely notable fact is that BirlaNu is combining the sector's biggest loss with its biggest headline payout, funded by cash flow rather than profit.
Promoter Impact Analysis
Shareholding (latest available)
- Promoter (CK Birla group): ~40.56%
- FII: ~2.87%
- DII: ~0.05%
- Public & others: ~56.5% (incl. ~4% government-linked)
Source: exchange shareholding pattern — verify latest quarter.
Who gets the ₹11.36 cr?
- Promoter share (40.56%): ~₹4.61 cr
- Public / minority (59.44%): ~₹6.75 cr
With ~40% promoter holding, the majority of the dividend flows to public shareholders. This is not a case of an ~75% promoter using dividends to extract cash — the payout is broadly distributed.
Distribution impact: Since dividends are now taxed in the shareholder's hands at slab rates, high-slab promoters/individuals effectively receive less. For a group balancing a loss-making year with a payout, the modest promoter benefit (~₹4.6 cr) does not by itself explain the decision — the cut suggests capital-preservation, not extraction.
Taxation Analysis
How dividends are taxed in India (post-2020)
- Dividends are taxable in the investor's hands at their income-tax slab rate (there is no separate Dividend Distribution Tax anymore).
- The company deducts TDS at 10% under Section 194 if a resident shareholder's total dividend from the company exceeds ₹10,000 in the financial year (₹5,000 threshold applied earlier — confirm the current-year limit).
- No TDS if you submit a valid Form 15G/15H and are eligible.
- The TDS is adjustable against your final tax liability when you file returns.
Worked example — 1,000 shares, ₹15 dividend, 30% slab investor
| Gross dividend (1,000 × ₹15) | ₹15,000 |
| TDS deducted at 10% (above ₹10k) | ₹1,500 |
| Amount credited upfront | ₹13,500 |
| Total tax at 30% slab (on gross) | ₹4,500 |
| Net dividend after full tax | ₹10,500 |
| Effective post-tax yield (CMP ~₹1,308) | ~0.80% |
Illustrative; excludes surcharge/cess. A 30%-slab investor keeps ₹10,500 of the ₹15,000. Lower-slab investors keep more. Consult a tax advisor for your situation.
Key Risks
- Parador / Floors drag: the German flooring business lost ₹142.93 cr in FY26 and triggered a ₹74.20 cr write-down. Continued losses there could force a deeper dividend cut.
- Widening losses despite revenue growth: net loss tripled to ₹119.56 cr even as revenue rose 3.2% — margin structure is the core problem.
- Rising leverage: consolidated borrowings up ~20% (+₹142 cr) with a low interest-coverage ratio; higher rates or slower cash generation squeeze the balance sheet.
- Thin standalone cash: ₹8.78 cr on hand is below the dividend outflow itself, leaving little buffer if operating inflows dip.
- Input-cost and demand cyclicality: building materials are exposed to cement/energy prices, monsoon-linked rural roofing demand, and construction cycles.
- Integration overhang: back-to-back acquisitions (Crestia pipes group, Clean Coats) and amalgamations add execution and goodwill-impairment risk (goodwill ~₹281 cr consolidated).
What To Monitor
- Parador quarterly trajectory: the single most important number — is the Floors segment loss narrowing? Watch Parador's US/Middle-East/Asia expansion for traction.
- Consolidated EBITDA margin: can it recover from the current ~1.7% toward historical levels?
- Net debt and interest coverage: is borrowing stabilising, or still climbing to fund operations plus dividends?
- Standalone vs consolidated gap: the India business is profitable-to-breakeven; track whether the overseas drag is shrinking.
- Next dividend decision (FY27): whether the board holds ₹15, cuts again, or restores — the clearest signal of management's own confidence.
- Goodwill / further impairments: any additional write-downs on Parador or acquisitions.
Conclusion
BirlaNu's FY26 final dividend of ₹15 per share is a study in contrasts. On the surface it looks generous — a payout in a year the group lost ₹119.56 crore. Look closer and it is more disciplined than it appears: it is a 50% cut from last year, it is covered ~2.3× by consolidated free cash flow (because the loss is largely non-cash), and the India business that actually funds it remains cash-generative.
The real story is not the dividend — it is Parador. The German flooring arm's ₹142.93 cr loss and ₹74.20 cr write-down are what turned a profitable Indian roofing-and-walls franchise into a loss-making group. The dividend is affordable today; whether it is durable depends almost entirely on whether that overseas drag is fixed. Positives (clean audit, cash-covered payout, profitable India core, broad shareholder distribution) sit alongside real negatives (tripling losses, rising debt, thin cash, an already-halved dividend). We present both — the investment decision is yours.
Frequently Asked Questions
What dividend has BirlaNu announced for FY26?
What is the dividend yield?
What is the record date for the BirlaNu dividend?
What is the ex-date?
When will the dividend be paid?
Who is eligible to receive the dividend?
How is this dividend taxed?
Is the dividend sustainable?
Why is BirlaNu paying a dividend if it made a loss?
What is BirlaNu's dividend history?
Which business is dragging BirlaNu into losses?
What should investors monitor from here?
Disclaimer
This article is for informational and educational purposes only and does not constitute investment advice or a recommendation to buy, sell, or hold any security. Event-specific facts (dividend, record/ex/payment dates, AGM) are drawn from BirlaNu Limited's exchange filings under SEBI (LODR) Regulations 30, 33 and 42. Market price, yield, shareholding, dividend history and peer figures are compiled from public market-data sources and are indicative and subject to change — they must be independently verified against live exchange data before any decision. ShareBazaar Online and its authors are not liable for any loss arising from the use of this information. Please consult a SEBI-registered investment adviser and a qualified tax professional before investing. Figures unavailable from primary filings are marked "Not Disclosed by Company" or "Not Independently Verified".