
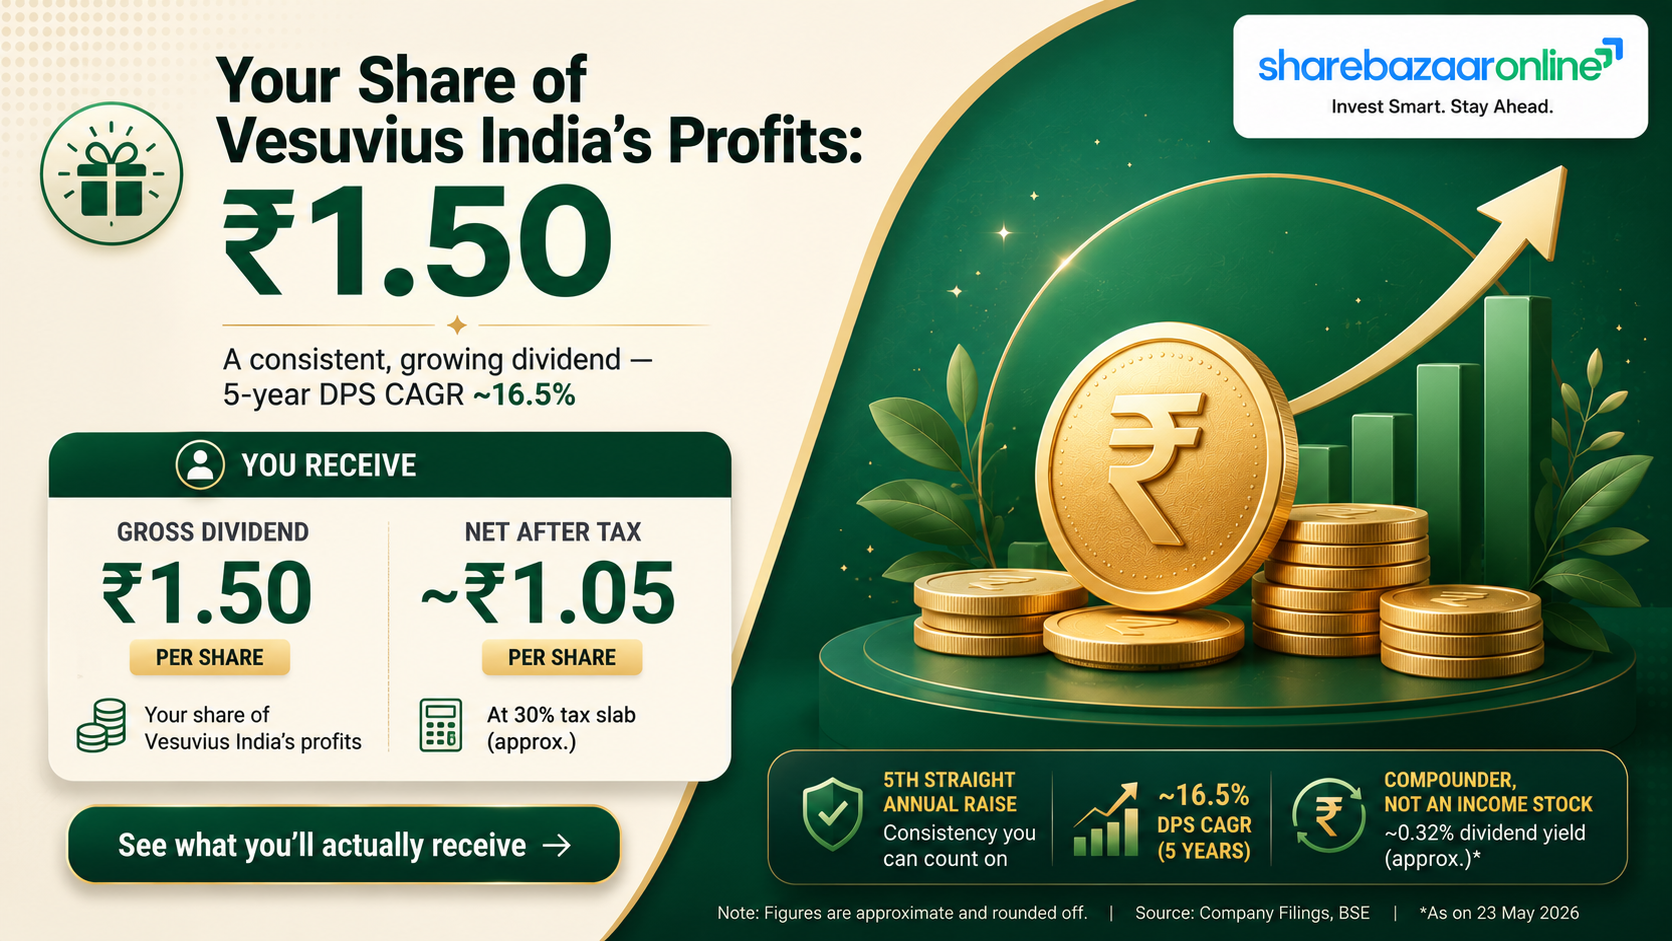
Dividend Snapshot
Company
Vesuvius India Limited
NSE: VESUVIUS | BSE: 520113
Refractories & Steel Flow Control (Capital Goods)
Dividend
₹1.50 per share (Final)
150% of ₹1 face value
For FY ended 31 December 2025
Dividend Yield
~0.32%
at CMP ≈ ₹466*
Payout Ratio
11.5%
of FY25 PAT
Coverage
8.67x
EPS ₹13.01 ÷ DPS
Total Outflow
₹30.45 Cr
20.30 Cr shares
*Current market price must be verified against live NSE/BSE bhavcopy before publication. Yield moves inversely with price.
Dividend Announcement Summary
At its board meeting on 26 February 2026, the Board of Directors of Vesuvius India recommended a final dividend of ₹1.50 per equity share of face value Re. 1 each for the financial year ended 31 December 2025. The recommendation was made under Regulations 30 and 42 of SEBI LODR and was subject to shareholder approval at the Annual General Meeting.
Key points from the filing
- Dividend of ₹1.50/share vs ₹1.45/share (split-adjusted) last year — a modest +3.4% increase.
- Vesuvius follows a January–December (calendar) financial year, unlike most Indian peers.
- The board also approved audited FY2025 results with an unmodified audit opinion.
- A new CFO (Mr. Neeraj Kumar Jumrani) was appointed w.e.f. 16 March 2026.
What the wires didn't flag
- The equity shares were sub-divided 10-for-1 (₹10 → ₹1 face value) with effect from 10 June 2025. All per-share figures here are on the new Re. 1 base.
- FY25 profit includes a one-time land-sale gain of ₹25.26 Cr (pre-tax) from the Visakhapatnam plant closure.
- The company remains essentially debt-free with only small lease liabilities.
Key Dates Timeline
Announcement Date
26 February 2026
Board meeting / Reg 30 disclosure
Record Date
30 April 2026 (Thursday)
Company disclosed (Reg 42)
Ex-Date
30 April 2026 (inferred)
Under T+1 settlement the ex-date and record date normally coincide. Not stated in the filing — verify against exchange ex-date circular.
Payment Date
After AGM (7 May 2026)
"Paid thereafter" per filing. Exact date Not Disclosed by Company; statutory outer limit is ~30 days from declaration (≈ early June 2026).
AGM: Thursday, 7 May 2026. To be eligible, shares had to be held as of the record date, 30 April 2026.
Dividend Yield Analysis
Dividend yield = Dividend per share ÷ Current market price. At a market price of about ₹466, the ₹1.50 dividend works out to a yield of roughly 0.32%. This is a low-yield, capital-appreciation stock, not an income stock. The dividend is small relative to the share price because the company retains most of its earnings and the stock trades at a high P/E (about 36x).
Yield reality check
The yield is low for a "good" reason, not a bad one: it reflects a strong share price and a deliberately low payout (11.5%), not a distressed business. A yield chaser will find little here — the appeal, if any, is earnings growth and a fortress balance sheet rather than income.
Yield sensitivity
| Share price | Yield on ₹1.50 |
|---|---|
| ₹400 | 0.38% |
| ₹466* | 0.32% |
| ₹550 | 0.27% |
*Research-time price; verify before publication.
Dividend History Analysis
All figures restated to the current face value of Re. 1 (post the June 2025 10:1 split) for a like-for-like comparison, per Ind AS 33.
| Financial Year (Dec-end) | DPS (₹, adj.) | EPS (₹, adj.) | Payout % | Trend |
|---|---|---|---|---|
| FY2020 | 0.70 | 2.61 | ~27% | — |
| FY2021 | 0.80 | 3.35 | ~24% | ↑ |
| FY2022 | 0.82 | 5.75 | ~14% | ↑ |
| FY2023 | 1.28 | 10.49 | ~12% | ↑ |
| FY2024 | 1.45 | 13.03 | ~11% | ↑ |
| FY2025 | 1.50 | 13.01 | ~12% | ↑ |
Sources: company filing (FY25); dividend aggregators & Screener.in payout data (earlier years), cross-checked against cash-flow dividend outflows. Pre-FY2020 comparisons omitted rather than shown with unverified restated figures.
Classification: Consistent Payer
Vesuvius has raised its dividend every year over this window — a DPS CAGR of about 16.5% (FY20–FY25) with no cuts or suspensions, including through the COVID year. That places it firmly in the consistent, growing payer bucket.
The non-obvious point
Even as DPS rose, the payout ratio fell from ~27% to ~12% because profits grew far faster than the dividend. And FY25's increase (₹1.45 → ₹1.50, +3.4%) is the slowest raise in years and lags EPS — the dividend is being nudged up, not scaled with earnings.
Financial Performance Analysis
| ₹ Crore | FY2024 | FY2025 | Growth |
|---|---|---|---|
| Revenue from operations | 1,868.6 | 2,104.3 | +12.6% |
| EBITDA (operating) | 347.4 | 360.3 | +3.7% |
| EBITDA margin | 18.6% | 17.2% | −147 bps |
| Profit before tax (reported) | 348.8 | 356.4 | +2.2% |
| Net profit (reported) | 264.5 | 264.1 | −0.2% |
| EPS (₹, adj.) | 13.03 | 13.01 | −0.2% |
The operating-leverage break: revenue up, profit flat
This is the single most important story in the numbers, and one aggregator "dividend declared" headlines miss entirely. Revenue rose 12.6% but net profit was flat to marginally lower. Why? Costs outran sales: material cost +26.2%, employee cost +22.4%, other expenses +16.2%, and depreciation +34.5% as the new Visakhapatnam (Al-Si Monolithic) plant came on stream. The result was margin compression of ~147 bps.
Strip out the one-off, and core profit fell
FY25 "Other Income" includes a one-time gain of ₹25.26 Cr (pre-tax; ~₹17.1 Cr after tax) from selling the old Vizag plant land. That is 6.5% of reported PAT. Excluding it, core PBT fell about 5.1% year-on-year and core EPS was roughly ₹12.17 versus the reported ₹13.01. Underlying operating performance was weaker than the headline suggests.
Cash Flow Analysis
Reported profit is an opinion; cash is a fact. In FY25, operating cash flow was ₹177.5 Cr against net profit of ₹264.1 Cr — an OCF-to-PAT conversion of only ~67%, down from a stronger prior year. The gap is working capital: trade receivables rose ₹98 Cr and inventories rose ₹50 Cr as the business scaled, absorbing cash.
Free cash flow & how the dividend is funded
- OCF: ₹177.5 Cr
- Capex: ₹105.3 Cr (elevated — plant build-out)
- FCF before asset sales: ₹72.1 Cr
- Dividend outflow: ₹30.45 Cr
The dividend is comfortably funded by current-year free cash flow (~2.4x cover) — no borrowing or reserve draw-down is required.
Two nuances worth flagging
First, reported "FCF" of ~₹102 Cr on some data services is flattered by ₹29.8 Cr of one-time land-sale proceeds. Recurring FCF is closer to ₹72 Cr. Second, cash conversion has softened versus history — worth monitoring if receivables keep climbing.
Balance Sheet Strength
Cash & Bank
₹582 Cr
Borrowings
Nil*
*only ~₹14 Cr leases
Net Worth
₹1,664 Cr
Book Value
~₹82 / sh
Vesuvius runs a net-cash, essentially debt-free balance sheet. The auditors confirmed the company had no loans or borrowings during the year. Cash and bank balances of about ₹582 Cr cover the ₹30.45 Cr dividend roughly 19 times over. In short, affordability is a non-issue; the question is whether the company is too conservative with distributions (see Capital Allocation, in Sustainability below).
Dividend Sustainability Analysis
Multi-metric stress test
- Earnings cover: 8.67x (EPS ₹13.01 vs DPS ₹1.50) — very high.
- FCF cover: ~2.4x on recurring FCF — comfortable.
- Cash cover: ~19x on cash & bank — fortress.
- Debt: essentially nil — no leverage risk to the payout.
Capital allocation question
With ~₹582 Cr of idle cash and only an 11.5% payout, the debate is not sustainability but under-distribution. Management is retaining heavily to fund capex (the new Vizag plant). A higher dividend, a special dividend, or a buyback are all options it has chosen not to exercise — a capital-allocation stance investors should weigh.
Peer Comparison
| Refractory peer | Div Yield | Payout | ROE | ROCE | Debt |
|---|---|---|---|---|---|
| Vesuvius India | ~0.33% | ~12% | 15.0% | 21.3% | Debt-free |
| RHI Magnesita India | ~0.56% | ~31% | ~4–5% | ~5–7% | Low |
| IFGL Refractories | ~1.1% | ~13–29% | ~3–11% | ~5–15% | Low |
Sources: Screener.in and dividend aggregators, research-time. IFGL figures span a range across data providers (a group restructuring is in progress) and should be re-verified. Peer yields/ratios move with price.
The standout: Vesuvius offers the lowest yield of the three but by far the best return ratios — a 21% ROCE and 15% ROE, roughly 3–4x the profitability of RHI Magnesita India on those measures. Peers with higher yields (IFGL, RHIM) are paying out a larger slice of weaker earnings. On a total-quality basis, Vesuvius is the strongest business in the group, which is precisely why the market prices its income so richly (low yield).
Promoter Impact Analysis
Promoter Holding
55.57%
Vesuvius Group (UK)
Promoter Dividend
₹16.92 Cr
of ₹30.45 Cr total
Public/Institutions
₹13.53 Cr
DII 22.0% · FII 4.6% · Public 17.8%
The UK parent (Vesuvius plc) collects the majority — about ₹16.9 Cr of the ₹30.45 Cr payout. Promoter holding has been stable at 55.57% for years, and there is a mirror debate at the parent: with over ₹580 Cr in cash at the Indian arm, a low payout means the promoter is effectively choosing reinvestment over repatriation. Minority holders share proportionally in the same modest distribution and benefit far more from the retained-earnings growth engine than from the dividend cheque itself.
Taxation Analysis
Since FY2020-21, dividends in India are taxed in the hands of the shareholder at their applicable income-tax slab rate (dividend distribution tax was abolished). The company deducts TDS at 10% under Section 194 if a resident shareholder's total dividend from that company in a financial year exceeds ₹5,000 (₹10,000 from FY2025-26). Submitting Form 15G/15H can avoid TDS for those below the taxable threshold.
Worked example (generic, ₹10/share)
| 1,000 shares × ₹10 | ₹10,000 gross |
| TDS @ 10% (deducted at source) | ₹1,000 |
| Tax at 30% slab (+ cess) | ₹3,000+ |
| Net in hand (30% bracket) | ₹7,000 |
TDS is adjusted against final liability; net depends on your slab. Cess (4%) applies on the tax.
Vesuvius-specific reality
At ₹1.50/share, you'd need to hold over ~6,600 shares for the dividend to cross ₹10,000 and trigger TDS. A holder of 1,000 shares gets ₹1,500 gross — no TDS, and after a 30% slab, ~₹1,050 net. Effective post-tax yield at a 30% slab is roughly 0.22%.
Key Risks
1. Steel-cycle dependence
Refractory demand is tied to steel and metals output. A downturn in Indian steel volumes directly hits Vesuvius' order book and margins.
2. Margin pressure
EBITDA margin compressed ~147 bps in FY25 as raw-material, employee and other costs outran revenue. Continued cost inflation could keep profit growth behind sales.
3. Working-capital drag
Receivables rose ₹98 Cr and debtor days climbed to ~84. Weaker cash conversion (OCF/PAT ~67%) can persist if customer credit stretches further.
4. One-off flattered FY25
A ₹25.3 Cr land-sale gain propped up reported profit. Ex the one-off, core earnings fell — FY26 faces a tougher base.
5. Low-yield, high-valuation stock
At ~36x P/E and ~0.32% yield, the stock offers little income cushion; returns rely on continued earnings growth, which the market already prices in.
6. Litigation & tax disputes
The audit annexure lists disputed indirect-tax and income-tax demands (income-tax amount paid under dispute ~₹92 Cr). Adverse rulings could affect cash, though not the going concern.
What To Monitor
1. EBITDA margin trajectory
Whether the new Vizag plant's operating leverage reverses the FY25 margin dip as utilisation ramps up.
2. Cash conversion & debtor days
Track OCF/PAT and receivable days each quarter; a return toward historic conversion signals healthy growth.
3. Capital allocation of the ₹580 Cr cash
Watch for any move on payout ratio, a special dividend, or a buyback — the biggest potential re-rating lever.
4. Core (ex one-off) earnings growth
FY26 growth versus FY25's one-off-inflated base is the real test of the business.
5. Steel-sector capex & demand
Domestic steel expansion plans and utilisation drive refractory consumption — the top-line engine.
6. New management execution
A new CFO and several new senior leaders joined in early 2026; watch for strategy or capital-policy shifts.
Conclusion
Positives
A consistent, growing dividend (16.5% CAGR, no cuts), a fortress debt-free balance sheet with ~₹582 Cr cash, best-in-class refractory-sector return ratios (ROCE 21%, ROE 15%), and a dividend covered ~8.7x by earnings and ~19x by cash — sustainability is not in question.
Negatives / watch-outs
FY25 net profit was flat despite 12.6% revenue growth; core (ex land-sale) profit actually fell ~5%; EBITDA margins compressed ~147 bps; cash conversion softened; the yield is a thin ~0.32% at a rich ~36x P/E; and a low 11.5% payout leaves a large idle cash balance whose deployment is unresolved.
Net-net, this is a high-quality, low-yield compounder where the dividend is a small, reliable extra rather than the reason to own the stock. We present the positives, negatives, risks and monitoring factors above and leave the decision to you.
Frequently Asked Questions
What dividend has Vesuvius India announced?
What is the dividend yield?
What is the record date?
What is the ex-date?
When will the dividend be paid?
Who is eligible for the dividend?
How is this dividend taxed?
Is the dividend sustainable?
What is Vesuvius India's dividend history like?
Why did FY25 profit stay flat despite higher revenue?
What was the 10:1 stock split about?
How does Vesuvius compare with refractory peers?
How much dividend does the promoter receive?
Does Vesuvius have any debt?
What should investors monitor going forward?
Disclaimer
This article is for informational and educational purposes only and does not constitute investment, financial, legal or tax advice, nor a recommendation to buy, sell or hold any security. Figures are drawn from Vesuvius India Limited's exchange filing dated 26 February 2026 and publicly available secondary sources (Screener.in and dividend aggregators), which may contain errors or be out of date; the current market price in particular must be verified against live NSE/BSE data. ShareBazaar Online is not a SEBI-registered investment adviser. Dividends are subject to shareholder approval and taxation in the investor's hands. Please consult a qualified professional and do your own research before investing. Investments in securities are subject to market risks.