
Dividend Snapshot
Final Dividend
₹29.59 per share (1480%)
Face value ₹2 · FY ended 31 Dec 2025
Dividend Yield (approx.)
~0.40%
On final DPS at CMP ~₹7,375 · ~0.53% on full-year DPS of ₹39.36
Total Final Dividend Outflow
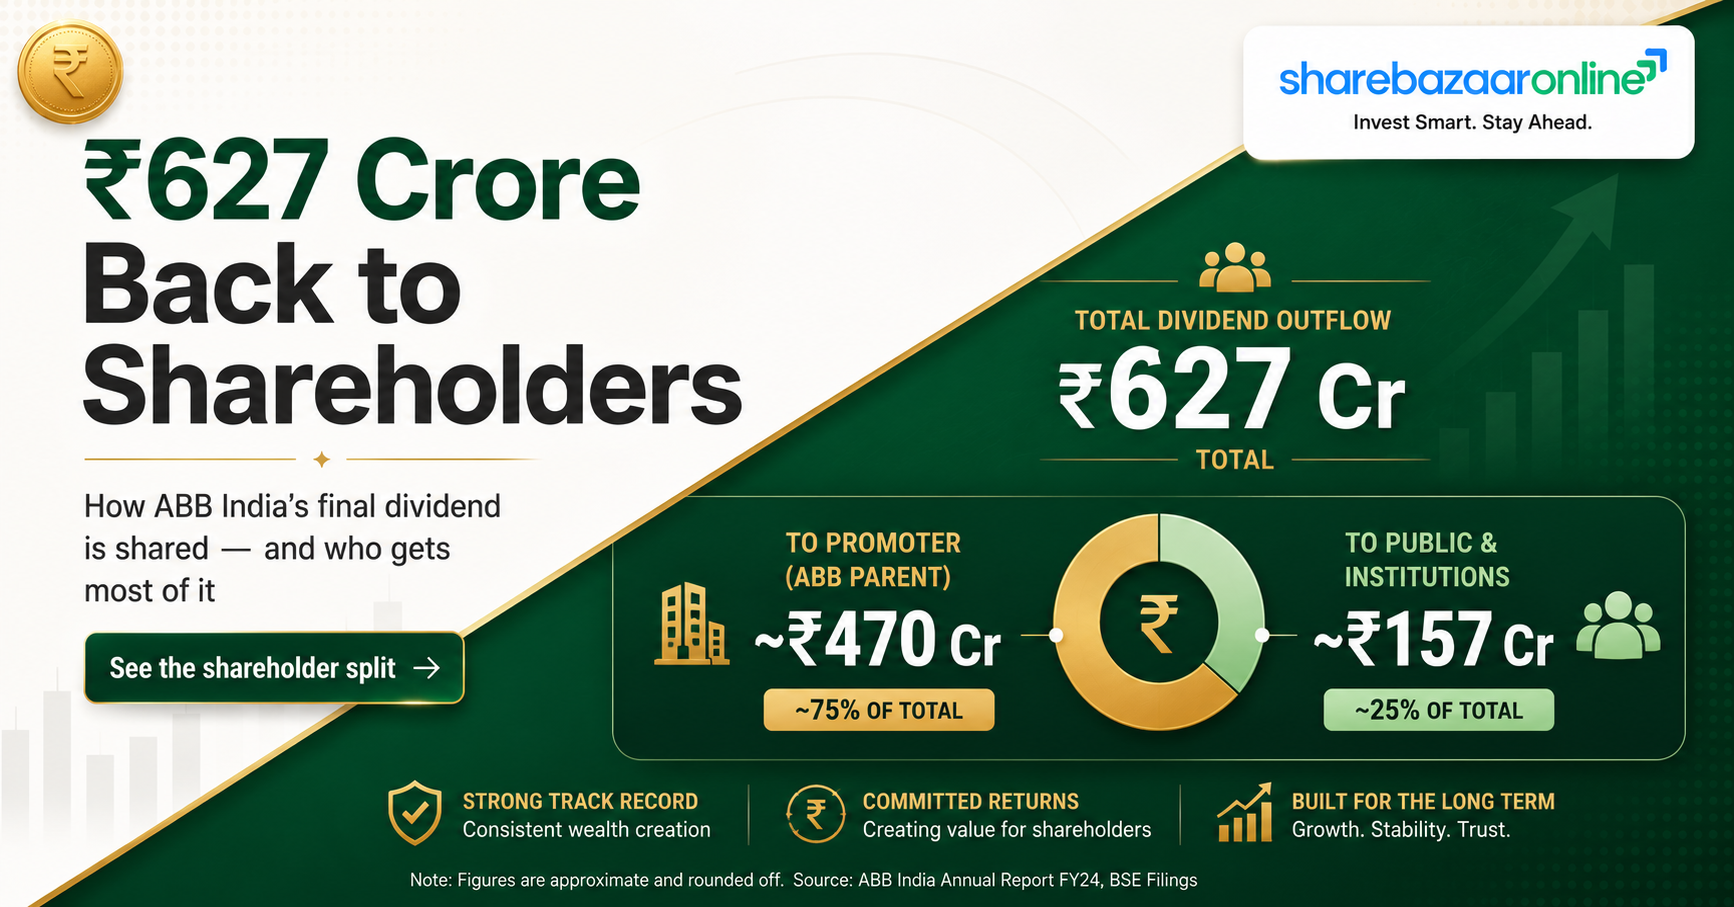
~₹627 Cr
On 21,19,08,375 equity shares
Payout Ratio
37.6% (final only)
50.0% including the ₹9.77 interim — ABB’s stated policy
The one thing wire coverage misses: the headline “1480%” sounds enormous, but it is calculated on a ₹2 face value and the real dividend yield is under 0.5%. More importantly, the final dividend is down about 11.7% from last year’s ₹33.50, and the full-year dividend is down about 10.9% — because ABB India’s FY2025 net profit fell even as revenue rose. ABB is a growth/quality compounder, not an income stock.
At its Board meeting on 19 February 2026 (which ran from 2:00 p.m. to 4:15 p.m.), the Board of Directors of ABB India Limited recommended a final dividend of ₹29.59 per equity share — that is 1480% on the ₹2 paid-up face value — on 21,19,08,375 fully paid-up equity shares, for the financial year ended 31 December 2025. ABB India follows a January–December financial year, so “FY2025” here means calendar-year 2025.
The recommendation was subject to shareholders’ approval at the 76th Annual General Meeting, held on 09 May 2026 in Peenya, Bengaluru. Per subsequent exchange filings, the AGM was held and all resolutions were passed, so the dividend stands approved and has been paid.
Reference details (from the exchange filing)
- Company: ABB India Limited
- NSE Symbol: ABB · BSE Code: 500002
- ISIN: INE117A01022 · CIN: L32202KA1949PLC032923
- Dividend type: Final Dividend (recommended, AGM-approved)
- Disclosure: SEBI LODR Regulation 30 outcome dated 19 Feb 2026
Key Dates Timeline
Announcement / Board Meeting
19 February 2026
Record Date (company-disclosed)
02 May 2026
Ex-Date (per exchange / not stated in filing)
30 April 2026 (inferred)
AGM / Approval
09 May 2026
Payment Date
After 09 May 2026
Book closure ran from 03 May to 09 May 2026 (both days inclusive). The company’s filing named 02 May 2026 as the record date but did not state a separate ex-date. Under India’s T+1 settlement, the ex-date normally falls one trading day before the record date; because 01 May (Maharashtra Day) is a holiday and 02 May 2026 was a Saturday, the ex-date effectively fell on 30 April 2026, as reported by the exchanges. We flag this as inferred from settlement logic, not a figure the company itself disclosed.
Dividend Yield Analysis
Yield at Announcement
~0.49%
Final DPS ₹29.59 ÷ ~₹6,007 (20 Feb 2026 close, first full session after the news)
Yield at Current Price
~0.40%
Final DPS ₹29.59 ÷ ~₹7,375 (CMP — verify against live NSE/BSE quote)
Yield reality check. Even counting the full-year dividend of ₹39.36 (₹9.77 interim in August 2025 plus the ₹29.59 final), the trailing yield is only about 0.53%. That is well below a bank savings rate. The reason is simple: ABB India trades at a very high valuation (recent P/E in the 50s on a normalised basis), so a modest rupee dividend divides into a large share price and produces a tiny percentage. Investors have historically bought ABB for earnings growth and quality, not for income. The high “1480%” label is an artefact of the small ₹2 face value and should not be read as a high return.
Dividend History Analysis
| Financial Year (Dec) | Interim (₹) | Final (₹) | Total DPS (₹) | EPS (₹) | Payout |
|---|---|---|---|---|---|
| CY2018 | – | 4.80 | 4.80 | 24.11 | 20% |
| CY2019 | – | 4.80 | 4.80 | 14.32 | 34% |
| CY2020 | – | 5.00 | 5.00 | 10.35 | 48% |
| CY2021 | – | 5.20 | 5.20 | 24.53 | 21% |
| CY2022 | – | 5.50 | 5.50 | 47.96 | 11% |
| CY2023 | 5.50 | 23.80 | 29.30 | 58.61 | 50% |
| CY2024 | 10.66 | 33.50 | 44.16 | 88.33 | 50% |
| CY2025 | 9.77 | 29.59 | 39.36 | 78.73 | 50% |
DPS mapped to the calendar year it relates to (interim paid in August of that year; final declared the following February and paid after the AGM). EPS and payout are standalone. Figures cross-referenced across exchange filings and dividend aggregators.
Classification: Consistent payer with a policy-linked (variable) payout. ABB India has paid a dividend every year for well over a decade with no cuts to zero and no suspensions. From CY2023 it moved to an explicit ~50% payout policy, which caused the rupee dividend to jump sharply (from ₹5.50 in CY2022 to ₹29.30 in CY2023). The flip side of a fixed-percentage policy is that the absolute dividend rises and falls with earnings — which is exactly why the CY2025 total (₹39.36) is lower than CY2024 (₹44.16). Investors should not assume the rupee dividend only goes up.
Financial Performance Analysis
| Standalone (₹ Cr) | CY2023 | CY2024 | CY2025 | CY24→CY25 |
|---|---|---|---|---|
| Revenue | 10,447 | 12,188 | 13,203 | +8.3% |
| Operating Profit | 1,497 | 2,311 | 2,045 | −11.5% |
| Operating Margin (OPM) | 14.3% | 19.0% | 15.5% | −3.5 pp |
| Other Income | 289 | 344 | 349 | +1.5% |
| Profit Before Tax | 1,653 | 2,510 | 2,229 | −11.2% |
| Net Profit (PAT) | 1,242 | 1,872 | 1,668 | −10.9% |
| EPS (₹) | 58.61 | 88.33 | 78.73 | −10.9% |
Source: standalone annual financials (Screener.in, cross-checked with quarterly filings). ABB India’s consolidated numbers are near-identical to standalone (the Q4 CY2025 consolidated PAT fell ~18% YoY, matching the standalone quarter).
Operating leverage worked in reverse this year. Revenue grew a healthy 8.3%, but operating profit fell 11.5% and net profit fell 10.9%. The whole gap is margin compression: operating margin dropped from 19.0% to 15.5%. Management and brokerage commentary through CY2025 and into early 2026 attributed this to higher raw-material and commodity costs, rupee depreciation and supply-chain pressure, even as order inflows stayed very strong (Q4 CY2025 order inflows rose ~52% year-on-year). In plain terms: ABB is winning plenty of business, but each rupee of sales converted into less profit this year. Because the dividend follows profit, the payout fell too.
Don’t be misled by the trailing P/E or trailing profit. Some data providers show a trailing-twelve-month profit near ₹2,977 Cr. That figure includes a large one-off other income of about ₹1,541 Cr booked in the March 2026 quarter (with an unusually low ~6% tax rate) — an exceptional item that occurred after this dividend’s financial year. The dividend of ₹29.59 relates to CY2025 core profit of ₹1,668 Cr, not the inflated TTM number. We keep the two strictly separate.
Cash Flow Analysis
| Standalone (₹ Cr) | CY2023 | CY2024 | CY2025 |
|---|---|---|---|
| Operating Cash Flow (OCF) | 1,351 | 1,332 | 1,220 |
| Free Cash Flow (FCF) | 1,168 | 1,118 | 980 |
| OCF ÷ Operating Profit | 90% | 58% | 60% |
| OCF ÷ Net Profit | 109% | 71% | 73% |
Reported profit is an opinion; cash is a fact — and here the two broadly agree. ABB India generated ₹1,220 Cr of operating cash and ₹980 Cr of free cash flow in CY2025. That is real cash, not just accounting profit. However, cash conversion has softened: operating cash flow fell from ₹1,332 Cr to ₹1,220 Cr, and both OCF and FCF are now below net profit (OCF was 73% of PAT in CY2025 versus over 100% back in CY2023). This is partly the lower margins and partly working-capital build-up as the order book grows (debtor days ~88, inventory days ~98).
How is the dividend funded? The full-year dividend outflow of ~₹834 Cr (₹39.36 × 21.19 crore shares) is covered by CY2025 free cash flow of ₹980 Cr about 1.17 times, and by operating cash flow about 1.46 times. The final dividend alone (~₹627 Cr) is covered by FCF about 1.56 times. So the payout is being funded out of current-year cash generation — not by selling assets or by borrowing (the company is virtually debt-free). The caution: FCF cover on the full payout is only modestly above 1x, so in a weaker cash year the buffer is thin.
Balance Sheet Strength
Borrowings (CY2025)
~₹85 Cr
Effectively debt-free (net cash)
Net Worth (CY2025)
~₹7,836 Cr
Reserves ₹7,794 Cr + equity capital ₹42 Cr
Return on Equity (ROE)
~22.4%
Return on Capital Employed (ROCE)
~30%
ABB India carries an exceptionally strong balance sheet: borrowings of only ~₹85 Cr against a net worth of nearly ₹7,836 Cr, and returns on capital (ROCE ~30%, ROE ~22%) that are well above the capital-goods sector average. The company holds a substantial cash and liquid-investment pile that comfortably exceeds all borrowings. Not Independently Verified: the exact CY2025 cash-and-investments quantum is not stated in the dividend filing and should be confirmed against the CY2025 Annual Report before publication; on the balance-sheet structure alone, however, ABB India is clearly a net-cash company, so the dividend poses no solvency concern.
Dividend Sustainability Analysis
Earnings Coverage
2.66x (final) / 2.0x (full-year)
EPS ₹78.73 vs DPS ₹29.59 / ₹39.36
FCF Coverage
1.56x (final) / 1.17x (full-year)
FCF ₹980 Cr vs outflow ₹627 Cr / ₹834 Cr
Balance Sheet
Debt-free, net cash
Earnings Trend
Down this year (−11%)
Multi-year trend still strongly up
On every affordability test — earnings cover of 2x+, positive free-cash-flow cover, a debt-free balance sheet and a huge cash buffer — the dividend is clearly affordable and sustainable. The nuance for retail readers is that ABB pays a fixed ~50% of profit, so the rupee amount will keep moving with earnings. CY2025 already showed this: profit fell, so the dividend fell. If margins recover, the dividend can rise again; if pressure continues, expect a flat-to-lower rupee payout even though the company remains financially rock-solid. Sustainable is not the same as ever-rising.
Peer Comparison
| Company | Div. Yield | Payout | ROE | ROCE | Debt |
|---|---|---|---|---|---|
| ABB India | ~0.53% | 50% | ~22.4% | ~30% | Debt-free |
| Siemens Ltd | Not Verified | Not Verified | ~15.8% | Not Verified | Low |
| Cummins India | Not Verified | Not Verified | ~30.9% | Not Verified | Low |
| GE Vernova T&D India / Hitachi Energy | Not Verified | Not Verified | Not Verified | Not Verified | Low |
Cells marked “Not Verified” are deliberately left unpopulated rather than filled with unconfirmed aggregator data. Peer ROE figures where shown are indicative and should be re-checked against the latest results before publication.
Across the listed electrical-equipment / capital-goods peers, none is a high-yield dividend play — the whole sector trades at rich valuations, so dividend yields sit well below 1%. On quality metrics (ROE, ROCE, debt-free status), ABB India screens near the top of the group, comparable to Cummins India on returns and ahead of Siemens on ROE. The investment case for all of them is capital-expenditure-driven growth, not income.
Promoter Impact Analysis
Promoter Holding
75.0%
ABB group (Switzerland), stable at 75%
Promoter Dividend Income
~₹470 Cr
Final only; ~₹626 Cr for the full-year payout
FII Holding (Mar 2026)
8.19%
DII Holding (Mar 2026)
9.28%
Because the ABB parent group owns 75% of the company, three-quarters of every dividend rupee flows to the promoter. Of the ~₹627 Cr final-dividend outflow, roughly ₹470 Cr goes to the ABB group; on the full-year payout, the promoter receives about ₹626 Cr. The remaining ~25% (about ₹157 Cr of the final dividend) is shared by public shareholders, FIIs and domestic institutions. This is normal for a 75%-owned MNC subsidiary, but it is worth understanding that a 50%-payout policy is also an efficient, tax-visible route for the foreign parent to repatriate profit. One structural watch-point: FII holding has drifted down (from ~12% in early 2024 to ~8% now) while DII holding has risen — a change in the institutional mix rather than a promoter action.
Taxation Analysis
Since the FY2020-21 rule change, dividends are taxed in the hands of the investor, not the company. The dividend is added to your total income and taxed at your applicable income-tax slab rate. In addition, the company must deduct TDS at 10% if your total dividend from that company in a financial year exceeds ₹10,000 (the threshold was raised from ₹5,000 with effect from FY2025-26). If you have not linked a valid PAN, TDS is 20%. The TDS is only an advance deduction — your final liability is at your slab, and TDS already paid is adjusted against it.
Worked example — 1,000 shares, final dividend ₹29.59, investor in the 30% slab
- Gross dividend: 1,000 × ₹29.59 = ₹29,590
- TDS at 10% (as gross exceeds ₹10,000): ₹2,959 — deducted at source
- Total tax at 30% slab (plus applicable cess): ₹8,877
- Net dividend in hand after full slab tax: ₹20,713
- Effective post-tax yield at CMP ~₹7,375: about 0.28%
Cess and any surcharge are ignored for simplicity; a 30%-slab investor would pay slightly more. A 0% or 5%-slab investor keeps almost all of the dividend and can reclaim excess TDS by filing a return.
Key Risks
- Margin pressure. CY2025 operating margin fell from 19.0% to 15.5% on commodity inflation, a weaker rupee and supply-chain costs. If input costs stay elevated, profit — and therefore the rupee dividend — stays under pressure.
- Earnings-linked (variable) dividend. With a fixed ~50% payout, the absolute dividend falls in weak years. CY2025 already fell ~11% versus CY2024. This is not a predictable, always-growing income stream.
- Very high valuation, very low yield. At a P/E in the 50s and a yield under 0.5%, the stock offers little income cushion. A de-rating would hurt total returns far more than the dividend helps.
- Cyclicality of the order book. Demand is tied to industrial and infrastructure capex (data centres, railways, metals). A capex slowdown would hit both revenue and future dividends.
- Concentrated ownership and related-party dependence. The 75% ABB parent stake, royalty payments to the parent and reliance on group technology mean minority shareholders have limited influence over payout and capital-allocation decisions.
- Softening cash conversion. Operating cash flow has slipped below net profit (73% of PAT in CY2025) as working capital builds with the order book; sustained weakness would thin the free-cash-flow cushion behind the dividend.
What To Monitor
- Quarterly operating margin. Watch whether OPM recovers back toward the 18–19% range or stays compressed near 15%. This is the single biggest driver of future dividends.
- Order inflows and backlog. Q4 CY2025 inflows rose ~52% YoY; track whether the data-centre, railways and infrastructure momentum continues and how much of the backlog is executable at healthy margins.
- Free cash flow and cash conversion. Monitor whether OCF/PAT climbs back above 90% and whether FCF comfortably exceeds the ~₹800–850 Cr annual dividend outflow.
- Interim dividend pattern. ABB now typically pays an August interim plus a February-recommended final; note the June 2026 board intimation flagged a possible interim — watch the CY2026 rhythm.
- Working capital (debtor and inventory days). Rising receivables or inventory relative to sales would signal cash getting locked up as the order book grows.
- Institutional ownership shifts. FII holding has fallen to ~8%; a continued exit or a reversal is a useful sentiment signal for this richly valued stock.
Conclusion
ABB India’s ₹29.59 final dividend is a financially comfortable payout from a debt-free, high-return business — covered 2.66 times by earnings and 1.56 times by free cash flow, funded entirely from current-year cash. The important, non-obvious point for readers is that the “1480%” headline and the impressive rupee figure hide two realities: the dividend was actually cut about 12% year-on-year, and the yield is under 0.5%. That is because CY2025 profit fell 11% on margin compression even though revenue rose 8%, and ABB pays a fixed ~50% of profit.
Positives: debt-free balance sheet, ROCE ~30%, strong order inflows, consistent multi-year dividend record, ample coverage. Negatives / watch-points: margin pressure, an earnings-linked (falling) rupee dividend, very high valuation, negligible yield, softening cash conversion and 75% promoter ownership. ABB India remains a quality industrial franchise; as a dividend proposition it is about balance-sheet safety and policy discipline, not income. We present the facts and let you decide.
Frequently Asked Questions
What dividend has ABB India announced for FY2025?
What is the dividend yield on ABB India?
What was the record date for the ABB India dividend?
What was the ex-date?
When was the dividend paid?
Who was eligible to receive it?
How is this dividend taxed?
Is ABB India’s dividend sustainable?
Why did the dividend fall versus last year?
What is ABB India’s dividend history like?
How much of the dividend goes to the promoter?
Should I buy ABB India for its dividend?
What should investors monitor going forward?
Disclaimer
This article is for informational and educational purposes only and does not constitute investment, financial, legal or tax advice, nor any recommendation to buy, sell or hold any security. ShareBazaar Online is not a SEBI-registered investment adviser. Event facts (dividend amount, dates, share count) are taken from ABB India Limited’s SEBI LODR Regulation 30 disclosure dated 19 February 2026; financial data and market prices are compiled from public sources including exchange filings and Screener.in and may contain errors or become outdated. The current market price must be verified against live NSE/BSE data before acting. Some items (notably the ex-date and the exact cash balance) are inferred or not independently verified, as flagged in the text. Dividends are subject to shareholder approval and statutory deductions. Please do your own research and consult a qualified, SEBI-registered adviser before making any investment decision. Investments in securities are subject to market risks.