
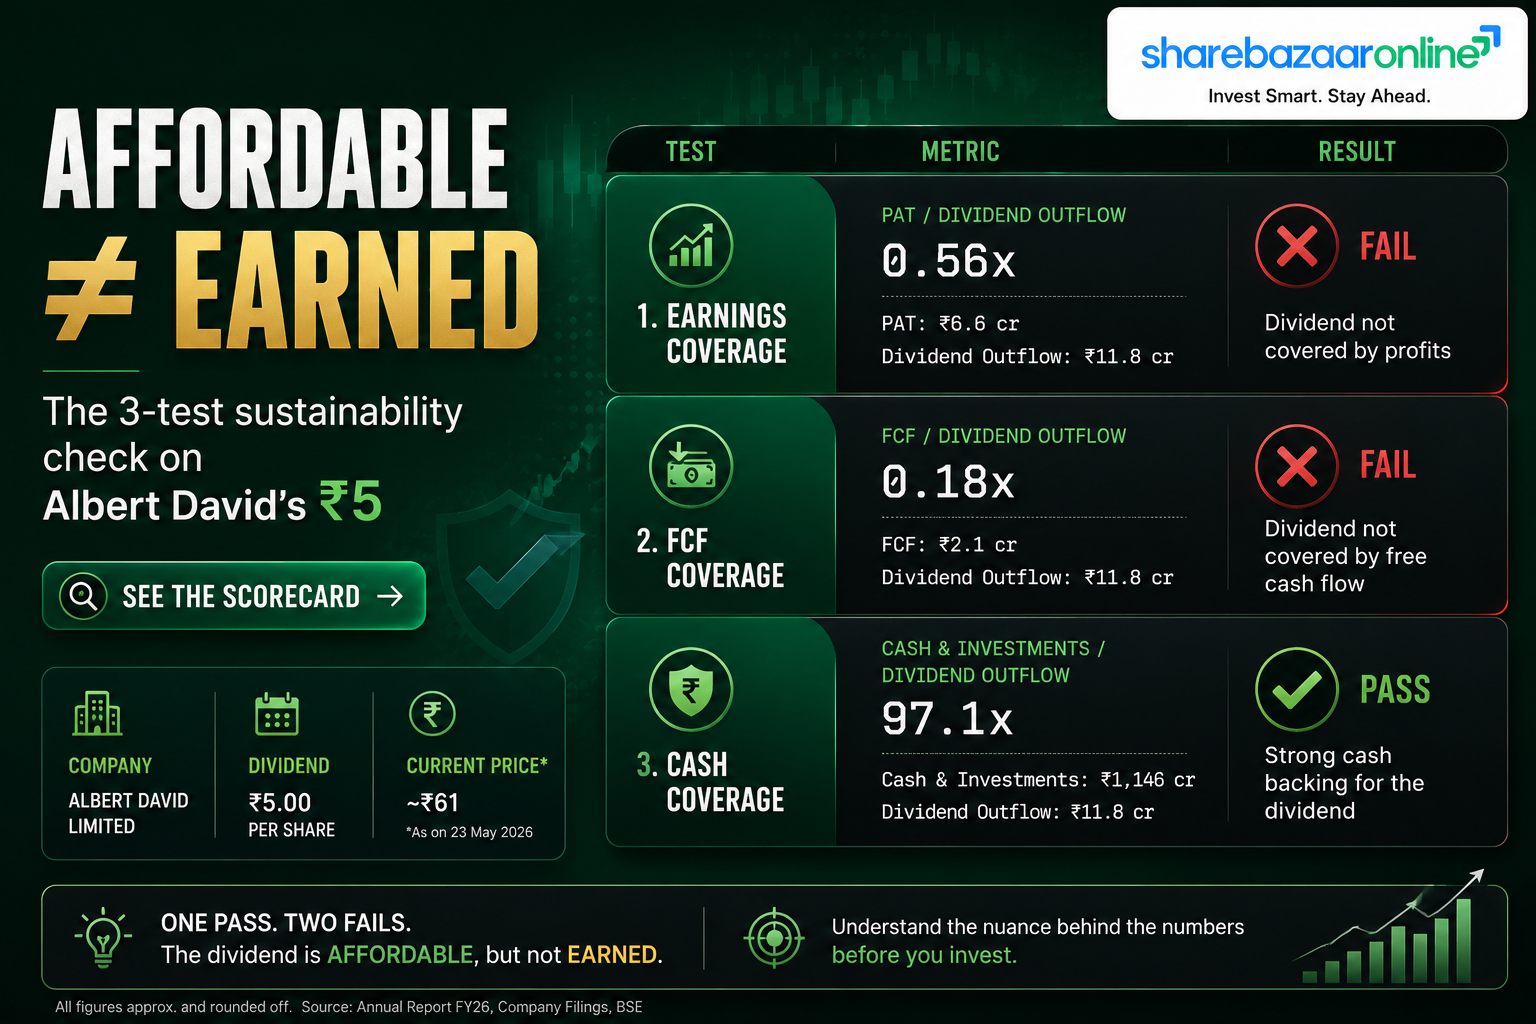
Dividend Snapshot
The one-line story: Albert David has kept its final dividend flat at ₹5.00 per share for FY26 — but it is doing so in a year when the company reported a net loss of ₹1.49 crore, negative operating cash flow of ₹7.66 crore and negative free cash flow of about ₹36.8 crore. The payout is comfortably affordable only because the company sits on a ₹276 crore cash-and-investment pile. This is a dividend funded by the balance sheet, not by the year's earnings.
Dividend Announcement Summary
At its board meeting on 12 May 2026, the Board of Albert David Limited recommended a final dividend of ₹5.00 per equity share (50% of the ₹10 face value) for the financial year ended 31 March 2026. The recommendation is subject to shareholder approval at the company's 87th Annual General Meeting, scheduled for 6 August 2026 via video conferencing.
The same board meeting also saw the appointment of Mr. Amit Mahla as Chief Executive Officer with effect from 12 May 2026, following the earlier resignation of Mr. Umesh Manohar Kunte as MD & CEO in December 2025. A leadership transition alongside a loss-making year is worth flagging for readers assessing near-term direction, even though it does not directly change the dividend mechanics.
The register of members and share transfer books will remain closed from 31 July 2026 to 6 August 2026 (both days inclusive). The statutory auditors, L. B. Jha & Co. LLP, issued an unmodified (clean) audit opinion on the FY26 results — there are no audit qualifications on the numbers discussed below.
Key Dates Timeline
Announcement
12 May 2026
Board recommends ₹5 final dividend (Regulation 30 outcome).
Record Date
30 July 2026
Shareholders on the register today are eligible (company-disclosed).
Ex-Date
30 July 2026 (inferred)
Under T+1 settlement the ex-date and record date coincide. This is inferred from settlement logic, not separately stated by the company.
AGM
6 August 2026
87th AGM — dividend must be approved here to become payable.
Payment Date
Not Disclosed by Company
By law a final dividend must be paid within 30 days of approval at the AGM — i.e. on or before roughly 4–5 September 2026. In the last two years the company paid its final dividend in early September (1 Sep 2025 and 8 Sep 2024). This window is inferred from the statutory outer limit and history; it is not a company-confirmed date.
Dividend Yield Analysis
Dividend Yield (at ~₹710 reference price)
~0.70%
₹5.00 ÷ ₹710. Verify against live NSE/BSE price before publishing.
Post-tax yield (30% slab investor)
~0.49%
Dividends are taxed at the investor's slab rate in India.
Yield reality check
A ~0.70% yield is low — well below the healthcare sector average dividend yield of roughly 1.66% (source: TipRanks sector data). Importantly, this is not a case of yield being flattered by a falling price. Although the stock is down around 12% over the past year, the yield stays modest because the absolute dividend was cut from ₹11.50 (FY24) to ₹5.00 (FY25) and held there. So the low yield reflects a genuinely smaller payout, not a distressed-price signal. Investors buying purely for income should note the yield is thin relative to a bank fixed deposit.
Dividend History Analysis
| Financial Year | Dividend / Share | Ex-Date | Type |
|---|---|---|---|
| FY26 (current) | ₹5.00 | 30 Jul 2026 | Final |
| FY25 | ₹5.00 | 25 Jul 2025 | Final |
| FY24 | ₹11.50 | 02 Aug 2024 | Final |
| FY23 | ₹9.00 | 02 Aug 2023 | Final |
| FY22 | ₹9.00 | 01 Aug 2022 | Final |
| FY21 | ₹6.00 | 06 Sep 2021 | Final |
| FY20 | ₹7.00 | 13 Mar 2020 | Interim/Special |
| FY19 | ₹6.00 | 01 Aug 2019 | Final |
| FY18 | ₹5.50 | 24 Aug 2018 | Final |
| FY17 | ₹5.50 | 01 Sep 2017 | Final |
Source: TipRanks / exchange corporate-action records. Cross-verify individual years against BSE/NSE before publication.
Classification: Consistent Payer, but variable
Albert David has paid a dividend every year for at least a decade — that consistency is real and a genuine positive. But the amount is not stable: it climbed from ₹5.50 to a peak of ₹11.50 in FY24, then was more than halved to ₹5.00 in FY25 and kept flat in FY26.
The ₹11.50 → ₹5.00 cut matters
The FY24 ₹11.50 payout was funded in a strong-profit year (₹17–75 crore range). As earnings weakened through FY25 and turned negative in FY26, the board reset the dividend lower and has defended that lower level rather than borrowing to sustain the old rate. Readers should treat ₹5.00 as the "maintainable in a weak year" level, not a growth trajectory.
Financial Performance Analysis (FY26 vs FY25)
| Metric (₹ Crore) | FY26 | FY25 | Change |
|---|---|---|---|
| Revenue from operations | 333.60 | 345.77 | −3.5% |
| Other income | 7.45 | 29.58 | −74.8% |
| Total income | 341.05 | 375.35 | −9.1% |
| Finance cost | 2.63 | 0.41 | +541% |
| Depreciation | 9.76 | 6.97 | +40% |
| Profit before tax | 0.52 | 25.23 | −97.9% |
| Net profit / (loss) | (1.49) | 17.20 | Loss |
| Basic EPS (₹) | (2.62) | 30.14 | Loss |
Why did profit collapse when revenue only fell 3.5%? — the non-obvious answer
Most wire reports will simply say "Albert David swung to a loss." The real driver is not the core pharma business — it is the investment book. Albert David holds about ₹276 crore in cash and market investments, and the mark-to-market movement on that portfolio flows straight through the profit-and-loss account. In FY25 those investments delivered a fair-value gain of roughly ₹19.8 crore; in FY26 they swung to a fair-value loss of about ₹3.9 crore. That single reversal — visible in the collapse of "other income" from ₹29.58 crore to ₹7.45 crore — explains the bulk of the profit swing. The March-2026 quarter alone carried a negative other-income line of ₹24.84 crore, which is what pushed Q4 to a ₹21.4 crore loss.
The flip side: the core business actually stabilised late in the year
In the fourth quarter, revenue from operations rose to ₹85.86 crore, a +14.65% year-on-year increase. So while the full-year headline is a loss, the underlying pharmaceutical sales showed signs of recovery in the final quarter even as the accounting result was dragged down by investment mark-downs and higher finance and depreciation charges. Both facts are true and readers deserve both.
Cash Flow Analysis
Operating Cash Flow (FY26)
−₹7.66 Cr
FY25: −₹28.44 Cr. Negative for a second straight year.
Free Cash Flow (OCF − Capex)
−₹36.77 Cr
Capex of ₹29.1 Cr on top of negative operating cash.
Reported profit is an opinion; cash is a fact — and the cash is negative
Even setting aside the loss, the company generated negative ₹7.66 crore of operating cash in FY26. A big reason is working capital: trade receivables rose about 24% to ₹33.92 crore even as revenue fell 3.5% — meaning the company is collecting from customers more slowly than it is selling. After ₹29.1 crore of capital expenditure (largely capital work-in-progress, which more than doubled to ₹20.77 crore), free cash flow was deeply negative at about −₹36.8 crore.
So how is the dividend being paid?
Not from current earnings and not from free cash flow. During FY26 the company actually raised ₹18.43 crore of fresh short-term borrowings (net) and its total current borrowings rose to ₹28.48 crore. The ₹2.86 crore dividend paid during the year (the FY25 dividend) and the upcoming ₹2.85 crore FY26 payout are ultimately being met from the company's large accumulated cash-and-investment reserves. This is affordable — but it is a return of capital from the balance sheet in a weak year, not a distribution of freshly generated profit.
Balance Sheet Strength
Cash + Investments
₹276.06 Cr
Current ₹225.05 Cr + non-current ₹18.23 Cr investments + ₹32.77 Cr cash & bank.
Net Cash Position
+₹246.5 Cr
Total debt (borrowings + leases) only ₹29.58 Cr.
Net Worth (Total Equity)
₹391.54 Cr
Book value ~₹686 per share.
Price-to-Book
~1.0x
The stock trades close to its book value.
This is the crux of the whole story: Albert David is a fortress balance sheet attached to a currently sub-scale operating business. The ₹276 crore investment-and-cash pile is more than two-thirds of the entire market capitalisation of roughly ₹405 crore. That cash makes the small ₹2.85 crore dividend trivially affordable — cash covers it about 97 times over — but it also means the operating business is being valued very modestly by the market once you strip the cash out. Debt is minimal, so there is no solvency concern.
Dividend Sustainability Analysis
Verdict
Sustainable (balance-sheet funded), but NOT earnings-covered
Earnings coverage: −0.52x (fails)
EPS of −₹2.62 against a ₹5.00 dividend. Current-year earnings do not cover the payout at all — the company earned a loss.
FCF coverage: negative (fails)
Free cash flow was −₹36.8 crore. The dividend is not covered by cash the business generated this year.
Cash coverage: ~97x (passes strongly)
₹276 crore of cash and investments against a ₹2.85 crore outflow. The reserves can fund this dividend for decades.
Balance-sheet strength: passes
Net cash of ₹246 crore, negligible debt. No financial-distress risk to the payout.
The honest read: this dividend is safe in the sense that the company can easily afford it, but it is not "high quality" in the sense that it is not being earned by the operating business right now. The board already demonstrated it will cut when needed (FY24 ₹11.50 → FY25 ₹5.00). If operating performance keeps deteriorating, a further reset to the dividend cannot be ruled out — the balance sheet gives flexibility, not a guarantee.
Peer Comparison
| Company | Div Yield | ROE | ROCE | Net cash / debt |
|---|---|---|---|---|
| Albert David | ~0.70% | Negative (FY26 loss) | Not Independently Verified | Net cash ₹246 Cr |
| FDC Ltd | ~1.2% | Not Independently Verified | Not Independently Verified | Cash-rich, low debt |
| Indoco Remedies | ~0.1–0.55% | ~14.8%* | ~17.4%* | D/E ~0.46 |
| Healthcare sector avg | ~1.66% | — | — | — |
Sources: TipRanks, FDC/Indoco public data. *Indoco ROE/ROCE are pre-downturn figures and Indoco is currently loss-making on a trailing basis. Blank cells are left as "Not Independently Verified" rather than estimated. Confirm all peer figures before publication.
Against peers, Albert David is a below-average yielder in a sector that itself is not known for generous dividends. What sets it apart is not the payout but the extraordinary cash cushion relative to its size — a feature most listed small-cap pharma names do not share. Direct like-for-like peers are hard to pin down because Albert David is unusually small, unusually cash-heavy, and part-investment-holding in character.
Promoter Impact Analysis
Promoter Holding (Mar 2026)
62.2%
Kothari group; largest single holder Kothari Investment & Industries ~41.4%. No pledge.
Promoter's share of the dividend
~₹1.78 Cr
62.2% of the ₹2.85 Cr total outflow.
With FII holding just 0.58% and DII about 1.6% (mainly General Insurance Corporation), the register is dominated by promoters. Of the ₹2.85 crore total dividend, roughly ₹1.78 crore flows to the Kothari promoter group and about ₹1.07 crore to public and institutional minority shareholders. Because the payout is modest and the amount is small in absolute terms, this is not a case of a large cash extraction — but it is worth flagging that in a loss-making year the controlling family is the primary recipient of a balance-sheet-funded distribution.
Taxation Analysis
Since April 2020, dividends in India are taxed in the hands of the shareholder at their applicable income-tax slab rate (the company no longer pays Dividend Distribution Tax). The company must deduct TDS at 10% under Section 194 if a resident shareholder's total dividend from the company in a financial year exceeds ₹5,000 (for those without a valid PAN, TDS is higher at 20%). The TDS is not an extra cost — it is adjusted against the shareholder's final tax liability.
Worked example A — generic (1,000 shares, ₹10/share, 30% slab)
- Gross dividend: ₹10,000
- TDS @10% (exceeds ₹5,000): ₹1,000
- Tax @30% slab: ₹3,000
- Net dividend after final tax: ₹7,000
Worked example B — Albert David (1,000 shares @ ₹5)
- Gross dividend: ₹5,000
- TDS @10%: ₹0 (does not exceed the ₹5,000 threshold)
- Tax @30% slab: ₹1,500
- Net after tax: ₹3,500 — an effective post-tax yield of ~0.49%
This is a simplified illustration, not tax advice. Surcharge and cess may apply for higher-income investors, and thresholds/rates can change. Consult a qualified tax professional.
Key Risks
1. Earnings dependence on the investment book
A large share of reported profit comes from mark-to-market on a ₹276 crore portfolio, making earnings volatile and only loosely tied to the pharma business. A weak market year can produce a headline loss even if operations are fine.
2. Negative operating and free cash flow
Operating cash flow has been negative for two consecutive years and FY26 free cash flow was about −₹36.8 crore. Sustained cash burn, if it continues, erodes the very reserves funding the dividend.
3. Working-capital stretch
Receivables rose ~24% while revenue fell, and short-term borrowings increased. Slower collections tie up cash and can pressure margins.
4. Dividend-cut precedent
The board halved the dividend from ₹11.50 to ₹5.00 within one year. It has shown willingness to cut, so income investors cannot assume the ₹5.00 is permanent.
5. Leadership transition
A new CEO joined in May 2026 after the previous MD & CEO resigned in December 2025. Strategy and turnaround execution under new leadership are unproven.
6. Low liquidity / small float
With ~62% promoter holding and very thin trading volumes, the stock can be illiquid and price-volatile, which affects the reliability of the quoted yield.
What To Monitor
1. Operating cash flow turning positive
The single most important signal — whether the core business can start funding itself again in FY27.
2. Core revenue trend after the Q4 rebound
Q4 FY26 sales grew ~14.65% YoY; watch whether that recovery holds across FY27 quarters.
3. Operating margin ex-investment income
Strip out other income to see if the pharma business is genuinely profitable at the operating level.
4. Receivable days and working capital
Whether the ~24% jump in receivables reverses or becomes a structural cash drain.
5. Capex payoff from rising CWIP
Capital work-in-progress more than doubled; watch whether this new capacity translates into revenue and returns.
6. Next year's dividend decision
Whether the board holds, raises or trims the ₹5.00 — the clearest statement of its own confidence.
Conclusion
Albert David's FY26 final dividend of ₹5.00 per share is a study in the difference between a dividend being affordable and a dividend being earned. It is unquestionably affordable: a ₹276 crore cash-and-investment war chest covers the ₹2.85 crore outflow roughly 97 times over, and debt is negligible. But it is not earned by this year's operations — the company posted a net loss, negative operating cash flow and deeply negative free cash flow, and topped up short-term borrowings during the year.
Look past the headline loss and the picture is more nuanced: much of the red ink is investment mark-to-market swinging against the company, while core pharma sales actually grew in the March quarter. The balance sheet is genuinely strong; the operating business is genuinely sub-scale right now; and a new CEO has just taken charge. Income-focused readers get a modest, well-covered-by-cash but low-quality yield of about 0.70%. Value-focused readers get a stock trading near book value with two-thirds of its market cap in cash. Neither picture is a recommendation — the positives, negatives and risks are laid out so you can weigh them yourself.
Frequently Asked Questions
What dividend has Albert David announced for FY26?
What is the dividend yield?
What is the record date for the Albert David dividend?
What is the ex-date?
When will the dividend be paid?
Who is eligible for this dividend?
How is this dividend taxed?
Is the Albert David dividend sustainable?
Why did Albert David report a loss but still pay a dividend?
What is the dividend history of Albert David?
How does Albert David's yield compare with peers?
How much of the dividend goes to promoters?
Does Albert David have debt problems?
What should investors monitor from here?
Disclaimer
This article is for informational and educational purposes only and does not constitute investment, financial, legal or tax advice, nor a recommendation to buy, sell or hold any security. Figures relating to dividend, record date and financial results are drawn from Albert David Limited's exchange filing dated 12 May 2026 and its audited FY26 results; market data (share price, yield, shareholding, peer figures) is sourced from third-party providers and must be independently verified against live NSE/BSE data before any decision. The ex-date and payment date are inferred and not confirmed by the company. ShareBazaar Online and its authors are not liable for any loss arising from the use of this information. Please consult a SEBI-registered investment adviser and a qualified tax professional before investing. Investments in securities are subject to market risks.