
Dividend Snapshot
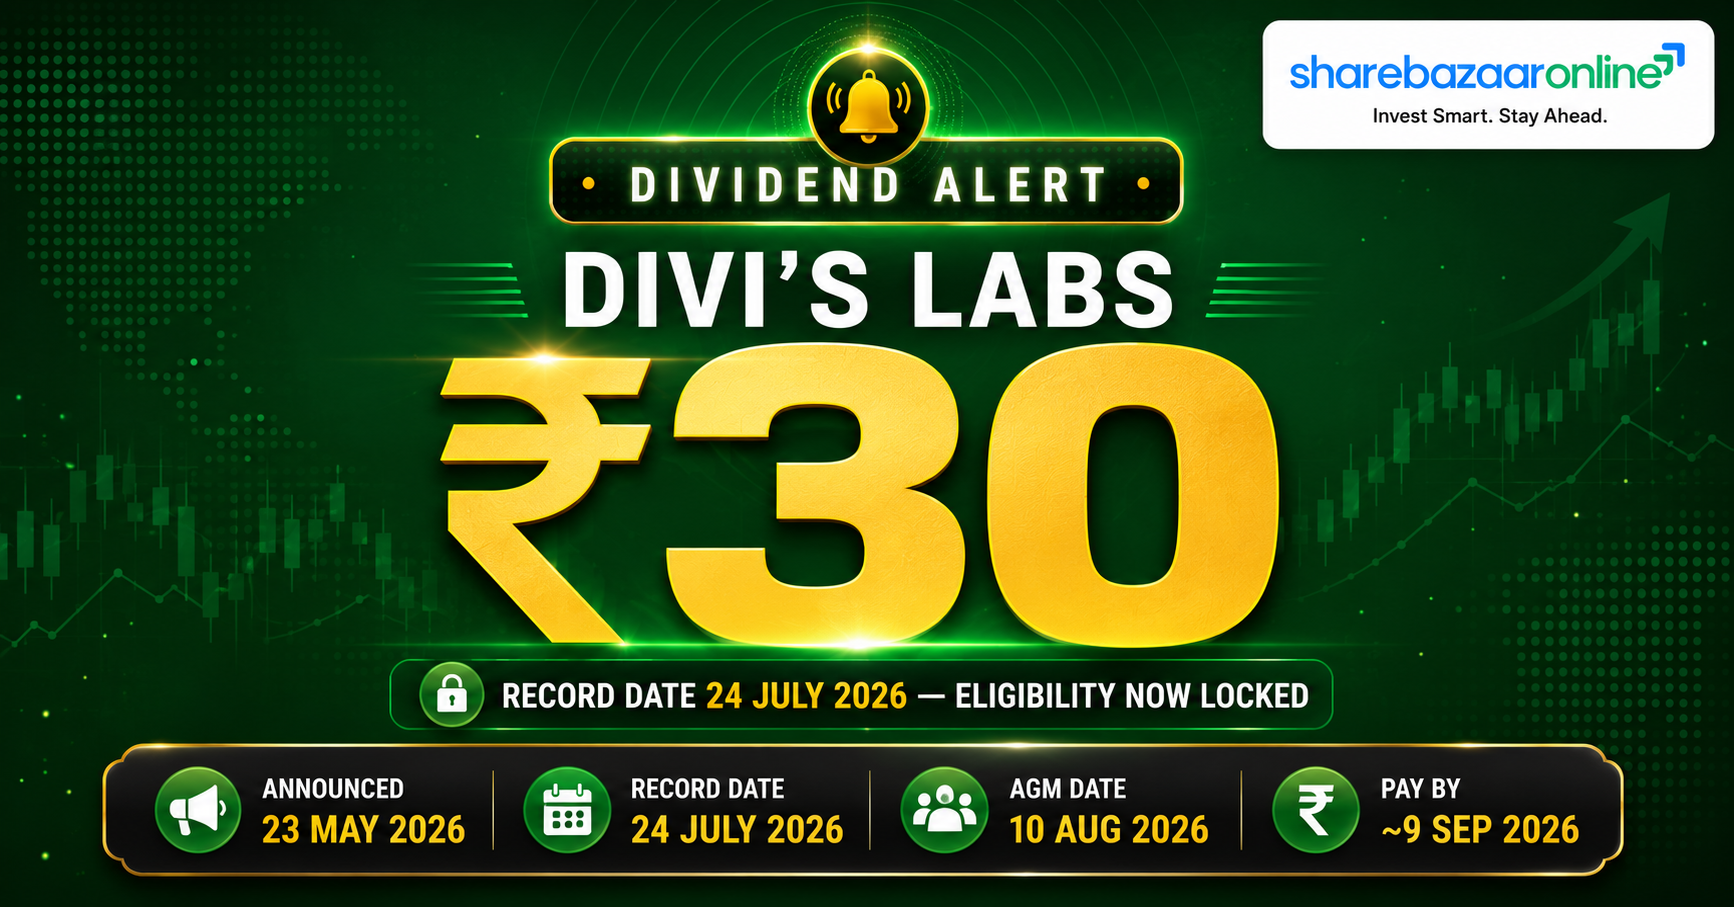
Dividend Per Share
₹30.00
1,500% on ₹2 face value
Dividend Yield
~0.40%
At CMP ₹7,425 (verify live price)
Dividend Type
Final Dividend
Annual payer • Consistent
Record Date
24 Jul 2026
Eligibility locked
Estimated Payout Outflow
~₹796 Cr
On ~26.55 crore shares
Payout Ratio (Consolidated)
~31%
Of FY26 PAT of ₹2,568 Cr
Dividend Announcement Summary
At its board meeting held on 23 May 2026, the Board of Directors of Divi's Laboratories Limited recommended a final dividend of ₹30 per equity share of face value ₹2 each — equal to 1,500% — for the financial year ended 31 March 2026. The dividend is subject to shareholder approval at the ensuing 36th Annual General Meeting.
What was declared
A single annual final dividend of ₹30/share. Divi's does not typically declare interim dividends, so this is the full FY26 payout — identical in rupee terms to the last four years.
Why it matters
FY26 profit rose 17.2% yet the dividend stayed flat at ₹30. That means the effective payout ratio has quietly fallen from ~36% to ~31%, with the company retaining more cash for its heavy capacity-expansion cycle.
Key Dates Timeline
Announcement / Board Meeting
Board recommends ₹30 final dividend (Regulation 30 disclosure).
Record Date & Ex-Date
Company-disclosed record date. Under India's T+1 settlement, the ex-date aligns with the record date — shares must have been bought on or before 23 Jul 2026 to qualify. Ex-date inferred from T+1 logic; confirm on NSE/BSE.
36th Annual General Meeting
Shareholders vote to approve the dividend.
Payment Date (Estimated)
Not disclosed by company — the filing says "within specified timelines from the conclusion of the AGM." The statutory outer limit is 30 days from AGM approval. Last year the dividend was credited within ~6 days of the AGM. Payment date derived from statutory limit, not a company disclosure.
Dividend Yield Analysis
Yield at Announcement
~0.44%
₹30 ÷ ₹6,885 (NSE close, 22 May 2026)
Yield at Latest Price
~0.40%
₹30 ÷ ₹7,425 (NSE close, 28 Jul 2026)
Yield reality check
A yield of roughly 0.40% is very low — well below the healthcare sector average of around 1.8%. Crucially, this is not because the dividend is weak. It is because the stock trades at a premium valuation (P/E near 76 and about 11.8x book value). Divi's is a growth-and-quality stock, not an income stock: shareholders are paid mostly through capital appreciation, with the dividend a small top-up. Anyone buying purely for dividend income would find the yield far too thin.
Dividend History Analysis
| Financial Year | Dividend / Share | % on FV ₹2 | Type |
|---|---|---|---|
| FY2025-26 | ₹30.00 | 1,500% | Final (current) |
| FY2024-25 | ₹30.00 | 1,500% | Final |
| FY2023-24 | ₹30.00 | 1,500% | Final |
| FY2022-23 | ₹30.00 | 1,500% | Final |
| FY2021-22 | ₹30.00 | 1,500% | Final |
| FY2020-21 | ₹20.00 | 1,000% | Final |
| FY2019-20 | ₹16.00 | 800% | Interim |
| FY2018-19 | ₹16.00 | 800% | Final |
| FY2017-18 | ₹10.00 | 500% | Final |
| FY2016-17 | ₹10.00 | 500% | Final |
Face value has been ₹2 throughout, so per-share figures are directly comparable (no split/bonus adjustment needed). Source: exchange dividend records & corporate-action histories; some prior-year figures not independently re-verified against original filings.
Classification: Consistent Payer
Divi's has paid an uninterrupted, uncut dividend every year for well over a decade, roughly tripling the per-share payout from ₹10 to ₹30 over the last 10 years. There are no suspensions or cuts on record.
The plateau to watch
The rupee dividend has been frozen at ₹30 for five straight years (FY22-FY26) even as profits kept growing. The growth phase of the dividend appears to have paused while the company channels cash into capacity.
Financial Performance Analysis
Consolidated results (₹ Crore)
| Metric | FY26 | FY25 | Growth |
|---|---|---|---|
| Revenue from operations | 10,560 | 9,360 | +12.8% |
| Total income | 11,067 | 9,712 | +14.0% |
| Profit before tax (reported) | 3,388 | 2,916 | +16.2% |
| PBT before exceptional item | 3,462 | 2,916 | +18.7% |
| Net profit (PAT) | 2,568 | 2,191 | +17.2% |
| EPS (Basic & Diluted) | ₹96.75 | ₹82.53 | +17.2% |
Operating leverage: profit outran sales
Revenue rose 12.8% but PAT rose a faster 17.2%, and pre-exceptional PBT grew 18.7%. Positive operating leverage is at work — costs grew slower than sales (total expenses up ~11.9% to ₹7,605 Cr), lifting margins. This is the opposite of the "sales up, profit down" red flag.
One-off that dented reported PBT
A ₹74 Cr exceptional charge for the new Labour Codes (higher provisioning on the revised wage definition) held reported PBT growth to 16.2%. Strip it out and the underlying business grew 18.7%. The effective tax rate was a normal ~24.2%.
Standalone vs consolidated
Interestingly, standalone PAT (₹2,607 Cr) is higher than consolidated PAT (₹2,568 Cr). The two overseas subsidiaries — Divis Laboratories (USA) Inc and Divi's Laboratories Europe AG — are a small drag of about ₹39 Cr on the group. This is a marketing/distribution structure, so the divergence is modest and not a concern.
Cash Flow Analysis
Operating Cash Flow (FY26)
₹2,738 Cr
vs PAT of ₹2,568 Cr — OCF exceeds profit (healthy cash conversion of ~107%)
Free Cash Flow (FY26)
~₹218 Cr
OCF ₹2,738 Cr − capex ₹2,520 Cr — thin, because of a capex-heavy year
The most important finding wire services miss: how the dividend is actually funded
Reported profit is an opinion; cash is a fact. On that test Divi's passes at the operating level — operating cash flow of ₹2,738 Cr comfortably exceeds net profit of ₹2,568 Cr, so earnings are genuinely converting into cash. But free cash flow was only ~₹218 Cr because the company spent a near-record ₹2,520 Cr on capex in FY26 (up ~75% from ₹1,438 Cr the year before) as it builds new capacity, including for the emerging peptide / GLP-1 opportunity.
The consequence: this year's ~₹796 Cr dividend is not covered by current-year free cash flow (coverage of just 0.27x). It is being funded partly from the company's large cash and bank reserves rather than from surplus cash generated in the year. This is a capex-cycle timing effect, not an earnings problem — OCF alone covers the dividend 3.4x, the balance sheet is debt-free, and reserves are ample. Investors should simply be aware that FCF cover will stay tight until the current expansion wave normalises.
Receivables and working capital
Trade receivables rose to ₹2,984 Cr and inventories to ₹3,954 Cr, with working-capital build absorbing cash during the year. Receivable growth broadly tracked the 12.8% revenue growth rather than sprinting ahead of it, so there is no obvious sign of aggressive revenue recognition — though the high working-capital intensity is a structural feature of Divi's business worth monitoring.
Balance Sheet Strength
Total Equity
₹16,761 Cr
Book value ~₹631/share
Total Borrowings
Nil
Effectively debt-free (prior year had just ₹2 Cr)
Cash + Bank Balances
~₹3,414 Cr
₹128 Cr cash + ₹3,286 Cr bank deposits
Dividend vs Liquidity
4.3x cover
Cash & deposits cover the ₹796 Cr payout 4.3 times
The balance sheet is a fortress: zero debt, ₹16,761 Cr of equity, and roughly ₹3,414 Cr of cash and bank deposits. Even after a ₹2,520 Cr capex year, the company can pay its dividend several times over from liquidity alone. The only mild caveat is high working-capital intensity (large inventory and receivable balances typical of an API manufacturer).
Dividend Sustainability Analysis
Verdict
Sustainable
The ₹30 dividend clears every test except one-year FCF cover — and that single miss is explained entirely by an elevated capex cycle, not by weak earnings or a stretched balance sheet.
| Test | Reading | Assessment |
|---|---|---|
| Earnings coverage (EPS/DPS) | 3.23x | Strong |
| OCF coverage | 3.44x | Strong |
| FCF coverage (FY26) | 0.27x | Weak (capex year) |
| Cash & deposits coverage | 4.29x | Strong |
| Payout ratio | ~31% | Comfortable |
| Debt position | Debt-free | Strong |
Peer Comparison
| Company | Div/Share | Approx Yield | Payout | ROE | ROCE | Promoter |
|---|---|---|---|---|---|---|
| Divi's Laboratories | ₹30 (FV ₹2) | ~0.40% | ~31% | ~15.3% | ~20.4% | 51.9% |
| Dr Reddy's Labs | ₹8 (FV ₹5) | — | ~13% | — | — | 26.6% |
| Sun Pharma | — | — | ~34% | — | — | — |
| Laurus Labs | ₹2.40 (FV ₹2) | ~0.20% | ~14-18% | — | — | — |
Blank cells = figure not independently verified from a primary source at time of writing (left blank rather than estimated). Face values differ across companies, so absolute dividend per share is not directly comparable — yield and payout ratio are the fair basis. Source: exchange filings and financial aggregators.
Read-through
Across the API / pharma peer set, yields are uniformly low (0.2-0.5%) — this is a growth-oriented sector, not a dividend sector. Divi's stands out for its debt-free balance sheet, high promoter ownership (~52%) and superior ROCE (~20%), balanced against the most premium valuation. Its ~31% payout sits in the middle of the peer range.
Promoter Impact Analysis
Promoter Holding
~51.9%
FII ~20% • DII ~19% • Public ~9% (Jun 2026)
Estimated Promoter Dividend Income
~₹413 Cr
51.9% of the ~₹796 Cr total payout
Because the promoter family (the Divi family) owns roughly 52% of the company, a little over half of every rupee distributed — about ₹413 Cr — flows to promoters. The remaining ~₹383 Cr goes to public shareholders, FIIs and domestic institutions. The dividend is paid uniformly per share, so minority and promoter shareholders are treated identically on a per-share basis; there is no preferential distribution. High promoter ownership also tends to align management incentives with dividend continuity.
Taxation Analysis
How dividends are taxed in India (post-2020 rules)
Since April 2020, dividends are taxed in the hands of the investor at their applicable income-tax slab rate — there is no separate Dividend Distribution Tax. The company deducts TDS at 10% if your total dividend from that company in a financial year exceeds ₹5,000 (higher TDS applies if PAN is not provided). This TDS is adjustable against your final tax liability when you file your return.
Worked example — investor holding 1,000 shares
| Shares held | 1,000 |
| Dividend per share | ₹30 |
| Gross dividend | ₹30,000 |
| TDS deducted at source (10%) | ₹3,000 |
| Amount credited to bank | ₹27,000 |
| Final tax if in 30% slab | ₹9,000 |
| Net dividend after full tax (30% slab) | ₹21,000 |
| Effective post-tax yield (at CMP ₹7,425) | ~0.28% |
For a 30%-slab investor, the ₹3,000 TDS is set off against the ₹9,000 final liability, leaving ₹6,000 payable at filing. Investors in lower slabs pay less; those below the taxable threshold can claim the TDS back as a refund. This is general information, not tax advice — consult a qualified professional for your situation.
Key Risks
1. Capex intensity keeps FCF thin. With ₹2,520 Cr spent in FY26 and a further ₹2,113 Cr of capital work-in-progress on the books, free cash flow will remain tight until new plants ramp. Dividend growth is likely to stay frozen while spending is high.
2. Premium valuation. At a P/E near 76 and ~11.8x book value, the stock prices in years of strong growth. Any earnings disappointment could hurt the share price far more than the small dividend could cushion.
3. Customer and product concentration. As a large generic-API and custom-synthesis supplier, Divi's revenue depends on a limited set of big global pharma customers and a handful of high-volume molecules; loss of any could dent cash generation.
4. Regulatory and quality risk. API manufacturing is subject to US FDA and other global inspections. An adverse observation at a key plant could disrupt exports and earnings.
5. Currency and pricing pressure. A large share of sales is exported, so rupee moves and generic price erosion affect margins — the FY26 forex gain of ₹211 Cr flatters results and may not recur.
6. High working-capital lock-up. Large inventory and receivable balances tie up cash and can pressure returns if the cycle lengthens.
What To Monitor
1. When capex peaks. Watch the capex and capital-work-in-progress lines each quarter. Once spending normalises, free cash flow should rebound — a potential trigger for the dividend to resume growing after five flat years.
2. Peptide / GLP-1 revenue ramp. Management and analysts point to new peptide and GLP-1 opportunities from FY27. Track whether these convert into revenue and margin.
3. Payout ratio trend. A payout that keeps falling (now ~31%) while cash piles up would raise capital-allocation questions — watch for any buyback or special dividend as an alternative.
4. Cash-conversion quality. Keep checking that operating cash flow stays at or above net profit; any sustained gap between reported profit and cash would be an early warning.
5. Margin trajectory. EBITDA and gross margins reveal whether pricing power and operating leverage are holding as the sales mix shifts toward custom synthesis and new molecules.
6. Regulatory scorecard. Outcomes of US FDA and other regulatory inspections at Divi's manufacturing units.
Conclusion
Divi's Laboratories has declared its fifth consecutive ₹30 final dividend, a payout backed by a debt-free balance sheet, ~₹3,400 Cr of cash and deposits, and operating cash flow that comfortably exceeds profit. On earnings, cash and liquidity tests the dividend is clearly sustainable.
The nuance most coverage misses: because FY26 was a heavy investment year (₹2,520 Cr of capex), free cash flow of ~₹218 Cr does not cover the ~₹796 Cr dividend — the shortfall is bridged from reserves. That is a timing feature of the expansion cycle, not a sign of stress. The flip side is that with profits up 17% and the dividend frozen, the payout ratio has drifted down to ~31%, and the yield of ~0.40% is far too low for income-seekers.
Positives: debt-free, strong cash conversion, consistent 10-year dividend record, high ROCE. Negatives / watch-items: thin FCF cover this year, flat dividend for five years, premium valuation, low yield. We present the facts; the decision is yours.
Frequently Asked Questions
What dividend has Divi's Laboratories announced for FY26?
What is the dividend yield?
What is the record date for the Divi's dividend?
What is the ex-date?
When will the dividend be paid?
Who is eligible to receive it?
How is this dividend taxed?
Is the Divi's dividend sustainable?
What is Divi's dividend history?
Why has the dividend stayed at ₹30 for five years despite rising profits?
How much of the dividend goes to promoters?
Is Divi's a good dividend (income) stock?
What should investors monitor going forward?
Does Divi's have any debt affecting the dividend?
Disclaimer
This article is for informational and educational purposes only and does not constitute investment, financial, legal or tax advice, nor any recommendation to buy, sell or hold any security. Figures relating to the dividend, record date and financial results are drawn from Divi's Laboratories' exchange filings dated 23 May 2026; market prices, yields, shareholding and peer data are sourced from third-party financial platforms and may change. The current market price must be verified against live NSE/BSE data before acting. Ex-date and payment date are inferred from settlement and statutory rules and are not company-disclosed. Ratio calculations are ShareBazaar Online's own workings and may differ from other providers due to methodology. Please consult a SEBI-registered investment adviser and a qualified tax professional before making any investment decision. ShareBazaar Online accepts no liability for any loss arising from reliance on this content.