
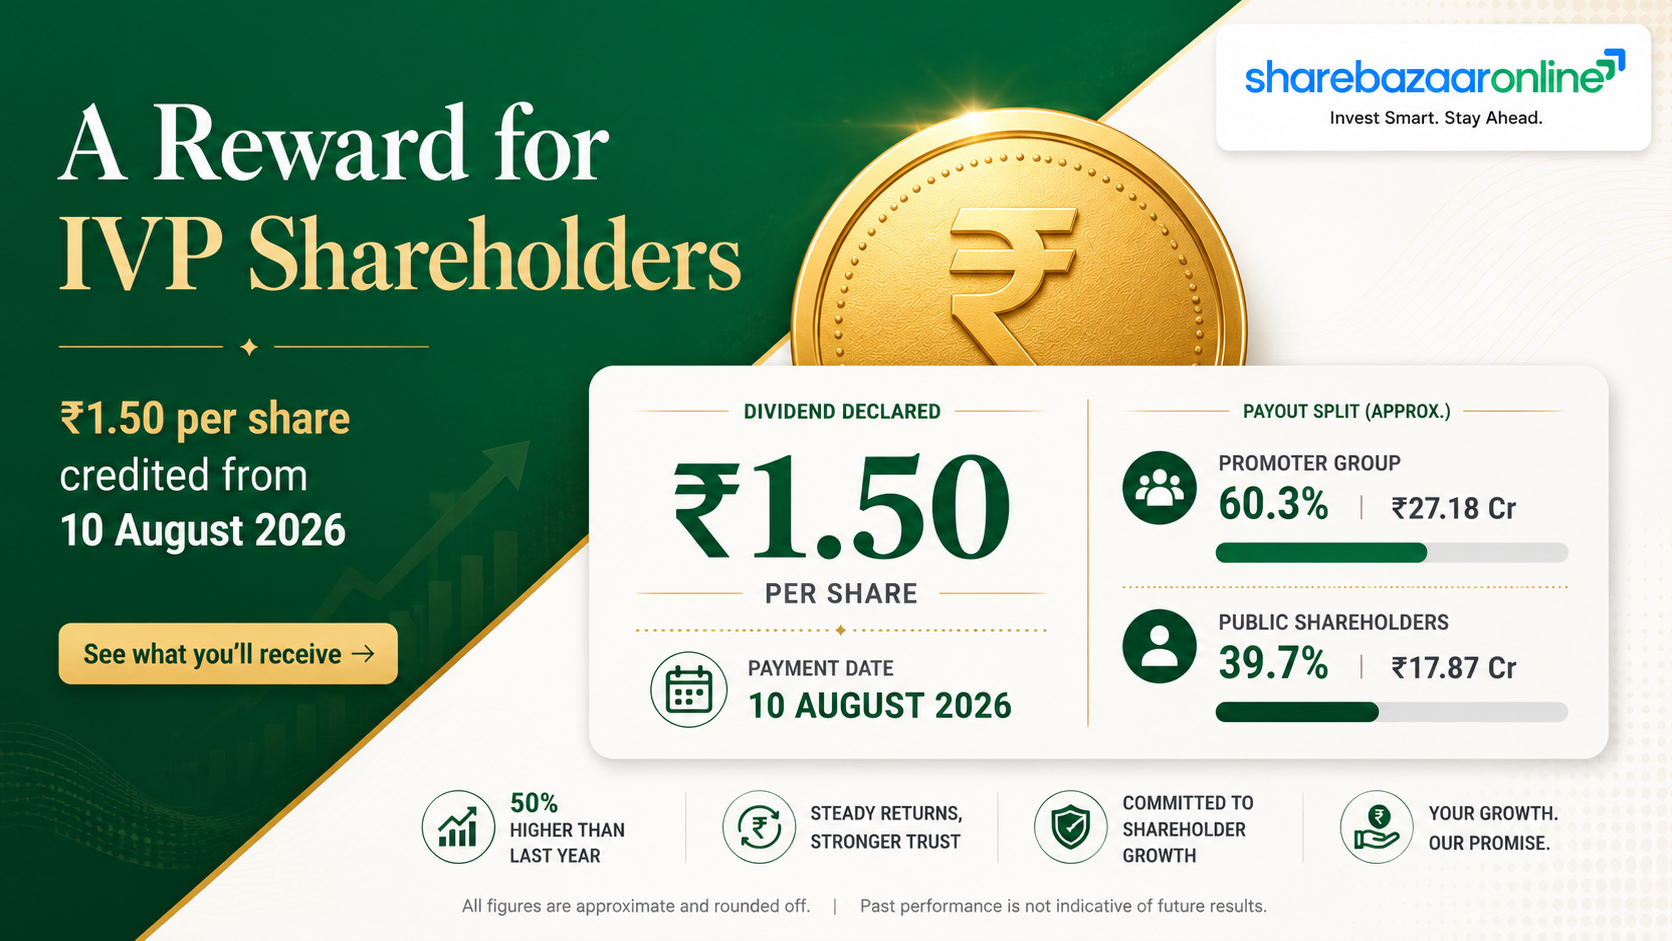
Dividend Snapshot
IVP has raised its dividend to ₹1.50/share from ₹1.00/share a year ago — a 50% increase — on the back of a 65% jump in net profit to ₹18.68 crore. Even so, this is a very low-payout dividend: it consumes only about 8.3% of earnings. The results are standalone; IVP does not report consolidated financials.
Dividend Announcement Summary
At its board meeting on 21 May 2026, IVP Limited's Board of Directors recommended a final dividend of 15%, i.e. ₹1.50 per equity share of face value ₹10 (fully paid-up) for the financial year ended 31 March 2026. The dividend is subject to shareholder approval at the ensuing 97th Annual General Meeting and will be credited/dispatched within the timeline prescribed under the Companies Act, 2013.
The same board meeting also approved the FY26 audited standalone results (unmodified audit opinion from M/s. Rajendra & Co.), re-appointed the statutory auditors for a second five-year term, appointed cost auditors for FY27, and re-appointed two independent directors. A key item flagged inside the results: a completed investigation into misrepresentation and falsification of customer records by a sales employee, with a total impact of ₹613 lakh fully provided for.
Key Dates Timeline
Record date, ex-date, payment date and AGM date are confirmed from exchange filings and company communications, not from the 21 May outcome letter (which did not state them). Under India's T+1 settlement, the ex-date coincides with the record date.
Dividend Yield Analysis
Yield reality check
At roughly 1%, IVP's dividend yield is low — this is not a high-yield income stock. The yield is modest because the company deliberately pays out only a small slice of profits (it retains cash to fund working capital and reduce debt), not because of a special dividend or a collapsing share price. The stock is actually down roughly 20% over the past year, which nudges the yield up slightly, but the absolute payout remains small by design. Investors buying IVP for dividend income alone will find the return thin; the dividend is better read as a signal of improving profitability than as a cash-flow play.
Dividend History Analysis
| Financial Year | EPS (₹) | Payout % | DPS (₹, approx) |
|---|---|---|---|
| FY2026 | 18.09 | 8.3% | 1.50 (confirmed) |
| FY2025 | 10.96 | 9% | 1.00 (confirmed) |
| FY2024 | 11.89 | 8% | 1.00 |
| FY2023 | 27.13 | 6% | ~1.50 |
| FY2022 | 17.07 | 9% | ~1.50 |
| FY2021 | 4.36 | 23% | ~1.00 |
| FY2020 | -8.35 | 0% | Nil (loss year) |
| FY2019 | 3.27 | 31% | ~1.00 |
| FY2015-18 | 6.7–10.5 | 19–30% | ~2.00 |
Payout % is sourced from public financial databases; per-share figures for FY2019–FY2023 are derived from payout ratio × EPS and rounded — treat them as indicative, not company-confirmed. FY2025 and FY2026 DPS are confirmed.
Classification: Consistent but conservative payer
IVP has paid a dividend in almost every year of the past decade, skipping only FY2020 when it posted a loss (EPS −₹8.35). That makes it a Consistent Payer, but with an unusually low and stable payout — the three-year average payout is just 5.85% of profits. The FY26 hike to ₹1.50 is the first increase in the per-share dividend in several years and tracks the sharp recovery in earnings.
Financial Performance Analysis (Standalone)
| Metric (₹ Cr) | FY2026 | FY2025 | YoY |
|---|---|---|---|
| Revenue from Operations | 594.55 | 538.85 | +10.3% |
| Profit Before Tax | 25.14 | 15.26 | +64.7% |
| Net Profit (PAT) | 18.68 | 11.31 | +65.2% |
| EPS (₹) | 18.09 | 10.96 | +65.1% |
| Operating profit (EBITDA, ex-exceptional) | 38.98 | 28.78 | +35.4% |
Operating leverage: profits grew 6x faster than revenue
The standout feature of FY26 is the gap between top-line and bottom-line growth. Revenue rose a modest 10.3%, but PAT jumped 65.2% and EBITDA rose 35.4%. This is positive operating leverage: the operating margin (OPM) widened from about 5% to 6%, and lower finance costs (down from ₹7.79 Cr to ₹7.37 Cr) plus a big drop in gross borrowings amplified the flow-through to profit. The Q4 alone delivered EPS of ₹8.58 — nearly half the full-year figure — showing a strong finish to the year.
One-time items to note
FY26 PAT is stated after an exceptional charge of ₹46 lakh (a one-time employee-benefit provision on the new Labour Codes) and after a ₹5.23 Cr provision for doubtful debts. Adjusting for these, underlying operating momentum is even stronger — but the doubtful-debt provision is a recurring feature of IVP's high-receivables business model, not purely a one-off.
Cash Flow Analysis
Reported profits are opinions; cash is fact
This is where IVP's FY26 story gets genuinely interesting. Operating cash flow swung from negative ₹2.47 Cr in FY25 to positive ₹52.71 Cr in FY26 — a ₹55 Cr swing. And unlike FY25, where cash badly lagged reported profit, FY26 OCF (₹52.71 Cr) is 2.8 times the net profit of ₹18.68 Cr. That is a high-quality result.
But dig into the source of that cash
The cash surge was driven substantially by working-capital release, not just earnings: inventories fell (releasing ₹9.98 Cr) and trade payables rose (releasing ₹14.74 Cr). Receivables still consumed ₹9.47 Cr, showing collections remain a drag. The company used this cash to repay debt aggressively — ₹27 Cr of short-term borrowings and ₹12.7 Cr of inter-corporate deposits were repaid. So FY26 cash generation is real, but a portion reflects a one-time working-capital unwind that may not repeat every year.
How is the dividend funded?
The ₹1.55 Cr dividend is funded comfortably from current earnings and operating cash flow — it is not drawn from asset sales or fresh borrowings. FCF of ₹49.91 Cr covers the payout roughly 32 times over. Funding is not a concern here; the far bigger question is why so little is being distributed.
Balance Sheet Strength
The balance sheet improved materially in FY26: gross borrowings dropped from ₹104.42 Cr to ₹65.37 Cr (a 37% cut), pushing debt-to-equity down to a comfortable 0.42. That said, two cautions stand out. First, the cash balance is thin at ₹3.24 Cr — the deleveraging consumed most of the operating cash, leaving little buffer. Second, contingent liabilities of about ₹92.4 Cr are large relative to a ₹157 Cr net worth and a ₹156 Cr market cap; these include the long-running Mumbai Port land dispute. Trade receivables of ₹186.3 Cr (31% of revenue, ~114 debtor days) tie up a big share of the balance sheet and are the company's structural working-capital weak spot.
Dividend Sustainability Analysis
Verdict: SUSTAINABLE
The dividend is tiny relative to earnings and cash generation, so its continuation is not in doubt. The real debate is about capital allocation, not affordability.
On every test that matters — earnings coverage (12x), FCF coverage (32x), a falling debt load and a rising profit trend — the ₹1.50 dividend is thoroughly affordable. The one soft spot is the 2.1x cash coverage: because the closing cash balance is only ₹3.24 Cr, the payout is really being funded from the year's cash flow rather than from a reserve cushion. That is fine while operations generate cash, but it explains the company's conservatism. Bottom line: sustainability of this dividend is not the risk; the risk is that IVP keeps distributing far less than it earns.
Peer Comparison
| Metric | IVP Ltd | Specialty-chem peer set* |
|---|---|---|
| Dividend Yield | ~0.99% | Not Independently Verified |
| Dividend Payout | 8.3% | Not Independently Verified |
| ROE | 12.8% | Not Independently Verified |
| ROCE | 14.1% | Not Independently Verified |
| P/E | ~8.4x | Industry median ~27x |
| P/B | ~1.0x | Not Independently Verified |
*IVP is a niche foundry-chemicals maker with no close listed pure-play peer. Fields left as "Not Independently Verified" rather than populated with unverified aggregator data. The one robust comparison available — IVP's P/E of ~8.4x against a specialty-chemicals industry median of roughly 27x — is shown.
IVP trades at a steep discount to the broader specialty-chemicals universe (P/E ~8x vs an industry median near 27x) and at roughly book value. Its ROE (12.8%) and ROCE (14.1%) are decent but not spectacular for the sector, and its dividend yield and payout are both well below what larger, cash-generative chemical majors typically offer. The valuation gap reflects its micro-cap size, commodity/foundry exposure, thin liquidity and governance overhang rather than a clear mispricing.
Promoter Impact Analysis
The Allana-group promoters own 71.32% of IVP, so roughly ₹1.11 crore of the ₹1.55 crore payout flows to the promoter family; minority shareholders collectively receive about ₹0.44 crore. Institutional ownership is effectively nil (FIIs 0%, DIIs 0.02%), which is typical for a micro-cap of this size and explains the thin trading liquidity. The very low payout means the promoter is choosing to retain profits inside the company — reducing debt and building reserves — rather than take cash out. For minority investors this is a double-edged sword: it strengthens the balance sheet, but it also means limited direct cash return.
Taxation Analysis
How dividends are taxed in India
Since April 2020, dividends are taxed in the hands of the investor at their applicable income-tax slab rate (there is no Dividend Distribution Tax paid by the company any more). The dividend is added to "Income from Other Sources". The company deducts TDS at 10% on dividend paid to a resident only if the total dividend to that shareholder in a financial year exceeds ₹10,000 (this threshold was raised from the earlier ₹5,000). Non-residents face higher TDS (typically 20% plus surcharge/cess) unless a lower DTAA rate is claimed with the right documentation.
Worked example: 1,000 shares of IVP
For an investor in the 30% slab, the ₹1,500 gross dividend becomes ₹1,050 after tax. Because the payout is under ₹10,000, no TDS is deducted at source — but the investor must still declare and pay tax when filing returns. The effective post-tax yield at ~₹151 drops to roughly 0.70%.
Key Risks
1. Governance / internal-control risk. A sales employee falsified customer records, with total impact of ₹613 lakh now fully provided for. Fraud of this scale in a company earning ~₹19 Cr a year is a real red flag on internal controls, even though the company says it has strengthened processes.
2. Chronically high receivables. Trade receivables of ₹186 Cr equal 31% of revenue (~114 debtor days), with a recurring ₹5–6 Cr annual doubtful-debt provision. Collection quality is the structural weak point of the business model.
3. Large contingent liabilities. ~₹92.4 Cr of contingent liabilities (including the Mumbai Port land dispute) loom large against a ₹157 Cr net worth; an adverse outcome could dent the balance sheet.
4. Commodity margin cyclicality. As a foundry-chemicals maker, IVP's operating margin has swung between roughly 3% and 8% quarter to quarter, exposed to raw-material inflation and cyclical foundry demand.
5. Micro-cap liquidity & concentration. With a ~₹156 Cr market cap, 71% promoter holding and near-zero institutional ownership, the stock trades thinly — entry and exit can move the price, and minority influence over capital allocation is limited.
What To Monitor
1. Debtor days and doubtful-debt provisions — watch whether the ~114-day receivables cycle shortens or the annual doubtful-debt provision shrinks; that would signal genuinely improving collection quality.
2. Operating margin trajectory — Q4FY26 OPM of 8.3% was the best in two years; track whether margins hold above the ~6% range or revert.
3. Debt reduction continuity — borrowings fell 37% in FY26; monitor whether the company keeps deleveraging or re-levers for working capital.
4. Payout policy signals — the FY26 hike to ₹1.50 is the first increase in years; watch whether management moves toward a stated, higher payout as cash builds.
5. Contingent-liability and legal outcomes — especially the Mumbai Port dispute and any residual fraud recovery, both of which could materially affect the balance sheet.
Conclusion
IVP Limited's FY26 ₹1.50 dividend sits on top of a genuinely strong operating year: a 65% surge in profit, a ₹55 Cr swing in operating cash flow, and a 37% cut in debt. The dividend is raised 50% year-on-year and is covered a comfortable 12 times by earnings and 32 times by free cash flow — there is no question about affordability.
The balancing points are equally important: the yield is a slim ~1%, the payout is one of the lowest around at 8%, the cash balance is thin at ₹3.24 Cr, receivables are stretched, and a ₹613-lakh employee fraud plus ₹92 Cr of contingent liabilities weigh on the governance and balance-sheet picture. In short, this is a recovering, cash-generative micro-cap that pays a token dividend while prioritising debt reduction. Income seekers will find the yield thin; the dividend is best read as a confidence signal rather than a cash-return story. Investors should weigh the improving fundamentals against the governance and receivables risks and decide for themselves.
Frequently Asked Questions
What dividend has IVP Limited announced for FY2025-26?
What is the dividend yield on IVP shares?
What is the record date for the IVP dividend?
What is the ex-dividend date?
When will the IVP dividend be paid?
Who is eligible to receive this dividend?
How is the IVP dividend taxed?
Is IVP's dividend sustainable?
What is IVP's dividend history?
Why did IVP raise its dividend this year?
How much of the dividend goes to promoters?
What is the ₹613 lakh fraud mentioned in the results?
What should investors monitor going forward?
Are IVP's results standalone or consolidated?
What does IVP Limited do?
Disclaimer
This article is for informational and educational purposes only and does not constitute investment advice or a recommendation to buy, sell or hold any security. ShareBazaar Online is not a SEBI-registered investment adviser. Dividend figures, dates and event details are based on IVP Limited's exchange filings dated 21 May 2026 and subsequent company communications; financial data is drawn from audited standalone results and public financial databases. Market price, dividend yield and any derived per-share figures for prior years are indicative and must be verified against live NSE/BSE data before acting. Dividends are subject to shareholder approval at the AGM. Investors should consult a qualified financial adviser and conduct their own due diligence. Investments in securities are subject to market risks; past performance is not indicative of future results.