
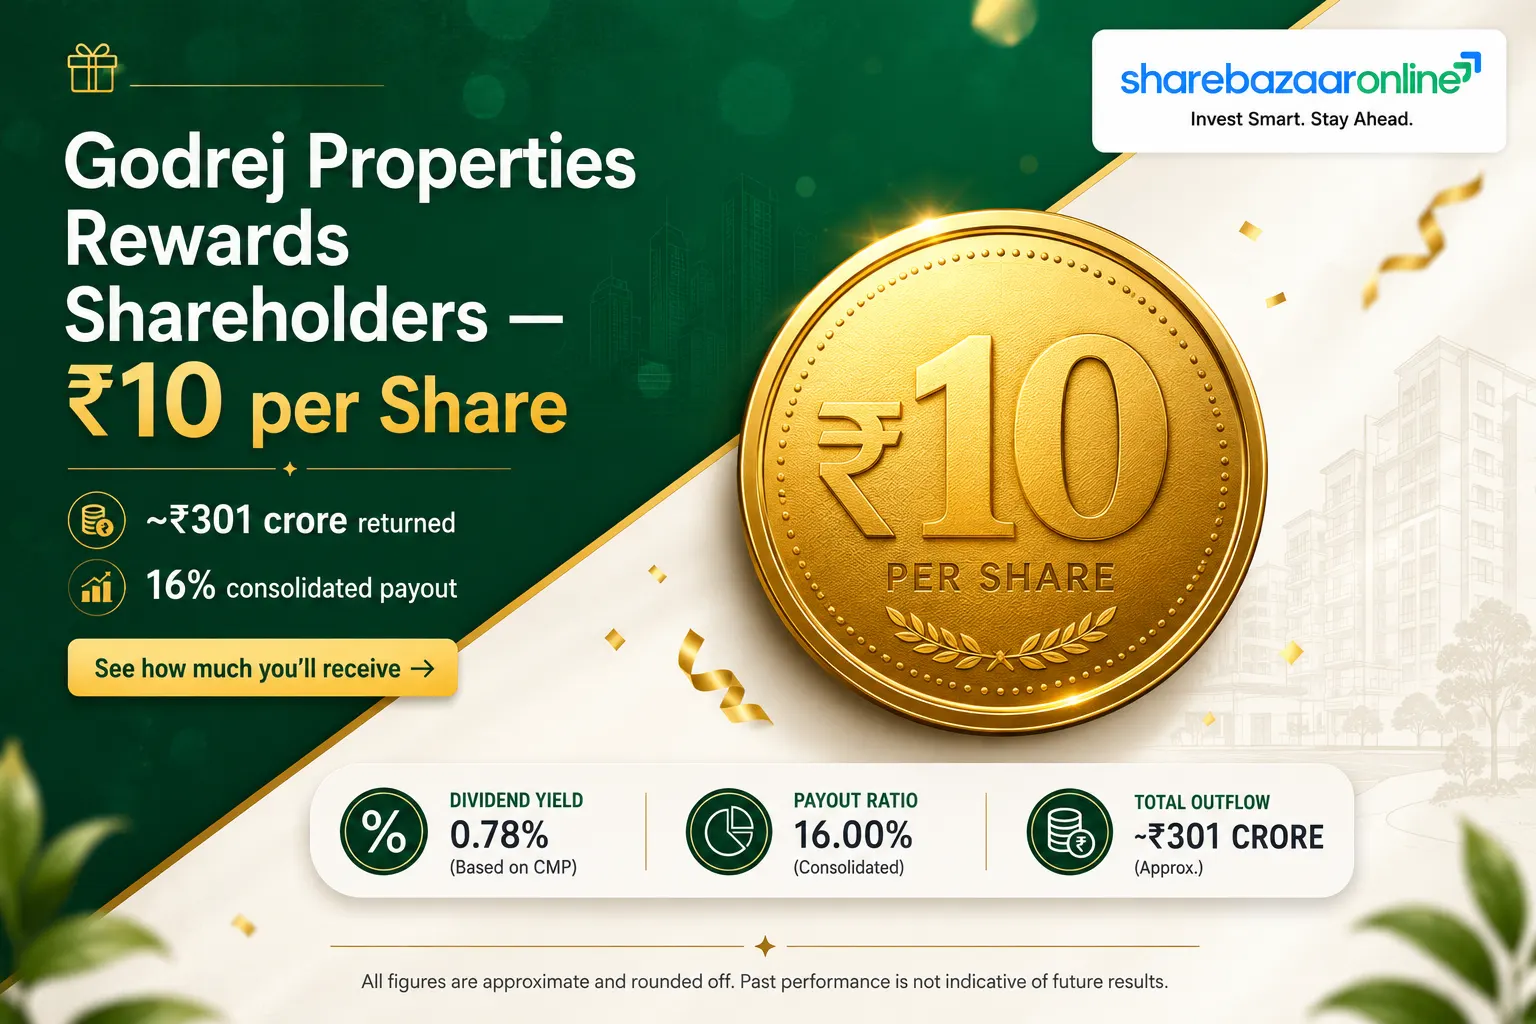
The Big Picture: A Dividend After 11 Years
This is not a routine payout. Godrej Properties last paid a dividend for FY2014–15 (₹2 per share). It then paid nothing for roughly a decade — FY16 through FY25 — choosing to reinvest every rupee into land and growth. The FY26 dividend of ₹10 per share is the company's first payout in about 11 years and, by absolute value, the largest in its listed history (five times the previous high of ₹2).
Yet the yield is tiny (~0.49%). Godrej Properties remains a growth stock, not an income stock. The more revealing story sits beneath the headline: a sharp gap between consolidated and standalone earnings, profit growth that dwarfs revenue growth, and promoters — who just raised their stake to 51.66% — collecting roughly half the cash.
1. Dividend Snapshot
Dividend Per Share
₹10.00 (200%)
Face Value ₹5 · Final Dividend · FY2025–26
Dividend Yield (on CMP ₹2,028.70)
~0.49%
CMP as of 24 Jul 2026 · verify vs live NSE/BSE
Total Dividend Outflow
~₹301 Cr
₹10 × ~30.12 crore shares
Payout Ratio
16.4% consolidated
86.4% on standalone PAT — see analysis
NSE Symbol
GODREJPROP
BSE Code
533150
ISIN
INE484J01027
Sector
Real Estate
2. Dividend Announcement Summary
At its board meeting on 04 May 2026, the Board of Godrej Properties recommended a final dividend of ₹10 per equity share (200% of the ₹5 face value) for the financial year ended 31 March 2026. The payout is subject to shareholder approval at the 41st Annual General Meeting scheduled for 04 August 2026.
Other board decisions the same day (context that matters for cash allocation):
- Enabling approval to raise up to ₹3,000 crore via Non-Convertible Debentures / bonds on a private-placement basis. The company is preparing to add debt in the same window it starts returning cash.
- Retirement of Mr. Nadir Godrej (DIN: 00066195) as Non-Executive Non-Independent Director, effective at the close of the 41st AGM, as he turns 75 in August 2026.
3. Key Dates Timeline
03 Sep 2026
4. Dividend Yield Analysis
Yield on current price (₹2,028.70)
0.49%
Yield on announcement-day price (~₹1,883)
~0.53%
Yield Reality Check
A ~0.49% yield is not an income proposition. For perspective, a bank savings account or liquid fund comfortably beats it. The yield is low for a healthy reason — the share price (₹2,028) is high relative to the modest ₹10 payout, and the company deliberately retains most of its cash for a large land-and-launch pipeline. The dividend here is best read as a signal of balance-sheet confidence, not a source of regular income.
5. Dividend History Analysis
| Financial Year | Dividend / Share | Ex / Record (approx.) | Note |
|---|---|---|---|
| FY2025–26 | ₹10.00 | 28 Jul 2026 | Proposed · face value ₹5 |
| FY2016–FY2025 | NIL | — | ~10 years of no dividend |
| FY2014–15 | ₹2.00 | 27 Jul 2015 | Last payout before FY26 · ₹5 FV |
| FY2013–14 | ₹2.00 | 28 Jul 2014 | ₹5 FV |
| FY2012–13 | ₹1.86 | 02 Jul 2013 | ₹10 FV (pre-split) |
| FY2011–12 | ₹1.40 | 19 Jul 2012 | ₹10 FV (pre-split) |
| FY2010–11 | ₹2.09 | 14 Jul 2011 | ₹10 FV (pre-split) |
| FY2009–10 | ₹1.86 | 08 Jul 2010 | ₹10 FV (pre-split) |
Historical dividend figures compiled from third-party corporate-action databases (not independently verified against original exchange filings). A stock split from ₹10 to ₹5 face value took effect on 21 Nov 2013; dividends before that date were declared on ₹10-face-value shares and are not directly comparable per-share to today's ₹5-face-value figures.
Payer Classification: Irregular / Early-Stage Payer
The record shows a small, semi-regular dividend up to FY15, a decade-long suspension, and now a large resumption. This is not a consistent-compounder dividend track record. Investors should treat FY26 as a fresh start and wait to see whether a repeatable policy follows — a single large payout does not establish a trend.
6. Financial Performance Analysis (FY26)
| Metric (Consolidated) | FY26 | FY25 | Change |
|---|---|---|---|
| Revenue from operations | ₹5,131 Cr | ₹4,923 Cr | +4.2% |
| Net profit (PAT) | ₹1,840.66 Cr | ₹1,389.23 Cr | +32.5% |
| EPS (consolidated) | ~₹61.1 | ~₹46 | +32% |
| Pre-sales / bookings | ₹34,171 Cr | ₹29,444 Cr | +16% |
FY25 PAT is reported by some aggregators as ₹1,507.83 Cr; ShareBazaar uses the audited FY26 comparative of ₹1,389.23 Cr (attributable to owners). The conflict is flagged for the editor.
Operating Leverage: profit up 32%, revenue up only 4%
The gap is characteristic of a developer. Real-estate revenue is recognised in lumps on project completion, so a modest 4% revenue rise sits alongside a 32% profit jump powered by higher other income, share of profits from joint ventures/associates, and a richer project mix. Investors should not annualise this profit growth as an operating trend — it is partly timing-driven.
7. Cash Flow Analysis
Operating cash flow, FY26 (company-cited)
₹7,830 Cr
Record high per management commentary
OCF cover of dividend outflow
~26×
₹7,830 Cr ÷ ~₹301 Cr
How is the dividend funded?
On a group basis, comfortably from current operating cash. Management flagged record operating cash flow of ₹7,830 crore in FY26, which covers the ~₹301 crore payout about 26 times over. The catch: the company is also seeking approval to raise up to ₹3,000 crore of debt for land and growth. So while the dividend is not being funded by borrowings, the group is simultaneously distributing cash and gearing up — a normal developer pattern, but worth watching.
A clean "free cash flow" figure is not separately disclosed for a developer of this type. Standalone entity cash and precise net-debt breakdown are Not Independently Verified here and should be confirmed from the FY26 annual report.
8. Balance Sheet Strength
Consolidated net worth (31 Mar 2026)
₹19,155.54 Cr
Debt-to-equity (company-cited)
0.82
Within management's stated 0.5–1.0 comfort band
A ₹19,155 crore net worth easily absorbs a ₹301 crore dividend. However, at a D/E of 0.82, Godrej Properties is meaningfully more leveraged than its top peers: DLF closed FY26 in a net-cash position (~₹14,155 crore cash) and Oberoi Realty runs a D/E near 0.01. GPL's dividend is affordable, but it is being paid from a more geared balance sheet than the sector's cash-rich names — and alongside a fresh ₹3,000 crore debt-raising enabling resolution.
9. Dividend Sustainability Analysis
Overall classification
Affordable, but Not Yet Established as a Policy
Supports affordability
- Consolidated payout only 16.4% of PAT
- OCF covers the payout ~26×
- Net worth ₹19,155 Cr · record pre-sales ₹34,171 Cr
Reasons for caution
- Standalone payout is ~86% of standalone PAT (₹348.75 Cr)
- Standalone PAT fell 65% YoY; standalone revenue fell 28%
- No dividend for ~10 years — no continuity to rely on
- D/E 0.82 with a ₹3,000 Cr debt plan in the wings
Why the two payout numbers differ so much: dividends are legally paid out of the standalone parent's profits and reserves, where FY26 PAT was just ₹348.75 crore. The group's real earnings power sits in subsidiaries and JVs, lifting consolidated PAT to ₹1,840.66 crore. The parent's huge reserves make the payout safe today, but the low standalone earnings are the honest reason to call this "affordable" rather than "clearly sustainable-and-growing".
10. Peer Comparison
| Company (FY26) | Div/Share | Yield | ROE | D/E | Balance sheet |
|---|---|---|---|---|---|
| Godrej Properties | ₹10 (FV 5) | ~0.49% | ~9.6% | 0.82 | Net debt |
| DLF | ₹8 (FV 2) | ~1.4% | — | Net cash | ~₹14,155 Cr net cash |
| Oberoi Realty | — | ~0.37% | ~14.2% | ~0.01 | Near-zero debt |
| Macrotech (Lodha) | — | — | — | — | — |
| Prestige Estates | — | — | — | — | — |
Blank cells are left empty rather than estimated where a verified figure was not available. Peer figures are indicative and drawn from third-party sources; verify before publication. Takeaway: among large listed developers, GPL offers a lower yield, lower ROE and higher leverage than DLF and Oberoi — it is resuming dividends from a weaker balance-sheet position than the sector's cash-rich leaders.
11. Promoter Impact Analysis
Promoter holding (Mar 2026 qtr)
51.66%
Up from 47.17% — raised via ~₹2,674 Cr creeping acquisition in FY26
Estimated promoter share of dividend
~₹155.6 Cr
51.66% of ~₹301 Cr outflow
The timing is notable. In FY26 the promoter group spent roughly ₹2,674 crore buying an additional ~5% stake, lifting holding to 51.66% just as the company resumes dividends. Of the ~₹301 crore payout, promoters collect about ₹156 crore; FIIs (25.32%) ~₹76 crore; DIIs (9.01%) ~₹27 crore; and public/retail (~14%) ~₹42 crore. A resumed dividend is a benefit shared pro-rata, but it is fair to note the largest single beneficiary is the newly-enlarged promoter block.
12. Dividend Taxation Analysis
Since April 2020, dividends are taxable in the hands of the shareholder at their applicable income-tax slab rate. There is no Dividend Distribution Tax at the company level any more. The company deducts TDS at 10% if a resident shareholder's total dividend from that company exceeds ₹5,000 in a financial year (this TDS is adjustable against final tax liability). Non-residents face different TDS rules.
Worked Example — investor holding 1,000 shares, 30% slab
| Gross dividend (1,000 × ₹10) | ₹10,000 |
| TDS deducted at source @10% | ₹1,000 (adjustable) |
| Tax @30% + 4% cess | ₹3,120 |
| Net dividend in hand | ₹6,880 |
| Effective post-tax yield (on CMP) | ~0.34% |
Illustrative only; excludes surcharge for very high incomes and any rebates. Not tax advice — consult a qualified professional.
13. Key Risks
- Dividend continuity risk: a decade-long gap means there is no policy to rely on; FY26 could be a one-off rather than the start of a series.
- Weak standalone earnings: standalone PAT fell ~65% to ₹348.75 crore and standalone revenue fell ~28% — the parent's own profit is thin relative to the payout.
- Rising leverage: D/E of 0.82 plus a ₹3,000 crore debt-raising resolution, against net-cash peers, leaves less cushion in a downturn.
- Lumpy, completion-linked revenue: real-estate profit recognition is volatile; a strong FY26 does not guarantee FY27 momentum.
- Sector and macro risk: housing demand, interest rates and input costs can swing quickly; pre-sales growth has moderated in some quarters.
- Approval risk: the dividend is still subject to shareholder approval at the 04 Aug 2026 AGM.
14. What To Monitor
- Does a dividend policy emerge? Watch whether FY27 also carries a payout — that would upgrade GPL from "one-off" to "resuming payer".
- Standalone profit recovery: track whether standalone PAT rebounds from the ₹348.75 crore FY26 low.
- Net-debt trajectory: monitor how much of the ₹3,000 crore NCD authorisation is drawn and where D/E settles.
- Pre-sales and collections: the ₹34,171 crore FY26 bookings and FY27 guidance of >₹39,000 crore are the real growth engine.
- Operating cash flow: can the company repeat anything close to the ₹7,830 crore FY26 record?
- Promoter actions: further stake changes after the FY26 creeping acquisition.
15. Conclusion
Positives
- First dividend in ~11 years — a confidence signal
- Record FY26: PAT ₹1,840 Cr, pre-sales ₹34,171 Cr, OCF ₹7,830 Cr
- Payout comfortably covered on a group basis (16% payout, 26× OCF cover)
Negatives / Watch-outs
- Yield only ~0.49% — not an income stock
- Standalone payout ~86%; standalone PAT down 65%
- Higher leverage than net-cash peers; ₹3,000 Cr debt plan
- No dividend continuity to rely on
Godrej Properties' ₹10 dividend is a milestone worth understanding for what it is: a large, one-time-for-now cash return from a company that has spent a decade prioritising growth over payouts, funded easily by group cash but sitting on a thinner standalone profit and a more geared balance sheet than its cash-rich peers. It rewards existing shareholders and signals confidence — but at this yield, it changes the income case very little. The question that matters is whether FY27 turns this into a habit.
Frequently Asked Questions
What dividend has Godrej Properties announced for FY26?
What is the dividend yield?
What is the record date?
What is the ex-date?
When will the dividend be paid?
Who is eligible for the dividend?
How is this dividend taxed?
Is the dividend sustainable?
What is Godrej Properties' dividend history?
Why is the dividend so much larger than before?
How does the payout compare with DLF and Oberoi Realty?
How much of the dividend goes to promoters?
What should investors monitor from here?
Does the dividend need AGM approval?
Disclaimer
This article is for informational and educational purposes only and does not constitute investment, financial, legal or tax advice, nor a recommendation to buy, sell or hold any security. Dividend, financial and shareholding figures are drawn from company exchange filings and third-party sources believed reliable but not independently audited by ShareBazaar Online; some figures (market price, cash and net-debt details, historical dividends, peer data) require verification against original filings and live market data before reliance. The ex-date is inferred from settlement convention and the dividend remains subject to AGM approval. Market investments are subject to risk. Please consult a SEBI-registered advisor and a qualified tax professional before making decisions.