
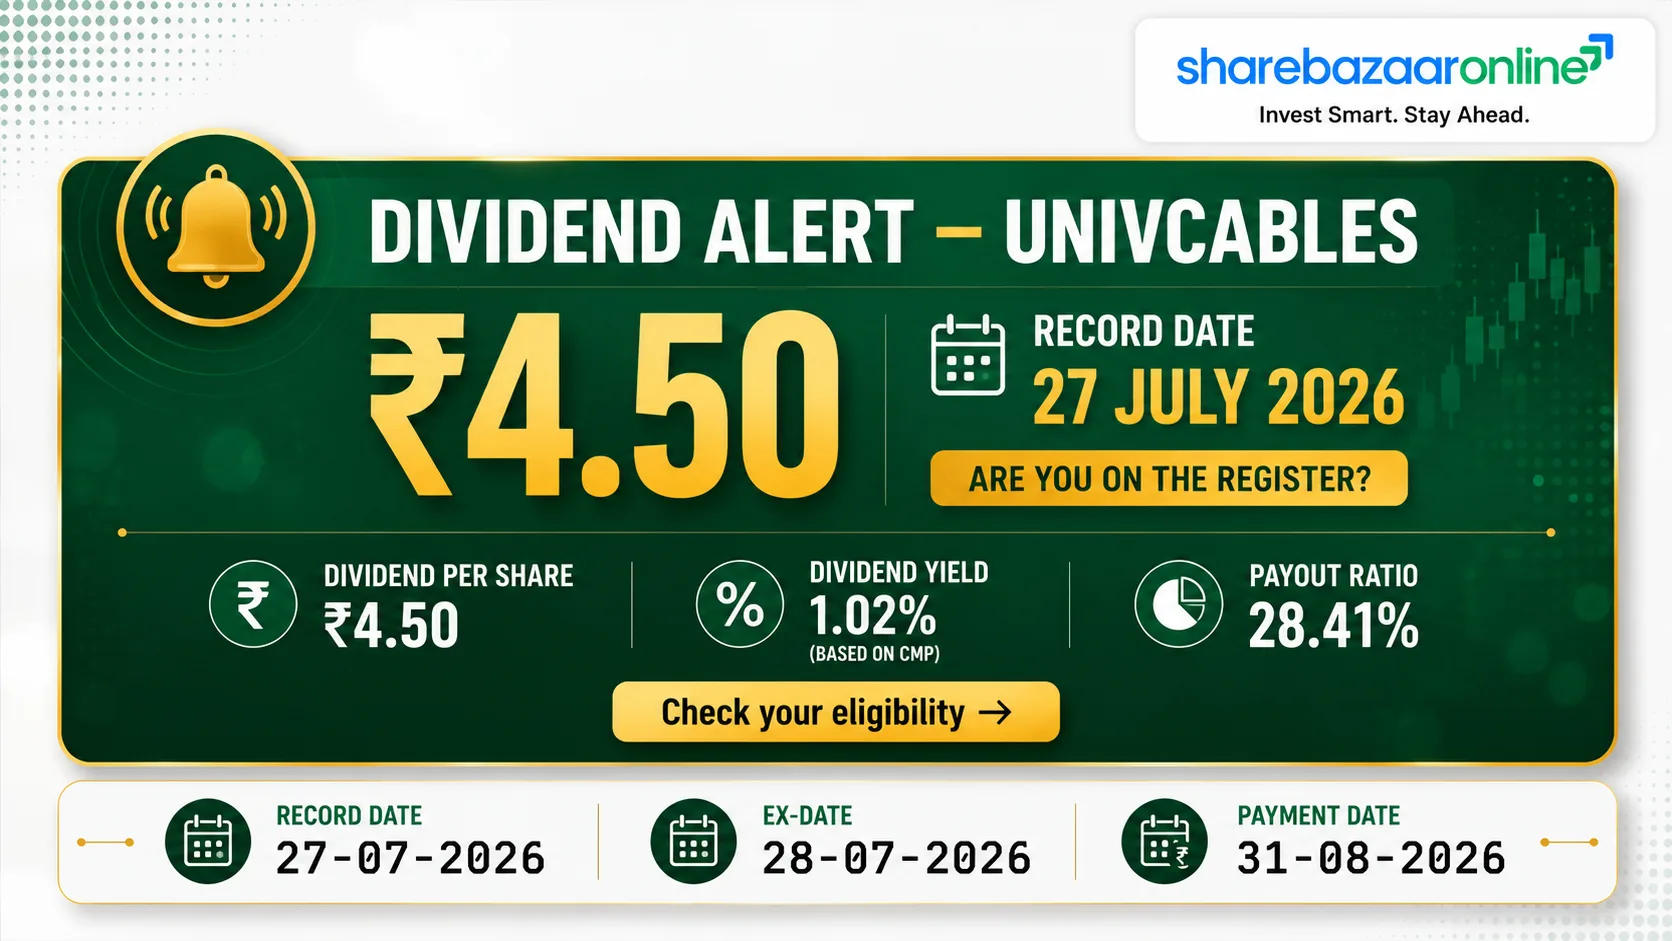
Universal Cables Limited has fixed Monday, 27 July 2026 as the record date to determine eligibility for the ₹4.50 per share final dividend for FY2025-26. Subject to shareholder approval at the 81st AGM on 3 August 2026, the dividend is payable on or before 31 August 2026. Shares bought on or after the ex-date do not carry dividend rights.
Dividend Snapshot
Dividend Per Share
₹4.50 (45% on ₹10 face value)
Dividend Yield
~0.37%
at CMP ₹1,220 · 0.44% at announcement price ₹1,012.05
The one-line takeaway: This is the company's highest dividend in at least a decade and its fourth straight annual increase (₹1.00 in FY21 to ₹4.50 now) — yet at a ~0.37% yield it is a growth-signalling dividend, not an income play. Notably, the payout was funded during a year of negative free cash flow as the company runs a heavy capex cycle.
Dividend Announcement Summary
At its board meeting on 23 May 2026, Universal Cables Limited recommended a final dividend of ₹4.50 per fully paid-up equity share (45% of the ₹10 face value) for the financial year ended 31 March 2026. The board disclosed a total dividend outflow of ₹1,561.29 lakhs (₹15.61 crore) on 3,46,95,381 equity shares.
The dividend is subject to shareholder approval at the 81st Annual General Meeting and, once approved, is payable within 30 days, net of tax deducted at source under the Income Tax Act, 2025. The same board meeting also cleared three capital-heavy decisions that frame how to read this dividend: a ₹73 crore modernisation of the Satna EHV cable facility (on top of an ongoing ₹550 crore capacity-expansion programme), and approval to raise up to ₹200 crore via non-convertible debentures.
Why this matters: The company is simultaneously distributing cash and gearing up to borrow — a deliberate choice to keep rewarding shareholders modestly while prioritising a growth-oriented balance sheet. The dividend is small enough (₹15.61 crore) that it does not compete materially with the ₹550 crore+ capex, which is the real story here.
Key Dates Timeline
| Event | Date | Status |
|---|---|---|
| Board Meeting / Announcement | 23 May 2026 | Confirmed |
| Ex-Date | 24 July 2026 (inferred) | Verify |
| Record Date | 27 July 2026 | Confirmed |
| 81st AGM (Declaration) | 3 August 2026 | Confirmed |
| Payment (outer limit) | On or before 31 August 2026 | Confirmed |
Note on ex-date: The record date of 27 July 2026 is company/exchange-disclosed. The ex-date shown (24 July 2026) is inferred on a T+1 basis (the trading day before the record date) and is not independently confirmed. Under the current same-day convention it may coincide with the record date. Please verify against the NSE/BSE corporate-action circular before publication.
Dividend Yield Analysis
Yield at current market price (₹1,220)
0.37%
₹4.50 ÷ ₹1,220
Yield at announcement price (₹1,012.05)
0.44%
₹4.50 ÷ ₹1,012.05 (22 May 2026 close)
The yield-reality check. A 0.37% yield is well below a bank savings account and far below what a dividend-income investor would seek. Crucially, the low yield is not the result of a falling share price — the opposite is true. UNIVCABLES has risen roughly 88-94% over the past year and touched a 52-week high near ₹1,328. The share price has compounded faster than the dividend, so the yield has been compressed by strong capital appreciation. In plain terms: investors are here for growth and re-rating, not for the dividend cheque.
Dividend History Analysis
| Financial Year | Dividend / Share | % on Face Value |
|---|---|---|
| FY2025-26 | ₹4.50 | 45% |
| FY2024-25 | ₹4.00 | 40% |
| FY2023-24 | ₹3.00 | 30% |
| FY2022-23 | ₹3.00 | 30% |
| FY2021-22 | ₹1.50 | 15% |
| FY2020-21 | ₹1.00 | 10% |
| FY2019-20 | ₹2.00 | 20% |
| FY2018-19 | ₹2.00 | 20% |
| FY2017-18 | ₹1.50 | 15% |
Dividend history compiled from public corporate-action records; mapped to the financial year to which each dividend relates. Historical figures are not independently verified against every year's annual report.
Classification: recovering / progressive payer — not a flawless "consistent payer." This is the nuance a wire-service report misses. The dividend was cut to ₹1.00 in FY21 during the pandemic (from ₹2.00 the prior year) before recovering. Since then it has climbed every single year: ₹1.00 → ₹1.50 → ₹3.00 → ₹3.00 → ₹4.00 → ₹4.50. So the honest label is a rising dividend with a demonstrated willingness to cut in a downturn — investors should not assume the payout is recession-proof.
Financial Performance Analysis (FY2025-26)
Standalone
| Revenue from Operations | ₹3,022.67 cr |
| Revenue Growth (YoY) | +25.5% |
| Profit Before Tax | ₹135.13 cr |
| Net Profit (PAT) | ₹96.53 cr |
| PAT Growth (YoY) | +68.5% |
| EPS | ₹27.82 |
Consolidated
| Revenue from Operations | ₹3,022.67 cr |
| Profit Before Tax | ₹217.40 cr |
| Share of Associate / JV Profit | ₹82.27 cr |
| Net Profit (PAT) | ₹163.11 cr |
| PAT Growth (YoY) | +82.5% |
| EPS | ₹47.01 |
The finding that reframes the whole dividend: half of the group's profit is not the cable business. Standalone PAT was ₹96.53 crore, but consolidated PAT was ₹163.11 crore. The ₹66.58 crore gap comes almost entirely from the company's share of profit in its associate Vindhya Telelinks and its joint venture Birla Furukawa Fibre Optics — roughly 50% of consolidated profit is equity-method income from those group entities, driven by an optical-fibre "super-cycle." The dividend, however, is declared on the standalone company, whose own operating margins remain thin (standalone EBITDA margin ~9.6%). Read the consolidated headline profit with that structure in mind.
Operating leverage. Revenue grew 25.5% and standalone PAT grew 68.5% — profit outran sales, a healthy sign of operating leverage. EBITDA margin improved 120 basis points to 9.6% (from 8.4%). But note that other income of ~₹111 crore (consolidated) and the associate/JV contribution flatter the bottom line; the core cable manufacturing business is a low-margin, working-capital-intensive operation.
Cash Flow Analysis
Operating Cash Flow (FY26)
₹63.48 cr
vs ₹175.62 cr in FY25 — down ~64%
Free Cash Flow (FY26)
−₹206.35 cr
OCF ₹63.48 cr − Capex ₹269.83 cr
The single most important cash finding: this dividend is not funded by free cash flow. In FY26 the company generated ₹63.48 crore of operating cash but spent ₹269.83 crore on capex, leaving free cash flow at negative ₹206 crore. Reported profit was ₹96.53 crore (standalone) but operating cash conversion was weak — roughly 36% of operating profit converted to cash (down from 109% in FY25). The gap was driven by a huge working-capital build: trade receivables rose ~₹301 crore and inventories ~₹212 crore, only partly offset by a ~₹432 crore rise in trade payables.
So how is the dividend paid? Through the balance sheet and borrowings, not current-year FCF. Net cash from financing was +₹191.91 crore, chiefly from a ₹329 crore net increase in borrowings. The actual dividend cash outflow booked in FY26 was only ₹13.88 crore (relating to the prior year), so it is a small line item — but the honest framing is that in a negative-FCF, rising-debt year, any distribution is effectively debt-supported at the margin.
Balance Sheet Strength
The balance sheet is being deliberately leveraged for growth. Borrowings jumped ~39% to ₹1,176 crore to fund the ₹550 crore capacity programme, and shareholders will be asked at the AGM to raise the borrowing limit to ₹4,500 crore (from ₹3,500 crore). On-hand cash is thin at ₹6.30 crore — less than the ₹15.61 crore dividend itself. The cushion instead sits in ₹365 crore of non-current investments (largely group holdings) and a CARE A/A1 credit profile. This is a company comfortable running an aggressive, debt-supported growth balance sheet, not a cash-rich dividend fortress.
Dividend Sustainability Analysis
The multi-metric picture. On earnings, the dividend is extraordinarily well covered — earnings are 6-10x the payout and the company retains 84-90% of profit. On cash, the story is weaker: FCF was negative and on-hand cash does not even cover one year's dividend. The reconciliation is simple — the payout is so small (₹15.61 crore against ₹96.53 crore standalone profit) that it survives comfortably regardless of the cash squeeze. Sustainability here is a function of restraint, not abundance: management has explicitly stated it is "maintaining a prudent and balanced approach towards conservation of resources." Investors expecting a large payout hike while the ₹550 crore capex runs are likely to be disappointed.
Peer Comparison
| Company | Div. Yield | Payout | ROE | ROCE |
|---|---|---|---|---|
| Universal Cables | ~0.37% | 9.6% (consol) | 8.9% | 11.7% |
| Finolex Cables | 0.77% | 18.4% | 16.3% | 21.4% |
| Polycab India | Low (~0.4%) | Not Independently Verified | 21.4% | 29.7% |
| KEI Industries | Low (~0.1%) | Not Independently Verified | 15.6% | 21.3% |
Peer metrics sourced from public market data and screeners; some payout figures left as "Not Independently Verified" rather than estimated. Universal Cables ROE/ROCE are consolidated FY26 figures.
Where UNIVCABLES sits. Against the organised-sector leaders, Universal Cables is the lowest-return name on the list — its ROE (8.9%) and ROCE (11.7%) trail Finolex, KEI and especially Polycab by a wide margin. Its dividend yield and payout ratio are also at the bottom. This is consistent with its profile: a smaller, more working-capital-heavy, debt-funded cable maker whose consolidated profitability leans heavily on associate/JV income rather than best-in-class core operations. Peers like Finolex are nearly debt-free and pay out a larger share of higher-quality earnings.
Promoter Impact Analysis
With the MP Birla Group promoters holding 61.89%, roughly ₹9.66 crore of the ₹15.61 crore flows to the promoter group, and about ₹5.95 crore to public and institutional shareholders. Because the payout is modest, the dividend is not being used as a large cash-extraction lever — the promoters are keeping most of the profit inside the company for the capex cycle, which aligns their interest with growth-oriented minority shareholders. One data point worth flagging: DII holding fell from 6.62% (Mar 2025) to 4.54% (Mar 2026), i.e. domestic institutions trimmed their stake even as the stock re-rated sharply.
Taxation Analysis
Since the abolition of Dividend Distribution Tax, dividends in India are taxable in the hands of the shareholder at their applicable income-tax slab rate. The company deducts TDS at 10% on dividends paid to a resident shareholder where the aggregate dividend from the company in a financial year exceeds the threshold (raised to ₹10,000 per the recent Finance Act changes; verify current-year threshold). TDS is a prepayment — the final liability is settled at the shareholder's slab rate when filing returns.
Worked example — investor holding 1,000 shares, 30% tax slab
| Gross dividend (1,000 × ₹4.50) | ₹4,500 |
| TDS at 10% | ₹0 (below ₹10,000 threshold) |
| Tax at 30% + 4% cess | ₹1,404 |
| Net dividend in hand | ₹3,096 |
| Effective post-tax yield (at CMP ₹1,220) | ~0.25% |
For a 30%-slab investor, roughly one-third of an already-small dividend goes to tax, leaving a post-tax yield of about a quarter of a percent. Tax outcomes vary by individual slab and residency; consult a tax adviser.
Key Risks
- Negative free cash flow and rising debt. FY26 FCF was −₹206 crore and borrowings rose ₹329 crore. A prolonged capex cycle with weak cash conversion could pressure the balance sheet and future distributions.
- Working-capital intensity. Receivables of ~₹1,144 crore and inventories of ~₹608 crore tie up enormous capital; any slowdown in collections directly hits operating cash.
- Earnings quality / dependence on associate income. ~50% of consolidated profit is equity-method income from Vindhya Telelinks and the fibre-optics JV. A reversal in the optical-fibre "super-cycle" would sharply cut consolidated profit without any change in the core cable business.
- Commodity and input-cost volatility. Copper, aluminium and fibre prices, plus Middle-East supply-chain disruption cited by management, can compress the already-thin ~9.6% EBITDA margin.
- Execution risk on capex. The ₹550 crore expansion has already seen delays (two of four CCV lines pushed to Aug-Sep 2026); cost or timing overruns would delay the return on invested capital.
- Demonstrated willingness to cut the dividend. The payout was cut to ₹1.00 in FY21; the dividend is not contractually protected in a downturn.
What To Monitor
- Operating cash flow and FCF turn. Watch whether OCF recovers toward FY25 levels once capex tapers and whether FCF turns positive after the ₹550 crore programme commissions in H2 FY27.
- Debtor days and cash conversion cycle. Track whether the improvement in working-capital days (69 to 48) holds, or whether receivables balloon again.
- Capex commissioning timeline. The two delayed CCV lines (Aug/Sep 2026) and the LV cable and Goa wire facilities — on-time ramp-up is the growth catalyst.
- Order book conversion. A ~₹3,025 crore pending order book (incl. the 400 kV EHV Middle-East order) — monitor execution and export share moving toward the 15% FY27 target.
- EBITDA margin trajectory. Management guides ~10% for FY27; sustained margin expansion would materially change the earnings-quality debate.
- Associate/JV contribution. Vindhya Telelinks and Birla Furukawa fibre-optic profitability — the swing factor in consolidated earnings.
Conclusion
Universal Cables' ₹4.50 final dividend is best read as a signal, not a payout. It is the highest in a decade and the fourth consecutive annual increase, backed by a record year — standalone revenue up 25.5% to ₹3,023 crore and consolidated profit up 82% to ₹163 crore. On earnings the payout is covered many times over.
But the analytical honesty a wire report skips is threefold: (1) the yield is a mere ~0.37%, so this is not an income stock; (2) free cash flow was negative ₹206 crore and cash on hand is below the dividend itself, so the payout is effectively debt-supported during a heavy capex year; and (3) roughly half of consolidated profit is associate/JV income, not core cable earnings. The dividend is sustainable precisely because management is keeping it small and prioritising a ₹550 crore growth programme. Positives (record growth, strong order book, re-rating) and negatives (thin core margins, rising debt, weak cash conversion, low returns versus peers) are laid out above — the decision is yours.
Frequently Asked Questions
What dividend has Universal Cables announced for FY2025-26?
What is the dividend yield of Universal Cables?
What is the record date for the Universal Cables dividend?
What is the ex-date for the dividend?
When will the dividend be paid?
Who is eligible for the dividend?
How is this dividend taxed?
Is the Universal Cables dividend sustainable?
What is Universal Cables' dividend history?
Why is the dividend so small relative to profits?
How much of the profit is actually from the cable business?
What is the promoter holding and how much dividend do they get?
How does Universal Cables compare with cable-sector peers?
Why did the stock rise so much even though the yield is low?
What should investors monitor after this dividend?
Disclaimer
This article is for informational and educational purposes only and does not constitute investment, financial, legal or tax advice, nor a recommendation to buy, sell or hold any security. Event facts (dividend, record date, AGM, payment) are drawn from the company's exchange filings dated 23-24 May 2026 and subsequent record-date intimation; financial figures are from the audited FY2025-26 results. Market prices, yields and peer metrics are indicative and sourced at the time of writing — the current market price must be verified against live NSE/BSE data before acting. The ex-date is inferred and unconfirmed. ShareBazaar Online and its authors are not liable for any loss arising from the use of this information. Please consult a SEBI-registered investment adviser and a qualified tax professional before making any investment decision.