
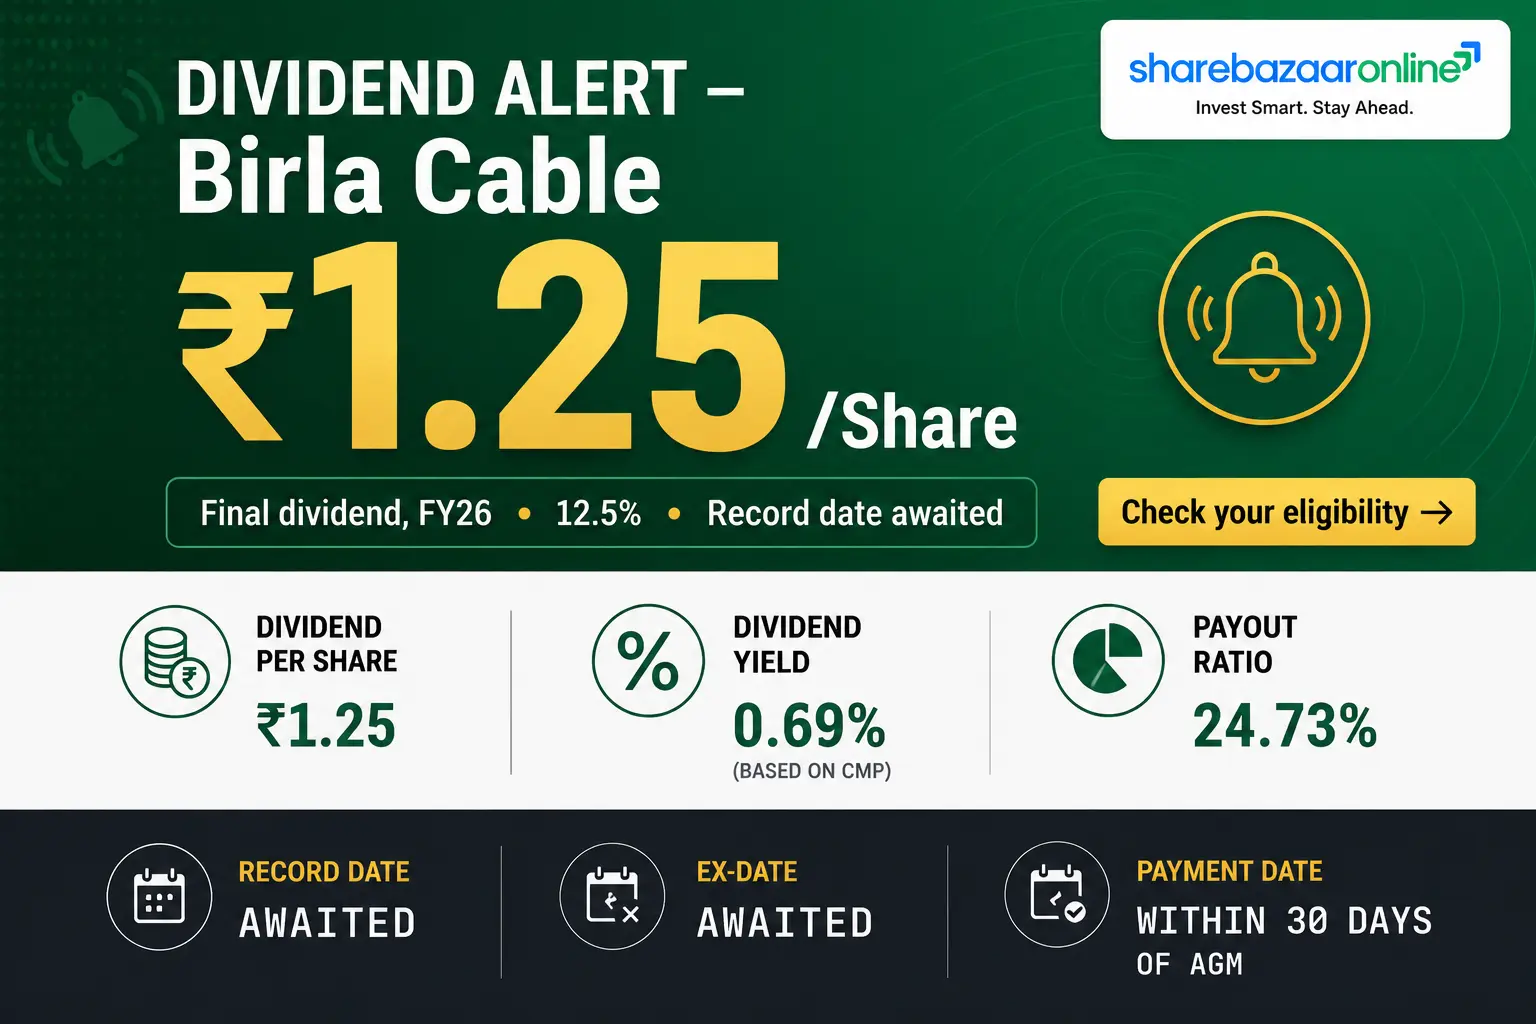
Dividend Snapshot
Company
Birla Cable Ltd
NSE / BSE
BIRLACABLE / 500060
Dividend Type
Final Dividend
Financial Year
FY2025–26
Dividend Per Share
₹1.25
Dividend %
12.50%
Face Value
₹10
Shares Outstanding
3,00,00,000
Total Dividend Outflow
₹3.75 crore
Payout Ratio (Consol.)
22.2%
Earnings Coverage
4.50x
Yield (announce ₹159.55)
0.78%
Announcement Date
22 May 2026
Record Date
Not Disclosed
Ex-Date
Not Disclosed
Payment
Within 30 days of AGM
Dividend Announcement Summary
At its board meeting on 22 May 2026 (4:30 PM to 6:30 PM), the Board of Directors of Birla Cable Limited recommended a final dividend of ₹1.25 per equity share — equal to 12.50% on the face value of ₹10 — for the year ended 31 March 2026, on 3,00,00,000 equity shares. The recommendation is subject to shareholder approval at the ensuing 34th Annual General Meeting. Once approved, the company has stated the dividend will be paid within 30 days of declaration, net of applicable tax deducted at source.
What "final" and "recommended" mean here
A final dividend is declared after the financial year closes. Because it is only recommended by the Board, it does not become a legal obligation until members vote it through at the AGM. Until then the amount, and the associated record/ex/payment dates, can still change. At the same meeting the Board also appointed Shri Somesh Laddha as Manager & CFO for three years.
Key Dates Timeline
We do not infer or estimate the ex-date. Record/ex dates are set close to the AGM and must be sourced from a later Regulation 42 filing before you act.
Dividend Yield Analysis
The yield is small either way
- • At the announcement-day price of ₹159.55 (22 May 2026), yield = 1.25 ÷ 159.55 = 0.78%.
- • At a later price of about ₹196 (early July 2026), yield falls to roughly 0.64%.
Market price must be re-verified against the live NSE/BSE quote on the day you read this; the share has swung between roughly ₹104 and ₹215 over 52 weeks.
Yield reality check
This low yield is not a sign of distress or a falling price. It reflects a deliberately conservative payout: the company kept 78% of its profit and paid out only 22%. A sub-1% yield means Birla Cable is a capital-appreciation / event stock (the merger), not an income stock.
Dividend History Analysis
| Financial Year | Dividend / Share | % | Notes |
|---|---|---|---|
| FY2025–26 | ₹1.25 | 12.5% | Current — recommended, AGM pending |
| FY2024–25 | Nil | — | Skipped |
| FY2023–24 | ₹1.75 | 17.5% | Paid Aug 2024 |
| FY2022–23 | ₹2.50 | 25% | Highest in the decade |
| FY2021–22 | ₹1.50 | 15% | — |
| FY2020–21 | ₹1.00 | 10% | — |
| FY2019–20 | Nil | — | Skipped |
| FY2018–19 | ₹2.00 | 20% | — |
| FY2017–18 | ₹1.00 | 10% | — |
| FY2015–16 | ₹1.00 | 10% | — |
Dividend history compiled from TipRanks and Trendlyne corporate-action records; per-share figures on unchanged ₹10 face value (no bonus/split adjustment needed).
Classification: Irregular / Cyclical Payer
Birla Cable has skipped dividends twice in the last seven years (FY20 and FY25) and the annual amount has bounced between ₹1.00 and ₹2.50. The current ₹1.25 is a cut from the ₹1.75 last paid — even though profit roughly tripled year-on-year. That is a red flag for anyone treating this as a dependable income stock, and it fits a company being restructured into a larger parent.
Financial Performance Analysis
| Metric (Consolidated) | FY25 | FY26 | Change |
|---|---|---|---|
| Revenue from Operations | ₹661.65 cr | ₹771.11 cr | +16.5% |
| Operating EBITDA | ₹32.69 cr | ₹46.96 cr | +43.7% |
| Net Profit (PAT) | ₹4.89 cr | ₹16.90 cr | +245.6% |
| EPS | ₹1.63 | ₹5.63 | +245% |
| EBITDA Margin | 4.94% | 6.09% | +115 bps |
Operating leverage worked in the company's favour
Revenue rose 16.5% but profit tripled. The reasons: margins expanded (EBITDA margin up from 4.94% to 6.09%), finance costs fell from ₹13.72 cr to ₹12.34 cr, and there was a deferred-tax credit of ₹1.81 cr. The low FY25 base also flatters the percentage.
Quality note on the tax line
The book effective tax rate is 25.3%, but the current (cash) tax alone is 33.3% of PBT — the reported profit is helped by a non-cash deferred-tax credit. Standalone and consolidated numbers are almost identical (the overseas subsidiary contributes only ₹0.08 cr of profit), so nothing is hidden below the consolidation line.
Cash Flow Analysis
The headline finding: profit was ₹16.90 cr, but operating cash flow was NEGATIVE ₹20.71 cr.
Reported profits are an accounting opinion; cash is a fact. In FY26 the two diverged sharply. Operating profit before working-capital changes was a healthy ₹47.13 cr, but almost all of it — and more — was swallowed by a ₹62.17 cr build-up in working capital.
Where the cash went
- • Trade receivables up ₹32.63 cr (receivables grew 21.4% vs revenue 16.5%)
- • Inventories up ₹27.77 cr
- • Debtor days: 92 → 96 days; inventory days: 28 → 37 days
Receivables rising faster than sales is an early quality signal — growth is being funded by extending credit to customers.
How the dividend is effectively funded
- • Free cash flow (OCF minus capex) = negative ₹23.42 cr
- • Short-term borrowings rose ₹25.35 cr (from ₹71.13 cr to ₹96.48 cr)
- • Year-end cash was just ₹0.65 cr
With negative FCF and a thin cash balance, the ₹3.75 cr payout is, in substance, funded by fresh short-term borrowing rather than the year's own cash generation.
Balance Sheet Strength
Total Equity
₹280.90 cr
Total Borrowings
₹131.32 cr
— Short-term
₹96.48 cr
— Long-term
₹34.84 cr
Cash + Bank
₹3.63 cr
Investments
₹51.20 cr
Net Debt
₹127.69 cr
D/E (borrowings)
0.47x
Reading the balance sheet
Gearing at 0.47x is moderate, and book value is ₹93.63 per share. But the mix is worth noting: debt is 73% short-term, cash is thin, and interest coverage is only 2.53x — Screener flags a low interest-coverage ratio. The company is not fragile, but it has limited cash buffer and leans on rolling short-term credit. That is precisely why the dividend is modest.
Dividend Sustainability Analysis
| Test | Result | Verdict |
|---|---|---|
| Earnings coverage (EPS/DPS) | 4.50x | Comfortable |
| Payout ratio | 22.2% | Conservative |
| FCF coverage | Negative | Fails this year |
| Cash + Bank vs outflow | 0.97x | Barely covered by pure cash |
| Cash + Bank + Investments vs outflow | 14.6x | Cushion exists |
| Debt trend while paying | Rising (ST +₹25.35 cr) | Watch |
Classification: Moderately Sustainable
The dividend is tiny relative to profit (4.5x earnings cover, 22% payout), so on an earnings basis it is easily affordable. The catch is that it is not backed by cash this year — FCF was negative and pure cash barely covers the payout, so the company is leaning on borrowings and its investment portfolio. Because the amount is so small (₹3.75 cr against ₹280 cr equity), the company can sustain it; but the negative-cash-flow backdrop is the reason we do not call it "Sustainable" outright.
Peer Comparison
| Company | Latest Dividend | Approx. Yield | ROE | ROCE |
|---|---|---|---|---|
| Birla Cable | ₹1.25 | ~0.78% | ~5% (3-yr avg) | ~5–6% |
| Universal Cables (MP Birla group) | ₹3.00 | <0.3% | ~6.7% | ~5.9% |
| Paramount Communications | Nil | — | ~9.8–10.9% | ~8.5–8.8% |
| HFCL (larger OFC leader) | Not Independently Verified | — | Not Independently Verified | Not Independently Verified |
The whole cable/telecom-equipment peer set is a low-yield, modest-return group — none of them are income stocks. Birla Cable's ~5% ROE trails Paramount's ~10%; its sister company Universal Cables pays more in rupee terms but yields even less. Blank cells are left blank rather than filled with unverified data.
Promoter Impact Analysis
Promoter Holding
66.35%
FII / DII
~0% / ~0.01%
Public
~33.64%
Promoter shares pledged
~6.28% (verify)
Promoter dividend income ≈ ₹2.49 crore
Public shareholders' share ≈ ₹1.26 crore
Distribution impact
With two-thirds ownership, roughly two-thirds of the ₹3.75 cr flows back to the promoter group. Institutional ownership is effectively nil, so this is a promoter- and retail-held stock. Importantly, Vindhya Telelinks — the company Birla Cable is merging into — is itself a promoter, holding about 19.33%. The merger and the dividend both ultimately serve the same controlling group, which is context worth keeping in mind.
Taxation Analysis
How dividends are taxed in India (since FY2020–21)
Dividends are taxable in the hands of the shareholder at your applicable income-tax slab rate — there is no separate Dividend Distribution Tax any more. The company deducts TDS under Section 194 at 10% before paying, if your total dividend from that company in the year crosses the prescribed threshold (raised to ₹10,000 in recent budgets; verify for your year). If your PAN is not updated, TDS can be 20%. NRIs face different (typically 20% plus surcharge/cess) rates.
Worked example A — generic (₹10/share)
| Holding | 1,000 shares |
| Dividend @ ₹10/share | ₹10,000 |
| TDS @ 10% | ₹1,000 |
| Tax @ 30% slab | ₹3,000 |
| Net in hand (after full tax) | ₹7,000 |
TDS is adjusted against your final ₹3,000 liability; you settle the ₹2,000 balance while filing.
Worked example B — Birla Cable actual (₹1.25/share)
| Holding | 1,000 shares |
| Dividend @ ₹1.25/share | ₹1,250 |
| TDS (below threshold) | ₹0 |
| Tax @ 30% slab | ₹375 |
| Net after tax | ₹875 |
Effective post-tax yield on a ₹159.55 cost ≈ 0.55% for a 30%-slab investor.
Key Risks
• Merger overhang: Birla Cable is being absorbed into Vindhya Telelinks (10:115 swap). Once effective, the standalone stock ceases to exist and holders become VTL shareholders — the future dividend policy will be VTL's, not Birla Cable's.
• Negative operating cash flow: FY26 OCF was −₹20.71 cr; sustained negative cash generation would force more borrowing.
• Working-capital intensity: Receivables (96 debtor days) and inventory are rising faster than sales, tying up cash.
• Thin liquidity + short-term debt reliance: Year-end cash of ₹0.65 cr with ₹96.48 cr of short-term borrowings and only 2.53x interest cover.
• Commodity / margin risk: Copper and optical-fibre input costs drive a single-segment cable business; margins are thin (6% EBITDA).
• Related-party concentration: Promoter (incl. VTL at ~19.33%) holds 66.35%; ~6.28% of promoter holding is reported as pledged (verify).
What To Monitor
• NCLT / exchange progress on the merger and the exact record date for the 10:115 share swap.
• The Regulation 42 filing that will finally fix this dividend's record date and ex-date.
• Operating cash flow in FY27 — does it turn positive, or does the working-capital drain persist?
• Debtor days and inventory days — whether receivables growth re-aligns with revenue growth.
• Short-term borrowings and interest cover — further increases would tighten the balance sheet.
• Insider action in Vindhya Telelinks post-merger — buying vs selling signals how promoters view the combined entity.
Conclusion
Positives
- • Profit tripled; EBITDA margin expanded 115 bps
- • Very low payout (22%) and 4.5x earnings cover
- • Moderate gearing (0.47x); book value ₹93.63
- • Investment cushion of ₹51 cr behind a ₹3.75 cr payout
Negatives & watch-points
- • Negative operating & free cash flow this year
- • Dividend effectively funded by fresh short-term debt
- • Dividend cut vs the last ₹1.75, and two skip years
- • Merger means the stock will cease to exist as is
In short: this is a small, easily-affordable dividend from a company in the middle of being folded into its larger parent. The profit story looks strong on paper, but the cash-flow story is weak, and the sub-1% yield means income is not the reason anyone owns this. We present the facts on both sides; the decision is yours.