
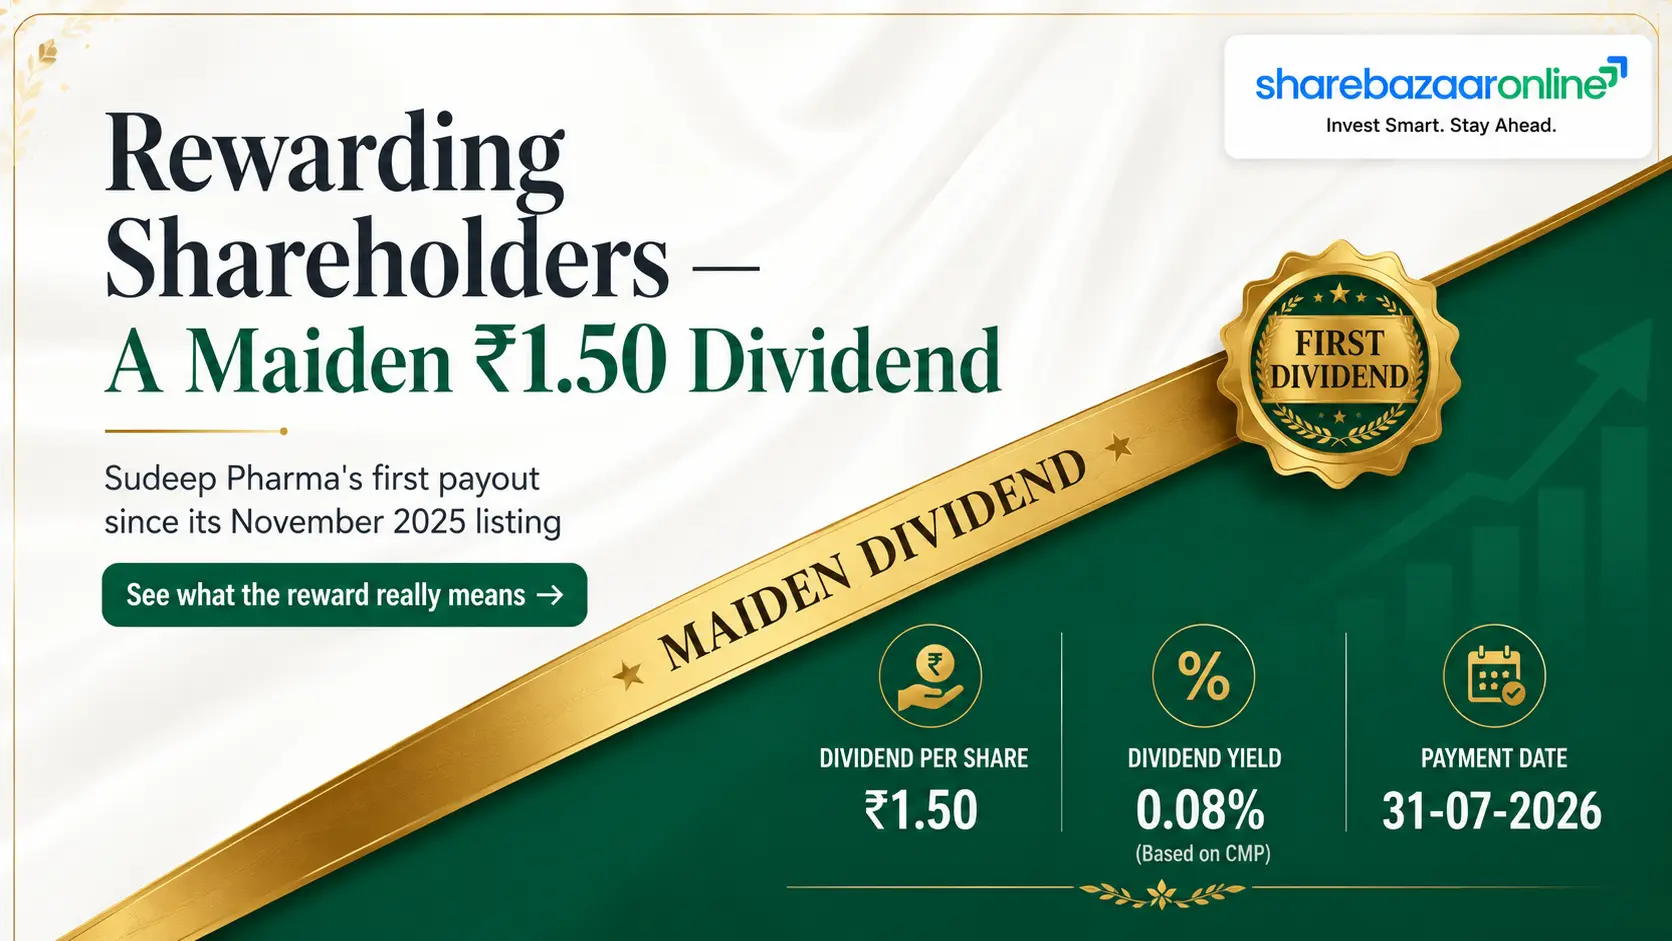
Dividend Snapshot
The one-line takeaway: This is a token maiden payout. The ₹1.50 dividend is symbolic — a yield of roughly 0.18% and under 10% of consolidated profit. The real story sits underneath: strong headline growth that is largely acquisition-driven, a core standalone business that shrank, and operating cash flow that converted only 40 paise of every rupee of profit into cash.
Dividend Announcement Summary
At its board meeting on Thursday, 21 May 2026, the Board of Directors of Sudeep Pharma Limited recommended a final dividend of ₹1.50 per equity share (150% of the ₹1 face value) for the year ended 31 March 2026. The recommendation is subject to shareholder approval at the forthcoming 37th Annual General Meeting.
This is a meaningful milestone: Sudeep Pharma only listed on the NSE and BSE on 28 November 2025 at an IPO price of ₹593. FY2025-26 is therefore its first dividend declaration as a publicly listed company. The board also approved the FY26 audited results, the appointment of a cost auditor and secretarial auditor, alongside the dividend proposal.
The dividend will be paid out of standalone distributable profits. Company-level (standalone) net profit for FY26 was ₹107.58 Cr, comfortably covering the ₹16.94 Cr outflow. Ratification at the AGM on 4 August 2026 is procedural but legally required before payment can be released.
Key Dates Timeline
Board Announcement
21 May 2026
Dividend recommended by Board (company-disclosed)
Record Date
23 Jul 2026
Company-disclosed (Reg. 42 intimation). Now closed.
Ex-Date
23 Jul 2026*
*Inferred under T+1 settlement (ex-date aligns with record date). Not separately confirmed by company.
37th AGM (Approval)
04 Aug 2026
Shareholder ratification via video conferencing
Expected Payment Date
07 Aug 2026
Per exchange corporate-action disclosure. Payment follows AGM approval and is subject to TDS.
Dividend Yield Analysis
Yield at Latest Price (~₹824)
~0.18%
₹1.50 ÷ ₹824 × 100. Live price must be re-verified before publishing.
Yield at Announcement (~₹673)
~0.22%
₹1.50 ÷ ₹673 × 100 (price around 21 May 2026)
Yield reality check. A sub-0.2% yield is negligible for an income-seeking investor. It is not the result of a falling share price or a distressed business — quite the opposite. The stock has re-rated sharply since listing (trading well above its ₹593 IPO price), and the company is deliberately retaining almost all of its earnings to fund a large capex and diversification programme. In short, the low yield reflects a growth-and-retention strategy, not weakness. Anyone buying Sudeep Pharma for dividends is buying the wrong stock; the thesis here is capital appreciation, not income.
Dividend History Analysis
| Financial Year | Dividend / Share | Type | Note |
|---|---|---|---|
| FY2025-26 | ₹1.50 | Final | First dividend as a listed company |
| FY2024-25 & earlier | Not Disclosed by Company | — | Company was unlisted (private) until Nov 2025 |
Payer classification: Early-Stage / Maiden Payer. As a company that listed only in November 2025, Sudeep Pharma has no track record of listed-company dividends. There is therefore no basis yet to judge consistency, growth trend, or cut/suspension history. Whether this becomes a "consistent payer" depends entirely on how the next two-to-three years unfold, especially as the battery-materials capex programme competes for cash. Treat the ₹1.50 as a signal of intent, not a policy.
Financial Performance Analysis
| Consolidated (₹ Cr) | FY26 | FY25 | Growth |
|---|---|---|---|
| Revenue from Operations | 642.26 | 501.99 | +27.9% |
| EBITDA (approx) | 221.90 | Not Independently Verified | — |
| Profit Before Tax | 228.07 | 182.85 | +24.7% |
| Profit After Tax | 174.28 | 138.73 | +25.6% |
| EPS (restated) | ₹15.50 | ₹12.79 | +21.2% |
The finding wire services miss — growth is largely inorganic. The headline +27.9% consolidated revenue growth is flattering. Look at the standalone (core parent-company) numbers: standalone revenue actually fell 5.1%, from ₹356.73 Cr to ₹338.51 Cr. The consolidated jump is driven substantially by the acquisition of Nutrition Supplies & Services (Ireland) Ltd, consolidated from 22 May 2025, and the fast-growing Speciality Ingredients segment. This is real growth, but investors should understand it is acquisition-led, not purely organic.
Operating leverage. Consolidated EBITDA margin was a healthy ~34.5%. However, on a full-year basis the Speciality Ingredients segment grew ~63% (₹171.5 Cr → ₹279.6 Cr) while the core Pharmaceutical, Food & Nutrition segment was roughly flat, confirming that the mix shift and the acquired business are doing the heavy lifting. Note also that reported EPS has been restated for the conversion of 1.41 crore preference shares (CCPS) into equity, so year-on-year EPS is like-for-like.
Cash Flow Analysis
Reported profits are opinions; cash is fact — and here the two diverge sharply. Consolidated PAT was ₹174.28 Cr, but net operating cash flow was only ₹69.55 Cr. That is a cash conversion of just 40% (40 paise of cash for every ₹1 of profit). The gap is explained by a ₹112 Cr working-capital drag — chiefly a ₹79.9 Cr build-up in inventories and ₹21.3 Cr in receivables. This is common for a company scaling fast and integrating an acquisition, but it is the single most important thing headline coverage ignores.
Consolidated Free Cash Flow
-₹15.8 Cr
OCF ₹69.6 Cr minus PPE capex ₹85.4 Cr. Negative before even counting ₹32.8 Cr of leasehold land and ₹128.6 Cr for the acquisition.
Standalone Free Cash Flow
+₹29.5 Cr
Standalone OCF ₹96.0 Cr minus capex ₹66.6 Cr. This is the pool the dividend is actually paid from — it covers the ₹16.94 Cr outflow ~1.7x.
How is the dividend funded? Not by consolidated free cash flow (which is negative). It is funded by a combination of standalone operating cash flow and the company's substantial cash and deposit reserves, which include ₹75.81 Cr of still-unutilised IPO proceeds parked in bank deposits. Because the dividend is tiny relative to these reserves, affordability is not in question — but investors should recognise the payout is being made while the group is cash-flow negative at the consolidated level due to heavy investment.
Balance Sheet Strength
The balance sheet is strong and lightly geared — net debt is a trivial 0.15x EBITDA, and the group carries ₹114.65 Cr of cash and deposits. Two items warrant a flag: (1) ₹68.24 Cr of goodwill sits on the books from the Ireland (NSS) acquisition, and the purchase-price allocation is still provisional — final numbers were due before 30 June 2026 and could shift; (2) roughly ₹75.81 Cr of IPO cash remains undeployed, earmarked for machinery at the Nandesari facility. Debt is not rising to fund the dividend.
Dividend Sustainability Analysis
Overall Assessment
Sustainable (Well-Covered, but Token-Sized)
Earnings Coverage
10.3x consol · 6.4x standalone
EPS of ₹15.50 vs ₹1.50 payout — enormous headroom.
Cash Coverage
6.8x
₹114.65 Cr cash+bank vs ₹16.94 Cr outflow.
FCF Coverage
1.7x standalone · negative consol
The one metric that is not comfortable — group FCF is negative due to capex.
Balance Sheet
Net Debt/EBITDA 0.15x
No leverage stress; dividend not debt-funded.
Verdict. At ₹1.50 the dividend is trivially affordable and clearly sustainable in the narrow sense — earnings, cash and the balance sheet all cover it many times over. The nuance is that sustainability of the amount and sustainability of growth in the amount are different questions. With consolidated FCF currently negative and a ₹300 Cr battery-materials capex commitment ahead, do not assume the dividend will scale quickly. A stable-to-modestly-rising token payout is the realistic base case.
Peer Comparison
| Metric (Sudeep Pharma, Consol FY26) | Sudeep Pharma | Excipients / Specialty-Ingredient Peers |
|---|---|---|
| Dividend Yield | ~0.18% | Not Independently Verified |
| Payout Ratio | ~9.7% | Not Independently Verified |
| ROE | ~19.6% | Not Independently Verified |
| EBITDA Margin | ~34.5% | Not Independently Verified |
| Net Debt / EBITDA | 0.15x | Not Independently Verified |
Sudeep Pharma occupies a niche — mineral-based pharmaceutical excipients and food/nutrition specialty ingredients — with few clean, directly comparable Indian listed peers. Rather than populate this table with mismatched names, we have deliberately left peer cells as "Not Independently Verified". What can be said with confidence: its ~34.5% EBITDA margin and ~19.6% ROE are strong for a specialty ingredients maker, while its sub-0.2% yield places it firmly among low-yield, growth-oriented names rather than income stocks. Editors should slot in verified peer figures (e.g. from screener.in) before publication.
Promoter Impact Analysis
Promoter Holding
76.15%
As of Mar 2026 (FII ~1.6%, DII ~18.1%, Public ~4.2%)
Promoter Dividend Income
~₹12.90 Cr
76.15% of the ₹16.94 Cr total outflow
With promoters (the Bhayani family and group entities) holding 76.15%, roughly ₹12.90 Cr of the ₹16.94 Cr dividend flows to the promoter group, leaving about ₹4.04 Cr for non-promoter shareholders (FIIs, DIIs and the public). Because the payout is so small relative to profits, this is not a case of a controlling family extracting cash — retention dominates. The distribution is proportionate to ownership and consistent across all shareholders; there is no differential class benefit.
Taxation Analysis
Since April 2020, dividends in India are taxable in the hands of the shareholder at their applicable income-tax slab rate — there is no longer any Dividend Distribution Tax at the company level. The company deducts TDS at 10% for resident shareholders only if total dividend from that company exceeds ₹5,000 in the financial year (20% if PAN is not furnished). TDS deducted can be adjusted against your final tax liability.
Worked Example — Investor holding 1,000 shares
| Shares held | 1,000 |
| Dividend per share | ₹1.50 |
| Gross dividend | ₹1,500 |
| TDS @ 10% | ₹0 (below ₹5,000 threshold) |
| Tax @ 30% slab (payable by investor) | ₹450 |
| Net dividend in hand | ₹1,050 |
| Effective post-tax yield (on ~₹824) | ~0.13% |
Illustrative for a 30%-slab investor. Even though no TDS is withheld here (dividend under ₹5,000), the ₹1,500 is still added to taxable income and taxed at the investor's slab. Consult a tax advisor for your situation.
Key Risks
1. Weak cash conversion
OCF converted just 40% of PAT in FY26; a ₹112 Cr working-capital build could persist if inventory/receivables keep rising with scale.
2. Heavy, unproven capex pivot
A ~₹300 Cr push into battery materials (LFP/iron phosphate) at Dahej is capital-intensive, competitive and outside the core excipients competency.
3. Acquisition & goodwill risk
₹68.24 Cr of goodwill from the Ireland (NSS) deal is on a provisional purchase-price allocation; final numbers could change and integration may disappoint.
4. Core (standalone) revenue decline
Standalone revenue fell ~5.1% in FY26; consolidated growth leans on the acquired business rather than organic core expansion.
5. Rich valuation
The stock trades at a high trailing P/E and several times book value; any growth stumble carries meaningful de-rating risk.
6. Export & currency exposure
A large share of business is international (100+ countries, overseas subsidiaries), exposing margins to FX swings and global demand cycles.
What To Monitor
1. Cash conversion trend
Watch OCF/PAT in coming quarters — a move back toward 70%+ would confirm the FY26 working-capital drag was one-off, not structural.
2. Battery-materials execution
Dahej Phase-1 (25,000 MT) commissioning targeted by April 2027; track capex spend, order book conversion and margins.
3. IPO-proceeds deployment
₹75.81 Cr still undeployed for Nandesari machinery — monitor utilisation and resulting capacity/revenue.
4. Standalone organic recovery
Look for the core standalone business to return to growth rather than relying on acquisitions.
5. Final PPA / goodwill
The finalised purchase-price allocation for NSS Ireland will confirm the true goodwill figure and any fair-value adjustments.
6. Dividend policy signalling
Whether the ₹1.50 is repeated or raised next year will reveal management's intent on capital return vs reinvestment.
Conclusion
Sudeep Pharma's maiden ₹1.50 dividend is best read as a gesture of shareholder friendliness from a newly-listed, growth-focused company — not as an income opportunity. On the positive side: profits grew strongly (+25.6% consolidated PAT), margins are high (~34.5% EBITDA), the balance sheet is nearly debt-free (net debt/EBITDA 0.15x), and the payout is covered many times over by earnings and cash.
On the cautious side: the yield is a negligible ~0.18%, consolidated free cash flow was negative, cash conversion was a weak 40%, the impressive top-line growth was substantially acquisition-driven (with standalone core revenue actually falling), and the company is embarking on a large, unproven capital programme in battery materials. Combined with a rich valuation, the investment case rests on execution of growth ambitions, not on the dividend. We present the evidence; the decision is yours.
Frequently Asked Questions
What dividend has Sudeep Pharma announced for FY2025-26?
What is the dividend yield?
What is the record date for the dividend?
What is the ex-date?
When will the dividend be paid?
Who is eligible to receive the dividend?
How is this dividend taxed?
Is the dividend sustainable?
What is Sudeep Pharma's dividend history?
What should investors monitor going forward?
Why is the consolidated revenue growth so much higher than standalone?
How much of the dividend goes to promoters?
Does Sudeep Pharma have much debt?
Is Sudeep Pharma a good stock for dividend income?
What was the payout ratio?
Disclaimer
This article is for informational and educational purposes only and does not constitute investment, financial, legal or tax advice, nor a recommendation to buy, sell or hold any security. Figures are drawn from Sudeep Pharma Limited's audited FY2025-26 results (board meeting dated 21 May 2026) and publicly available exchange disclosures; certain data points (current market price, peer figures) require independent verification against live NSE/BSE sources before acting. Dividend, record and payment dates are subject to shareholder approval and company/exchange confirmation; the ex-date shown is inferred from T+1 settlement logic. Securities markets carry risk and past performance is not indicative of future results. Consult a SEBI-registered investment adviser and a qualified tax professional before making any decision. ShareBazaar Online and its authors accept no liability for actions taken based on this content.