
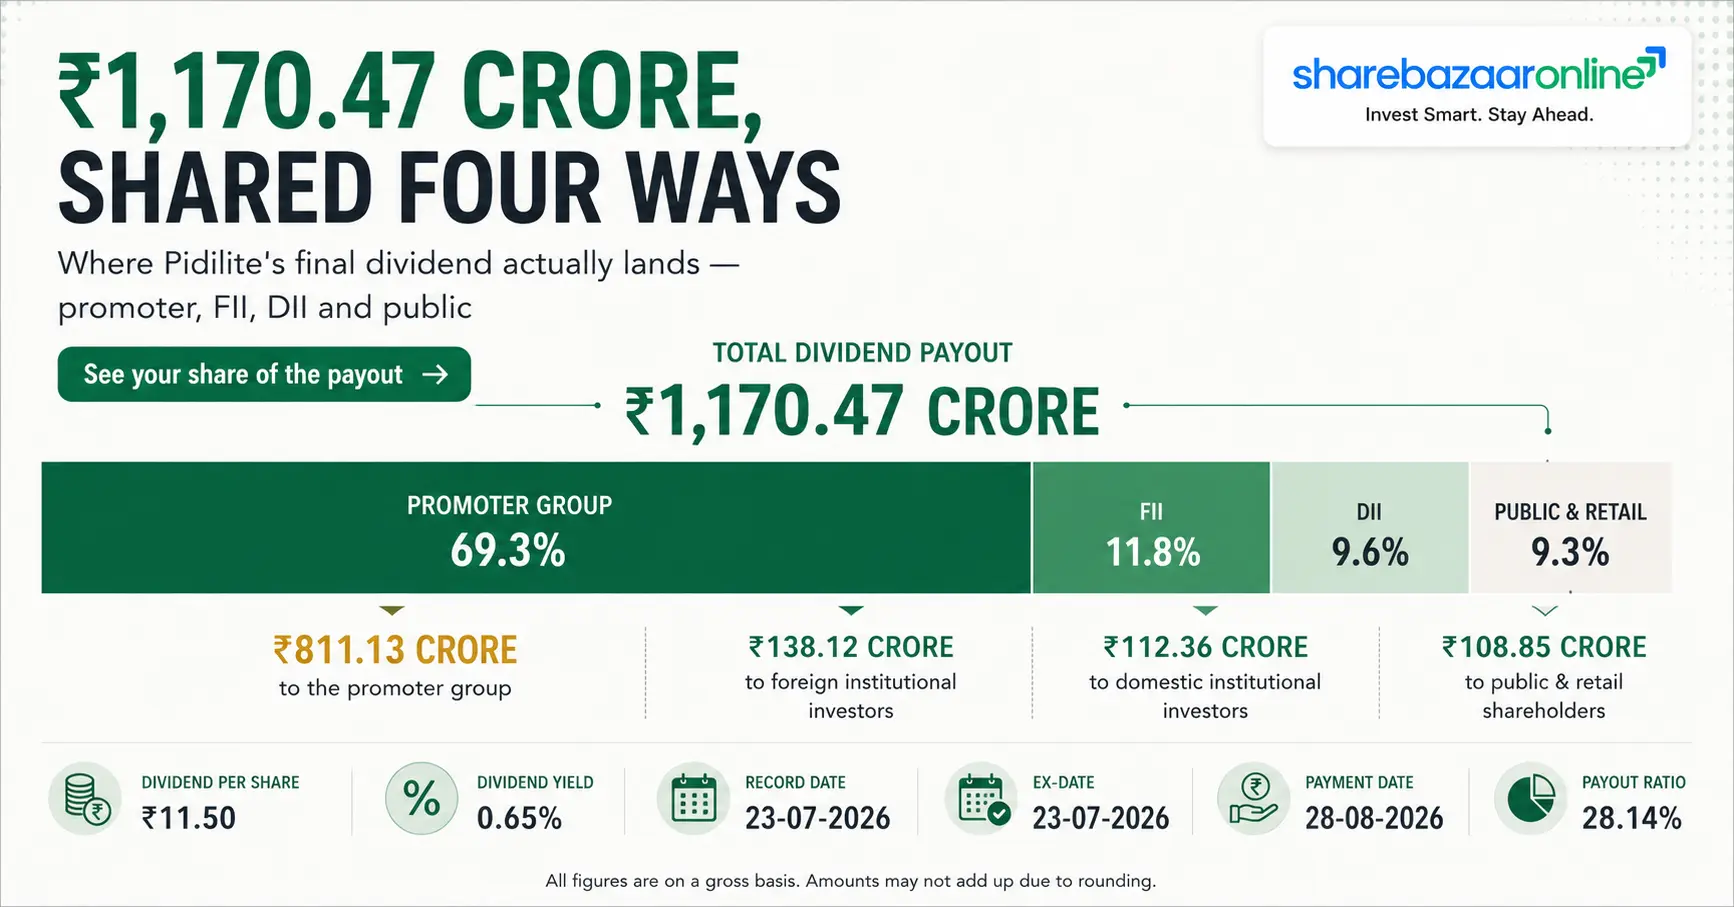
Dividend Snapshot
Company & Security Details
Dividend Details
Yield & Outflow
Sustainability Verdict
Pidilite ends FY26 with roughly ₹4,218.73 crore of cash, bank balances and current investments against gross borrowings of only ₹105.91 crore. Free cash flow of about ₹2,235.73 crore covers the entire year's dividend 1.33 times over.
Dividend Announcement Summary
What The Board Actually Approved
At a board meeting held on 7th May 2026 which ran from 2:30 p.m. to 7:30 p.m., the Board of Directors of Pidilite Industries Limited approved the audited standalone and consolidated financial results for the year ended 31st March 2026 and recommended a final dividend of ₹11.50 per equity share of ₹1 face value.
The word "recommended" matters. A final dividend is only a proposal until shareholders vote on it. The company has stated that the dividend will be paid within 30 days from the date of the 57th Annual General Meeting, subject to shareholder approval at that meeting.
The statutory auditors, B S R & Co. LLP, issued an audit report with an unmodified opinion on both the standalone and consolidated annual results. An unmodified opinion means the auditor found no material problem worth flagging — the cleanest outcome available.
This Is The Second Payout Of FY26
Note 8 to the results is easy to miss but changes the whole picture. The ₹11.50 final dividend is in addition to a special interim dividend of ₹10 per share (pre-bonus) that was already paid on 13th August 2025. FY26 is therefore a two-payout year, not a single-dividend year.
The Bonus Issue Changes The Maths
On 24th September 2025 the company allotted 50,88,57,016 bonus shares in a 1:1 ratio, doubling the share count from 50.88 crore to 101.78 crore. Every ₹1 declared today is therefore paid on twice as many shares as a year ago. A headline that reads "₹11.50 versus ₹20 last year" is wrong unless it is adjusted for this.
Bonus-Adjusted Comparison (The Honest Number)
| Measure | FY2024-25 | FY2025-26 | Change |
|---|---|---|---|
| Dividend per share as declared | ₹20.00 (pre-bonus base) | ₹10.00 interim (pre-bonus) + ₹11.50 final (post-bonus) | Not comparable |
| Dividend per share, bonus-adjusted | ₹10.00 | ₹16.50 | +65.0% |
| Total cash paid to shareholders | ₹1,017.65 Crore | ₹1,678.84 Crore | +65.0% |
| Consolidated PAT (owners) | ₹2,076.24 Crore | ₹2,448.92 Crore | +17.95% |
Read this carefully: the cash returned to shareholders in FY26 grew 65% while profit grew 17.95%. Dividend growth ran roughly 3.6 times faster than earnings growth. That is a deliberate balance sheet decision, not an earnings story, and it is examined in the Sustainability section below.
Key Dates Timeline
| Event | Date | What It Means For You |
|---|---|---|
| Announcement Date | 07-05-2026 | Board recommended the dividend along with FY26 audited results |
| Last Buying Day (cum-dividend) | 22-07-2026 | Buy on or before this day to qualify, under the T+1 settlement cycle |
| Ex-Dividend Date | 23-07-2026 | Buy on or after this day and the dividend goes to the seller, not you |
| Record Date | 23-07-2026 | The register of members is frozen to decide who gets paid |
| Remote E-Voting Window | 31-07-2026 to 03-08-2026 | Shareholders vote on the dividend resolution |
| 57th AGM | 04-08-2026 | Held via video conferencing; dividend gets formal approval here |
| Payment Date | 07-08-2026 onward | Payable on or after this date, within 30 days of the AGM |
Record date, ex-date, AGM date and payment window sourced from company exchange filings as reported by NSE-filing coverage; not stated in the 7th May 2026 board outcome letter itself.
Why Ex-Date And Record Date Are The Same
India moved to a T+1 settlement cycle, meaning a trade settles one working day after it happens. Because of that, the ex-date and the record date now fall on the same calendar day. Older articles that say "ex-date is two days before record date" are describing the pre-2023 system and are out of date.
The 78-Day Gap Nobody Talks About
There are 78 days between the record date (23rd July 2026) and the last possible payment date (roughly 3rd September 2026, being 30 days after the AGM) counted from announcement. Your money is committed on the record date but sits with the company until payout. For a ₹11.50 dividend that delay costs you roughly ₹0.13 per share in foregone interest at a 6% annual rate — small, but real.
Dividend Yield Analysis
Every Yield Number, Computed
| Yield Measure | Formula | Result |
|---|---|---|
| Announcement-date yield (final only) | ₹11.50 ÷ ₹1,450.40 | 0.79% |
| Current yield (final only) | ₹11.50 ÷ ₹1,580.10 | 0.73% |
| Full-year FY26 yield, bonus-adjusted | ₹16.50 ÷ ₹1,580.10 | 1.04% |
| Yield at 52-week low | ₹16.50 ÷ ₹1,259.00 | 1.31% |
| Yield at 52-week high | ₹16.50 ÷ ₹1,626.70 | 1.01% |
Announcement-date price is the NSE close of 7th May 2026 (₹1,450.40, being the previous close referenced in 8th May market reports). Latest price of ₹1,580.10 is the NSE close of 13th July 2026. 52-week range ₹1,259.00 to ₹1,626.70. All prices sourced from market data providers.
Yield Reality Check: Why It Is Under 1%
A yield below 1% on a company paying out roughly 68.6% of its profit looks contradictory. It is not. The explanation is entirely on the price side.
Pidilite trades at a trailing P/E in the region of 65 times and a price-to-book near 15 times. When the market pays 65 rupees for every rupee of annual profit, even a generous share of that profit converts into a tiny percentage of the price. The low yield is a valuation outcome, not a stinginess outcome.
Which Of The Four Causes Applies Here?
- Strong dividend growth? Yes — bonus-adjusted payout rose 65% year on year.
- Falling share price? No — the stock is up roughly 7.9% over 52 weeks and 25% off its April 2026 low.
- One-time special dividend? Partly — the ₹10 interim in August 2025 was explicitly labelled "special" and may not repeat.
- Weak business masking a high yield? No — revenue grew 11.11% and EBITDA grew 16.81%.
Verdict: this is a genuine, earnings-supported dividend increase that simply looks small because the stock is expensive.
The Special Dividend Caveat
If the August 2025 interim is stripped out as a genuine one-off, the recurring FY26 dividend is just the ₹11.50 final, giving a repeatable yield of 0.73% rather than 1.04%. Investors modelling forward income should treat 0.73% as the base case and anything above it as upside. This is the single most common mistake made when reading Pidilite's FY26 payout.
Dividend History Analysis
Ten-Year Dividend Record (As Declared)
| Financial Year | Dividend Per Share | Type | Year-on-Year Change |
|---|---|---|---|
| FY2016-17 | ₹4.75 | Final | — |
| FY2017-18 | ₹6.00 | Final | +26.3% |
| FY2018-19 | ₹6.50 | Final | +8.3% |
| FY2019-20 | ₹7.00 | Interim (paid March 2020; no final declared) | +7.7% |
| FY2020-21 | ₹8.50 | Final | +21.4% |
| FY2021-22 | ₹10.00 | Final | +17.6% |
| FY2022-23 | ₹11.00 | Final | +10.0% |
| FY2023-24 | ₹16.00 | Final | +45.5% |
| FY2024-25 | ₹20.00 | Final | +25.0% |
| FY2025-26 | ₹10.00 special interim (pre-bonus) + ₹11.50 final (post-bonus) | Interim + Final | +65.0% adjusted |
Dividend amounts up to FY25 are as originally declared on the pre-bonus share base. The 1:1 bonus issue of September 2025 means FY26 and later figures sit on a doubled share count. Historical per-share figures sourced from public dividend records and company filings; FY24 and FY25 amounts independently cross-checked against dividend cash outflows disclosed in the company's own cash flow statements (₹813.38 crore and ₹1,017.65 crore respectively).
Consistency Assessment
- Dividend cuts: None in ten years.
- Dividend suspensions: None. FY20 is the only unusual year — the payout came as an interim in March 2020 rather than a post-AGM final, a timing choice made as COVID uncertainty arrived.
- Growth streak: Ten consecutive years of higher declared dividends.
- Ten-year growth rate: from ₹4.75 to ₹16.50 bonus-adjusted is a compound rate of roughly 13.3% a year.
- Special dividends: One in the ten-year window — the ₹10 interim of August 2025.
The Trend Break To Watch
For the seven years to FY23, dividend growth averaged in the low teens and tracked earnings closely. From FY24 onward the pattern changed sharply: +45.5%, then +25.0%, then +65.0%.
Over the same three years, consolidated profit grew far more modestly. This is the company converting a large accumulated cash pile into shareholder returns. It is welcome, but it is a one-way trip — the balance sheet can only be re-based once, and future dividend growth will have to come from earnings growth instead.
Financial Performance Analysis
Consolidated Full-Year Results (₹ Crore)
| Particulars | FY2025-26 | FY2024-25 | Growth |
|---|---|---|---|
| Revenue from Operations | 14,600.83 | 13,140.31 | +11.11% |
| Other Income | 266.18 | 247.22 | +7.67% |
| Total Expenses | 11,530.76 | 10,536.63 | +9.43% |
| EBITDA (computed) | 3,519.00 | 3,012.51 | +16.81% |
| Depreciation & Amortisation | 394.71 | 358.48 | +10.11% |
| Finance Costs | 54.22 | 50.35 | +7.69% |
| Exceptional Items | 13.71 | 24.92 | -44.98% |
| Profit Before Tax | 3,320.17 | 2,822.70 | +17.62% |
| Profit After Tax (total) | 2,470.72 | 2,096.17 | +17.87% |
| PAT attributable to owners | 2,448.92 | 2,076.24 | +17.95% |
| Basic EPS (₹, bonus-adjusted) | 24.07 | 20.41 | +17.93% |
EBITDA computed as profit before exceptional items, share of associates and tax, plus depreciation and finance costs, less other income. Every other line is taken directly from the audited consolidated statement filed on 7th May 2026.
Operating Leverage: Working In The Right Direction
Operating leverage simply means whether profits grow faster than sales. Here they do, and clearly:
- Revenue growth: +11.11%
- EBITDA growth: +16.81%
- PAT growth: +17.87%
EBITDA margin expanded from 22.93% to 24.10%, a gain of 117 basis points. Every rupee of extra sales carried more profit than the rupee before it.
Where The Margin Gain Came From
- Materials cost fell as a share of sales. Raw materials, traded goods and inventory movement together came to 44.44% of revenue versus 45.63% a year ago — a 119 basis point gross margin gain.
- Employee cost held flat in ratio terms at 13.30% of revenue versus 13.25%, despite absorbing ₹62.84 crore of one-time provisions under the new Labour Codes.
- Other expenses were disciplined at 18.16% of revenue versus 18.19%.
- Effective tax rate slipped slightly to 25.58% from 25.74%.
Segment Performance
| Segment | FY26 Revenue | Growth | Margin |
|---|---|---|---|
| Consumer & Bazaar | ₹11,573.75 Cr | +11.38% | 30.64% |
| Business to Business | ₹3,211.10 Cr | +7.21% | 16.48% |
| Others | ₹60.55 Cr | +6.56% | -15.33% |
Consumer & Bazaar — the Fevicol, Fevikwik, M-Seal and Dr. Fixit engine — is 79.3% of revenue and earns nearly double the B2B margin. The dividend is effectively funded by this one segment.
The Overseas Drag (Negative Finding)
The auditor's Other Matters note discloses that 32 subsidiaries together contributed revenue of ₹1,347.42 crore and net profit after tax of only ₹116.06 crore before consolidation adjustments.
That is a net margin of 8.6% against the group's 16.92%. The subsidiary portfolio is running at roughly half the profitability of the parent. Associates and the joint venture added a further ₹3.49 crore, while two other associates contributed a loss of ₹5.87 crore. On top of that, exceptional items of ₹13.71 crore in FY26 and ₹24.92 crore in FY25 were impairments on associate investments and loans. Small in absolute terms, but a recurring pattern worth noting.
Cash Flow Analysis
Profit Is An Opinion. Cash Is A Fact.
A dividend is paid in cash, not in accounting profit. So the only question that matters is whether the cash actually showed up. For Pidilite in FY26, it did.
Consolidated Cash Flow Summary (₹ Crore)
| Particulars | FY2025-26 | FY2024-25 |
|---|---|---|
| Operating cash flow before working capital | 3,741.64 | 3,220.13 |
| Taxes paid | (862.13) | (732.72) |
| Net Operating Cash Flow (OCF) | 2,828.50 | 2,286.63 |
| Capital expenditure | (592.77) | (452.34) |
| Free Cash Flow (OCF less capex) | 2,235.73 | 1,834.29 |
| Dividends actually paid during the year | (1,526.01) | (813.38) |
| Net investing cash flow | (1,224.10) | (1,541.69) |
| Net financing cash flow | (1,672.77) | (917.94) |
Free cash flow computed as operating cash flow less payments for property, plant, equipment, right-of-use assets, intangibles and capital work-in-progress. FY25 free cash flow of ₹1,834.29 crore computed on the same basis.
Test One: Does Cash Follow Profit?
Operating cash flow of ₹2,828.50 crore against profit after tax of ₹2,470.72 crore gives a ratio of 1.14 times.
Anything above 1.0 means the company collected more cash than it booked as profit. Cash conversion measured against EBITDA is 80.4%. This is a clean pass. There is no gap between reported earnings and real money.
Test Two: Receivables Versus Revenue (Negative Finding)
This is the one number in the results that deserves a red flag.
- Revenue growth: +11.11%
- Trade receivables growth: +20.42% (₹1,811.15 Cr to ₹2,181.10 Cr)
- Debtor days: 54.5 days versus 50.3 days
Receivables grew almost twice as fast as sales and absorbed ₹357.54 crore of cash. Inventories, by contrast, grew only 3.12% — so this is not a general working capital blow-out, it is specifically a collections issue. It may reflect channel financing to push volume amid price increases. It has not damaged cash flow this year, but if the gap persists into FY27, it will.
Test Three: What Is Actually Funding This Dividend?
| Possible Funding Source | Evidence | Verdict |
|---|---|---|
| Current earnings | FCF ₹2,235.73 Cr covers full-year dividend ₹1,678.84 Cr | YES — primary source |
| Cash reserves | Liquid resources rose from ₹3,498.17 Cr to ₹4,218.73 Cr after paying ₹1,526.01 Cr of dividends | NO — reserves grew |
| Asset sales | Proceeds from asset disposal only ₹3.59 Cr | NO — immaterial |
| Borrowings | Current borrowings fell from ₹147.18 Cr to ₹105.91 Cr; net repayment of ₹18.24 Cr | NO — debt reduced |
Conclusion: the dividend is funded entirely out of current-year operating cash generation, with cash reserves growing and debt shrinking at the same time. That is the strongest possible funding profile.
Balance Sheet Strength
Liquidity Position (Consolidated, 31.03.2026)
Liquid resources rose ₹720.56 crore (+20.6%) during a year in which the company handed ₹1,526.01 crore to shareholders.
Debt Position
Interest cover is roughly 62 times EBITDA to finance costs. Borrowings fell 28% year on year. There is no scenario in which debt servicing competes with the dividend.
Return Ratios (Computed From Audited Filing)
ROE uses profit attributable to owners over equity attributable to owners. ROCE uses EBIT (PBT plus finance costs) over capital employed (total equity plus borrowings plus lease liabilities). Both are computed by ShareBazaar Online from the audited consolidated statements, not taken from a third-party screener.
Balance Sheet Quality Notes
- Goodwill and intangibles: ₹1,287.04 Cr goodwill plus ₹1,555.87 Cr other intangibles equals ₹2,842.91 Cr, or 25.7% of owners' equity. These are acquisition-related and carry impairment risk. Watch this line.
- Capital work-in-progress jumped from ₹128.95 Cr to ₹328.87 Cr, up 155%. A capex cycle is beginning, which will consume future free cash flow.
- Total equity rose from ₹9,957.76 Cr to ₹11,048.65 Cr despite the dividend outflow.
- Book value per share is roughly ₹106.43 on the post-bonus share count.
Dividend Sustainability Analysis
The Coverage Table
| Ratio | Calculation | Final Dividend Only | Full FY26 Dividend |
|---|---|---|---|
| Payout ratio | Dividend ÷ PAT (owners) | 47.80% | 68.55% |
| Dividend coverage | EPS ÷ DPS | 2.09x | 1.46x |
| FCF coverage | Free cash flow ÷ dividend outflow | 1.91x | 1.33x |
| Cash coverage | Liquid resources ÷ dividend outflow | 3.60x | 2.51x |
| OCF coverage | Operating cash flow ÷ dividend outflow | 2.42x | 1.68x |
The Four Sustainability Tests
- Cash position — PASS. ₹4,218.73 Cr of liquid resources against a ₹1,678.84 Cr annual commitment. The company could fund two and a half years of dividends from the balance sheet alone with zero earnings.
- Free cash flow — PASS. FCF of ₹2,235.73 Cr covers the dividend 1.33 times and grew 21.9% year on year.
- Debt — PASS. Borrowings shrank while dividends rose. Net cash of ₹3,801.52 Cr.
- Earnings trend — PASS. Three consecutive years of profit growth; FY26 PAT up 17.87% with margin expansion.
The Honest Qualifier
"Sustainable" applies to the ₹11.50 final dividend. It does not automatically apply to the full ₹16.50 bonus-adjusted level repeating every year.
At 68.55% payout, Pidilite is retaining only 31.45% of profit for reinvestment. Capital work-in-progress is up 155%, signalling a capex cycle. If capex rises toward ₹900–1,000 crore a year while raw material costs stay elevated, FCF coverage of 1.33 times becomes tight.
Base case for FY27: the ₹11.50 final is safe and likely to grow. Treat a repeat special interim as possible but unproven.
Peer Comparison
Pidilite Versus Asian Paints (FY2025-26)
| Metric | Pidilite Industries | Asian Paints | Who Wins |
|---|---|---|---|
| FY26 Revenue | ₹14,600.83 Cr | ₹35,583.54 Cr | Asian Paints (scale) |
| Revenue growth | +11.11% | +4.9% | Pidilite |
| FY26 Net Profit | ₹2,470.72 Cr | ₹4,325.35 Cr | Asian Paints |
| Net margin | 16.92% | 12.16% | Pidilite |
| Return on Equity | 23.79% | ~20.24% | Pidilite |
| FY26 total dividend | ₹16.50 (bonus-adjusted) | ₹27.50 | Not directly comparable |
| Dividend yield | 1.04% | ~1.03% | Effectively tied |
| Payout ratio | 68.55% | ~61% | Asian Paints (more headroom) |
| Net cash / net debt | Net cash ₹3,801.52 Cr | Not Disclosed by Company | Pidilite |
Asian Paints FY26 figures (revenue ₹35,583.54 Cr, consolidated profit ₹4,325.35 Cr, total dividend ₹27.50 including ₹4.50 interim, ROE ~20.24%, payout ~61%, yield ~1.03%) sourced from its FY26 results announcement of 29th May 2026 and associated market data coverage. Asian Paints net cash position not independently verified.
Wider Peer Set
Pidilite's genuine competitive set spans several listed names in adhesives, construction chemicals and building materials — Berger Paints India, Akzo Nobel India, Kansai Nerolac, Astral, Supreme Industries and Grasim's paints venture.
For those companies, comparable FY26 dividend yield, payout ratio, ROE, ROCE and cash position figures have not been independently verified at the time of writing. We do not publish numbers we have not checked. Where a figure is unavailable, this report states so rather than filling the gap.
The Sector Yield Context
Indian consumer-facing materials and specialty chemicals companies typically yield in a 0.7% to 1.5% band. They are held for compounding, not income.
Against that backdrop, Pidilite's 1.04% bonus-adjusted yield is unremarkable, and its 0.73% recurring yield sits at the bottom of the band. The differentiator is not yield — it is the 23.79% ROE and the net cash balance sheet behind it.
Promoter Impact Analysis
Who Receives The ₹1,170.47 Crore
| Shareholder Category | Holding | Share of Final Dividend | Share of Full FY26 Dividend |
|---|---|---|---|
| Promoter & Promoter Group | 69.30% | ₹811.13 Cr | ₹1,163.43 Cr |
| Foreign Institutional Investors | 11.80% | ₹138.12 Cr | ₹198.10 Cr |
| Domestic Institutional Investors | 9.60% | ₹112.36 Cr | ₹161.17 Cr |
| Public & Retail | 9.30% | ₹108.85 Cr | ₹156.13 Cr |
Shareholding pattern as at March 2026 (promoter 69.3%, FII 11.8%, DII 9.6%, public 9.3%) sourced from market data providers reporting the company's quarterly filing. Rupee allocations computed by ShareBazaar Online.
What This Concentration Means
Roughly seven out of every ten rupees distributed goes to the Parekh promoter family. For the FY26 year as a whole, that is approximately ₹1,163 crore of promoter dividend income.
This is not automatically a criticism. High promoter ownership means promoter and minority interests are aligned on the same instrument — every rupee they receive, you receive proportionally on your holding. There is no dual-class structure, no differential voting, and no preferential payout mechanism at work here.
The Question Worth Asking
The legitimate concern is motive, not mechanics. When a promoter group owns 69.3%, a large dividend is also a large promoter liquidity event. The sharp acceleration in payout since FY24 (+45.5%, +25.0%, +65.0%) coincides with a period when the company was accumulating cash faster than it could deploy it.
The counter-evidence is strong: the payout is covered by free cash flow, cash reserves still grew, and capex is rising rather than being starved. There is no sign that distributions are coming at the expense of the business. But promoter holding trend is worth watching alongside payout ratio.
Taxation Analysis
How Dividend Tax Works In India Today
- Dividend Distribution Tax is gone. Since 1st April 2020, companies no longer pay DDT. The tax moved to you, the shareholder.
- Dividend is taxed at your slab rate. It is added to your total income under "Income from Other Sources" and taxed at whatever marginal rate applies to you — 0%, 5%, 10%, 15%, 20% or 30%, plus applicable surcharge and 4% health and education cess.
- TDS under Section 194. The company deducts 10% tax at source if your total dividend from that one company exceeds ₹10,000 in a financial year (raised from ₹5,000 with effect from FY2025-26).
- No PAN means 20% TDS. Under Section 206AA, a missing or invalid PAN pushes deduction to 20%.
- TDS is not the final tax. It is only an advance credit. If your slab is 30%, you still owe the difference when filing your return.
- Forms 15G and 15H can be filed to avoid TDS if your total income is below the taxable threshold (15H for senior citizens).
- Interest expense deduction: under Section 57, interest paid on money borrowed to buy shares is deductible against dividend income, capped at 20% of the dividend.
Worked Example A — The Standard Case (₹10 Per Share)
Investor holds 1,000 shares. Dividend is ₹10 per share. Investor is in the 30% slab.
| Step | Calculation | Amount |
|---|---|---|
| Gross dividend | 1,000 × ₹10 | ₹10,000 |
| TDS deducted at source | Not applicable — does not exceed ₹10,000 | ₹0 |
| Amount credited to bank | ₹10,000 − ₹0 | ₹10,000 |
| Tax payable at 30% slab + 4% cess | ₹10,000 × 31.20% | ₹3,120 |
| Net dividend after tax | ₹10,000 − ₹3,120 | ₹6,880 |
| Effective post-tax yield | If shares cost ₹1,580.10 each (₹15,80,100 invested) | 0.44% |
Surcharge is ignored in this illustration as it applies only above ₹50 lakh of total income. Surcharge on dividend income is capped at 15%.
Worked Example B — Actual Pidilite Numbers
Investor holds 1,000 Pidilite shares. Final dividend is ₹11.50 per share.
| Step | 5% Slab | 20% Slab | 30% Slab |
|---|---|---|---|
| Gross dividend | ₹11,500 | ₹11,500 | ₹11,500 |
| TDS at 10% (crosses ₹10,000) | ₹1,150 | ₹1,150 | ₹1,150 |
| Credited to bank | ₹10,350 | ₹10,350 | ₹10,350 |
| Total tax including cess | ₹598 | ₹2,392 | ₹3,588 |
| Refund (+) / extra payable (−) | +₹552 refund | −₹1,242 payable | −₹2,438 payable |
| Net dividend in hand | ₹10,902 | ₹9,108 | ₹7,912 |
| Effective post-tax yield | 0.69% | 0.58% | 0.50% |
The uncomfortable takeaway: a 30% slab investor keeps a post-tax yield of about 0.50%. That is materially below a savings account. Pidilite is not, and has never been, an income stock. Anyone buying it purely for the dividend has misread the investment case.
Tax rules described are general in nature and reflect provisions applicable to resident individual shareholders for FY2025-26. Non-resident shareholders face different rates under Section 195 and applicable tax treaties. ShareBazaar Online is not a tax adviser — consult a qualified chartered accountant for your own position.
Key Risks
1. Raw Material Cost Shock
Management has publicly flagged that key input costs rose 40–50% on average on the back of West Asian geopolitical disruption. Pidilite's core inputs are vinyl acetate monomer and other crude-linked derivatives. FY26's 119 basis point gross margin gain was earned before the full pass-through of this shock. FY27 margins face the real test.
2. Receivables Stretching
Trade receivables grew 20.42% against revenue growth of 11.11%, pushing debtor days from 50.3 to 54.5. The allowance for doubtful debts and advances also rose to ₹20.56 crore from ₹21.42 crore. If price-led growth is being supported by looser credit to the trade channel, cash conversion will deteriorate before revenue does.
3. Subsidiary Portfolio Underperformance
Thirty-two subsidiaries generated ₹1,347.42 crore of revenue but only ₹116.06 crore of profit — an 8.6% margin against the group's 16.92%. Impairment charges on associate investments and loans have now appeared for two consecutive years (₹13.71 crore in FY26, ₹24.92 crore in FY25). With ₹2,842.91 crore of goodwill and intangibles on the books, a larger write-down is not unimaginable.
4. Payout Ratio Leaves Limited Headroom
At 68.55% of profit distributed, only 31.45% is retained. Meanwhile capital work-in-progress is up 155% to ₹328.87 crore, meaning capex is accelerating. A company cannot indefinitely fund a rising capex cycle and a 68% payout from the same 100% of profit unless earnings grow to match.
5. B2B Segment Losing Relative Pace
Business-to-Business revenue grew 7.21% against Consumer & Bazaar's 11.38%. In the March quarter, B2B growth slowed further to 7.0% versus C&B's 15.0%. B2B carries a segment margin of 16.48% against C&B's 30.64%, so the mix shift is currently margin-accretive — but a structurally weak B2B narrows the growth runway and increases dependence on a single segment.
6. Valuation Risk To Total Return
A trailing P/E near 65 times and price-to-book near 15 times means the dividend contributes almost nothing to total return. At a 0.73% recurring yield, roughly 99% of your outcome depends on the share price. Any de-rating toward the sector average would swamp several years of dividend income.
7. Approval And Timing Risk
The ₹11.50 is a recommendation, not a declaration, until the 57th AGM on 4th August 2026 approves it. Approval is near-certain given 69.3% promoter holding, but the payment obligation legally crystallises only after that vote.
8. Regulatory Cost Creep
The four new Labour Codes notified on 21st November 2025 forced recognition of ₹39.82 crore towards gratuity and ₹23.02 crore towards compensated absences, plus ₹16.76 crore in other expenses for contract and outsourced workers — roughly ₹79.60 crore in total. The company states it continues to monitor final Central and State Rules, meaning the cost is not yet fully quantified.
What To Monitor
| Metric | FY26 Baseline | Watch For |
|---|---|---|
| Gross margin | 55.56% of revenue | Any contraction below 54% would signal input-cost pass-through is failing |
| Debtor days | 54.5 days | A move past 58 days converts a caution into a problem |
| Underlying volume growth (UVG) | Management cited mid-teens UVG in Q4 | Whether volume growth holds once price hikes cycle through |
| Capital work-in-progress | ₹328.87 Cr | Conversion into operating assets and the resulting return on new capital |
| Free cash flow coverage | 1.33x of full-year dividend | Falling below 1.0x means the dividend is drawing on reserves |
| B2B segment growth | +7.21% full year, +7.0% in Q4 | Re-acceleration toward double digits, or further deceleration |
| Subsidiary profitability | 8.6% net margin on ₹1,347.42 Cr | Whether the overseas portfolio narrows the gap or attracts fresh impairment |
| Payout ratio | 68.55% | Whether the board settles at a stated policy or reverts toward 45–50% |
| Promoter holding | 69.30% | Any dilution or pledge disclosure in quarterly filings |
| Labour Code final rules | ~₹79.60 Cr recognised so far | Additional provisions once Central and State Rules are finalised |
Conclusion
Positives
- Dividend fully funded by operating cash flow — 1.33x FCF coverage on the full year.
- Net cash balance sheet of ₹3,801.52 crore with borrowings falling 28%.
- Cash reserves grew ₹720.56 crore in the same year as ₹1,526.01 crore of dividends were paid.
- Genuine operating leverage: revenue +11.11%, EBITDA +16.81%, PAT +17.87%.
- Ten consecutive years of dividend growth with no cut or suspension.
- Return on equity of 23.79% and ROCE around 30.85% — both above the paint and coatings peer benchmark.
- Auditor issued an unmodified opinion on both standalone and consolidated results.
Negatives
- Post-tax yield for a 30% slab investor is roughly 0.50% — below a savings account.
- Receivables grew 20.42% against revenue growth of 11.11%; debtor days up 4.2 days.
- Payout ratio of 68.55% leaves thin headroom against a capex cycle that is clearly starting.
- Thirty-two subsidiaries earn an 8.6% net margin against the group's 16.92%.
- Associate impairments in two consecutive years; ₹2,842.91 crore of goodwill and intangibles at risk.
- The ₹10 interim was labelled "special" — the recurring yield is only 0.73%.
- B2B growth of 7.21% lags C&B's 11.38%, narrowing the growth base.
The One-Paragraph Summary
Pidilite Industries has declared a ₹11.50 final dividend (1,150% of face value) for FY2025-26, taking the bonus-adjusted full-year payout to ₹16.50 — a 65% increase over the prior year against profit growth of 17.95%. The payout is comfortably covered by ₹2,235.73 crore of free cash flow, sits on a ₹3,801.52 crore net cash balance sheet, and did not require a single rupee of borrowing. On sustainability the answer is unambiguous: yes. On whether it makes Pidilite a dividend stock, the answer is equally unambiguous: no. A 0.73% recurring yield that falls to roughly 0.50% post-tax at the top slab means the dividend is a rounding error in your total return. The two things actually worth tracking from these results are the 4.2-day rise in debtor days and the 155% jump in capital work-in-progress — the first tells you whether growth is being bought with credit, the second tells you where the next few years of free cash flow are going. ShareBazaar Online does not issue buy, sell or hold recommendations. The numbers above are what we found; the decision is yours.
Frequently Asked Questions
What dividend has Pidilite Industries announced for FY2025-26?
What is the Pidilite dividend yield?
What is the record date for the Pidilite dividend?
What is the ex-dividend date and what does it mean?
When will the Pidilite dividend actually be paid?
Who is eligible to receive this dividend?
How is the Pidilite dividend taxed in my hands?
Is the Pidilite dividend sustainable?
Why does ₹11.50 look lower than last year's ₹20?
What is Pidilite's dividend history?
What should investors monitor from here?
How much of this dividend goes to the promoters?
Could Pidilite have done a buyback instead?
Does the AGM have to approve this dividend?
What did the auditors say about these results?
Disclaimer
This article is published by ShareBazaar Online for informational and educational purposes only. It does not constitute investment advice, a research report under SEBI (Research Analysts) Regulations, 2014, or an offer or solicitation to buy or sell any security. ShareBazaar Online does not issue buy, sell or hold recommendations.
All figures relating to Pidilite Industries Limited's FY2025-26 results, dividend recommendation, share capital, segment performance, balance sheet and cash flows are drawn from the company's audited financial results and board outcome letter filed with BSE Ltd. and the National Stock Exchange of India Ltd. on 7th May 2026. Ratios, growth rates, coverage multiples, yields and per-category dividend allocations have been computed by ShareBazaar Online from those filings and are clearly labelled as such.
Market prices, the record date, ex-date, AGM date, payment window, shareholding pattern and peer company data are sourced from public market data providers and subsequent exchange filings, and are stated as at the dates indicated. Market data is subject to change. Where information was unavailable or unverified, this report states "Not Disclosed by Company" or explicitly flags the limitation rather than estimating.
The dividend of ₹11.50 per share remains subject to shareholder approval at the 57th Annual General Meeting. Taxation commentary is general in nature, reflects provisions applicable to resident individual shareholders for FY2025-26, and is not a substitute for advice from a qualified chartered accountant. Non-resident shareholders are governed by different provisions.
Investments in securities are subject to market risks. Past dividend history is not a guarantee of future payouts. Readers should conduct their own due diligence and consult a SEBI-registered investment adviser before making any investment decision. ShareBazaar Online and its authors accept no liability for any loss arising from reliance on this content.