
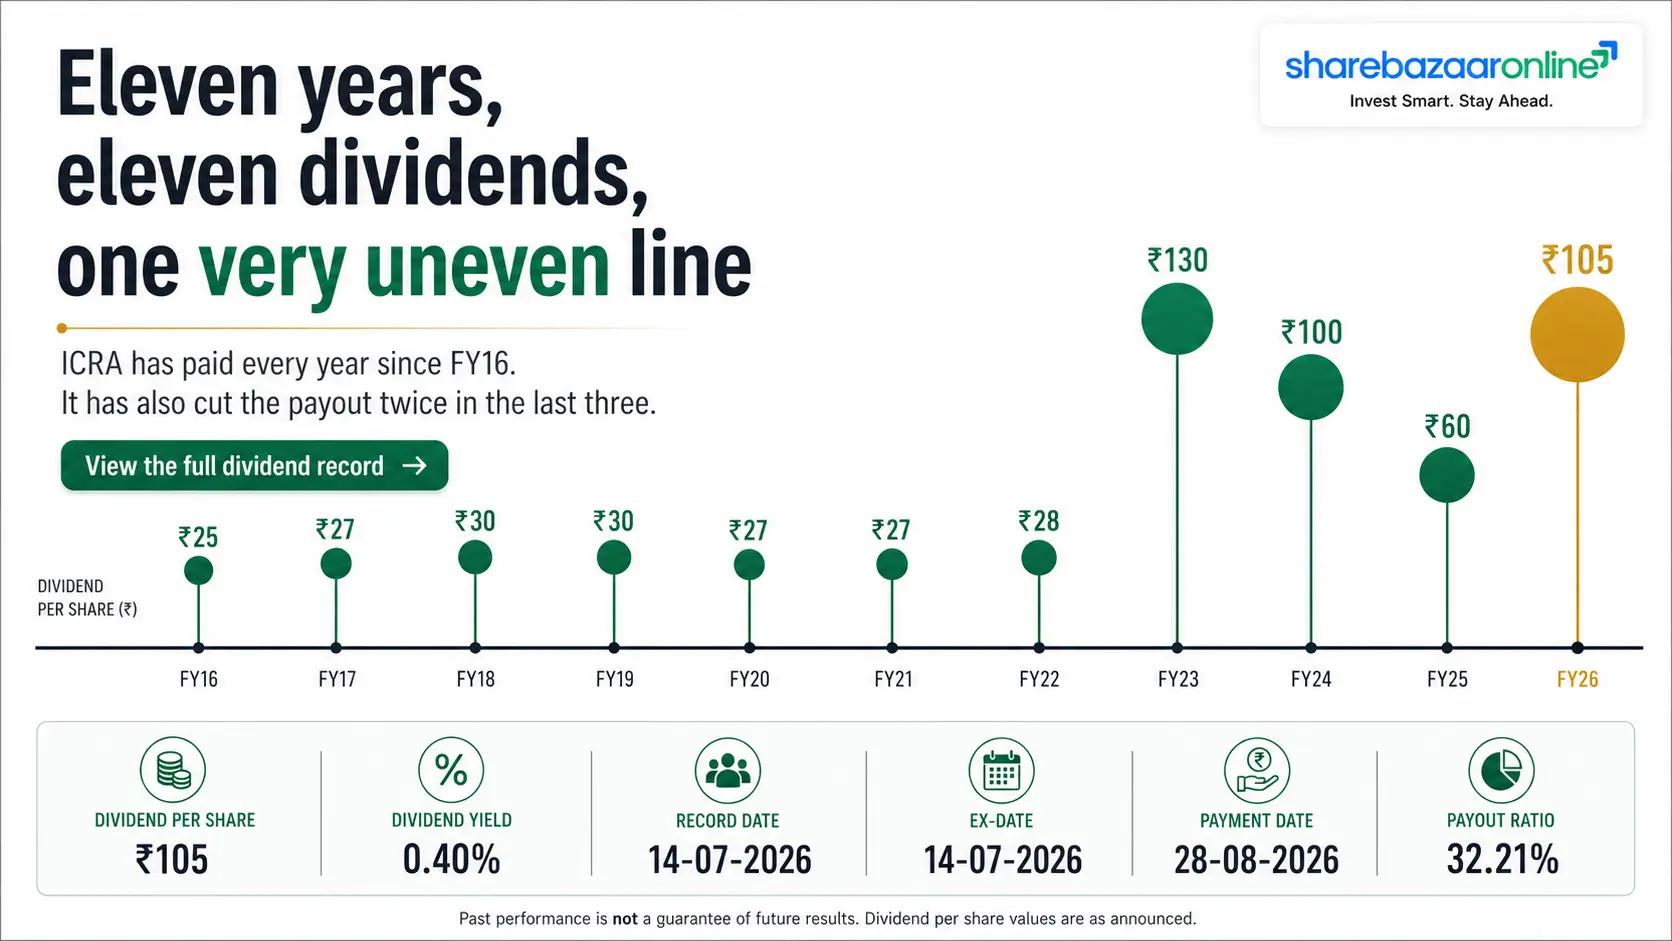
Dividend Snapshot
ICRA Limited has recommended a final dividend of ₹105 per equity share for FY2025-26 — the largest single-year payout in the company's listed history. The figure includes a one-time special dividend of ₹35 per share to mark ICRA's 35th year of operations. On a face value of ₹10, this works out to 1,050% of face value.
The headline number is up 75% over last year's ₹60. But strip out the one-time special component and the recurring dividend rose from ₹60 to ₹70 (+16.7%) — a very different growth rate, and the one that matters for anyone modelling future income.
Dividend Details
| Company | ICRA Limited |
| NSE Symbol | ICRA |
| BSE Code | 532835 |
| ISIN | INE725G01011 |
| Dividend Type | Final (incl. Special) |
| Dividend Per Share | ₹105.00 |
| — Regular Final | ₹70.00 |
| — Special (35 Years) | ₹35.00 |
| Dividend % | 1,050% |
| Face Value | ₹10.00 |
| Financial Year | FY2025-26 |
Scale & Yield
| Total Dividend Outflow | ₹101.34 Crore |
| — Special Component | ₹33.78 Crore |
| Previous Year Outflow | ₹57.91 Crore |
| Shares Outstanding | 96,51,200 |
| Paid-up Share Capital | ₹9.65 Crore |
| Yield on Announcement Price | 1.91% |
| Yield on Current Price | 2.10% |
| Payout Ratio (Consolidated) | 55.5% |
| Payout Ratio (Standalone) | 80.0% |
| AGM Approval Required | Yes — 30 Jul 2026 |
The One Number Most Reports Will Miss
On a standalone basis — which is the entity that actually writes the cheque — ICRA earned an EPS of ₹131.68 and is paying out ₹105. That is a standalone payout of 80% and a dividend cover of just 1.25 times. The comfortable-looking 55.5% consolidated payout is arithmetically true but leans on profits sitting inside subsidiaries such as ICRA Analytics, which must first travel up as inter-company dividends before the parent can distribute them.
Dividend Announcement Summary
What The Board Actually Approved
ICRA's Board met on 21 May 2026 from 2:30 pm to 4:45 pm. In that meeting it approved the audited standalone and consolidated results for Q4 and full-year FY26, and recommended a final dividend of ₹105 per equity share of ₹10 face value for the year ended 31 March 2026.
The filing is explicit that the ₹105 includes a special dividend of ₹35 per share. It is not ₹105 plus ₹35. The stated purpose of the special component is to commemorate the company's 35th year of operations — a symmetry the board clearly liked: ₹35 for 35 years.
Board Recommendations
- Final dividend of ₹105 per share for FY26, including special dividend of ₹35 per share.
- Total distribution of ₹101.34 crore, of which ₹33.78 crore is the special element.
- Audited FY26 results (standalone and consolidated) approved, with unmodified audit opinions from Deloitte Haskins & Sells.
- 35th AGM fixed for 30 July 2026 via video conferencing.
- Record date fixed as 23 July 2026 for both AGM eligibility and dividend payment.
Management Commentary
On the FY26 earnings call, management framed the payout as part of a deliberate three-year escalation in shareholder returns, noting that the recurring dividend had been lifted from the customary ₹60 to ₹70, with the special dividend layered on top of that. Management also indicated near-term operating cash generation in the region of ₹180–200 crore and a net cash position expected to stay above ₹700 crore, and pointed to bank credit activity as the primary driver of ratings revenue going forward. (Source: FY26 Q4 earnings call, 21–22 May 2026.)
AGM Approval Requirement
A final dividend is a recommendation, not a declaration. Until shareholders vote on it at the AGM on 30 July 2026, ICRA carries no legal liability to pay it. In practice, a promoter holding of roughly 51.9% means the resolution's passage is close to arithmetic certainty — but the sequencing matters for anyone tracking the cash: record date first (23 July), approval second (30 July), payment third (on or before 21 August).
Key Dates Timeline
| Event | Date | Why It Matters |
|---|---|---|
| Board Meeting / Announcement | 21-05-2026 | Dividend recommended; FY26 results approved |
| Ex-Dividend Date | 23-07-2026 | Buy on or after this date and you do not get the dividend |
| Record Date | 23-07-2026 | Register of members frozen for entitlement |
| 35th AGM | 30-07-2026 | Shareholders vote to declare the dividend |
| Payment Date | On or before 21-08-2026 | Credit to bank account linked to demat |
Why Ex-Date And Record Date Are The Same Day
Indian equities settle on a T+1 cycle. A trade executed today is settled tomorrow, so shares bought on the ex-date will not appear in the buyer's demat account by the time the register is closed. That collapses the ex-date onto the record date. The practical rule for ICRA: to receive ₹105 per share, you needed to have bought on or before 22 July 2026 and held through the close of that session.
The 63-Day Gap Nobody Talks About
There are 63 days between the announcement (21 May) and the record date (23 July), and up to 92 days between announcement and payment. For a shareholder, that means ₹101.34 crore sits inside ICRA's treasury earning a return for three additional months. It also means the announcement-day yield (1.91%) and the ex-date yield (2.10%) are different numbers — both correct, measuring different things.
Dividend Yield Analysis
Yield Calculations
| Closing price on 21-05-2026 | ₹5,490.00 |
| Announcement-day yield | 1.91% |
| Price on 23-07-2026 (ex-date) | ≈ ₹5,009.50 |
| Current yield on ₹105 | 2.10% |
| Yield on regular ₹70 only | 1.40% |
| Yield on special ₹35 only | 0.70% |
| FY25 yield (₹60 basis) | ≈ 0.96% |
Prices sourced from public market data providers. Intraday quotes on 23-07-2026 ranged roughly ₹4,860–₹5,027 — treat the current yield as a band of 2.09%–2.16%, not a point estimate.
Formulae Used
Dividend Yield = (DPS ÷ CMP) × 100
= (105 ÷ 5,009.50) × 100 = 2.10%
Announcement Yield = (105 ÷ 5,490) × 100 = 1.91%
Dividend Outflow = ₹105 × 96,51,200 shares = ₹101.34 crore
Dividend Coverage = EPS ÷ DPS
Consolidated: 188.63 ÷ 105 = 1.80x
Standalone: 131.68 ÷ 105 = 1.25x
Yield Reality Check — Where This 2.10% Actually Came From
A yield can double for good reasons or bad ones. ICRA's yield went from roughly 0.96% to 2.10% in one year, and the increase is the product of two forces pulling in the same direction:
- A genuinely larger dividend (+75%). This is the good half. Reported profits rose, cash generation rose, and the board chose to distribute more.
- A falling share price (roughly −24% over twelve months). The stock traded at a 52-week high of ₹6,982 and a low of ₹4,965.50, and currently sits near the bottom of that range. Mathematically, a shrinking denominator inflates yield without the company doing anything.
Splitting the effect: had the price stayed at ₹6,982, ₹105 would have yielded only 1.50%. Roughly two-thirds of the yield expansion is dividend growth; the remaining one-third is price de-rating. And of the ₹105 itself, ₹35 does not recur. A shareholder pricing this stock on a forward income basis should be working with a base case closer to 1.40%, not 2.10%.
Dividend History Analysis
Ten-Year Dividend Record (Per Financial Year)
| Financial Year | Total DPS (₹) | YoY Change | Character |
|---|---|---|---|
| FY2026 | 105.00 | +75.0% | ₹70 regular + ₹35 special |
| FY2025 | 60.00 | −40.0% | Single final dividend |
| FY2024 | 100.00 | −23.1% | Paid across multiple tranches |
| FY2023 | 130.00 | +364.3% | Large one-off distribution year |
| FY2022 | 28.00 | +3.7% | Single final dividend |
| FY2021 | 27.00 | 0.0% | Single final dividend |
| FY2020 | 27.00 | −10.0% | Delayed to Oct 2020 (COVID year) |
| FY2019 | 30.00 | 0.0% | Single final dividend |
| FY2018 | 30.00 | +11.1% | Single final dividend |
| FY2017 | 27.00 | +8.0% | Single final dividend |
| FY2016 | 25.00 | — | Single final dividend |
Compiled from exchange corporate-action records and dividend history databases. FY23 and FY24 totals include interim tranches; the split between interim and final in those two years is drawn from press reporting rather than a single primary filing.
Consistency
ICRA has paid a dividend in every one of the last ten financial years, including FY2020 and FY2021 when many financial-sector names deferred or suspended payouts. There has been no suspension and no skipped year on record over this window. That is a genuine strength and it is the strongest single argument for the durability of the base dividend.
Growth Trend
Compounded from ₹25 in FY2016 to ₹105 in FY2026, the ten-year CAGR is 15.4%. But that headline flatters the underlying trend, because both endpoints are distorted — FY16 was a plain year and FY26 contains a special. Measured on the recurring dividend only (₹25 to ₹70), the ten-year CAGR falls to 10.8%.
Classification: Consistent Payer With A Lumpy Payout Policy
ICRA does not fit neatly into one bucket, so it deserves a precise label. On frequency, it is a Consistent Payer — ten years, ten dividends, zero misses. On quantum, it is decidedly irregular: the payout has swung ₹28 → ₹130 → ₹100 → ₹60 → ₹105 across five consecutive years. Anyone treating ICRA as a bond-like income holding will be repeatedly surprised.
Note also the shape of the FY24-to-FY25 move: the dividend was cut 40%, from ₹100 to ₹60, in a year when profits did not fall. That is the clearest available evidence that ICRA's board treats the dividend as a discretionary capital-allocation lever, not a commitment. It is a fact worth holding in mind when reading this year's 75% increase.
Financial Performance Analysis
Consolidated FY26 vs FY25 (₹ Crore)
| Particulars | FY26 | FY25 | Change |
|---|---|---|---|
| Revenue from Operations | 599.51 | 498.02 | +20.4% |
| Other Income | 75.02 | 77.41 | −3.1% |
| Total Income | 674.53 | 575.43 | +17.2% |
| Employee Benefit Expenses | 310.12 | 261.13 | +18.8% |
| Depreciation & Amortisation | 28.26 | 16.39 | +72.4% |
| Other Expenses | 74.37 | 59.14 | +25.8% |
| Finance Costs | 4.43 | 4.80 | −7.7% |
| Operating EBITDA (computed) | 215.03 | 177.75 | +21.0% |
| Profit Before Exceptional & Tax | 257.36 | 233.97 | +10.0% |
| Exceptional Item (Labour Codes) | 6.92 | — | — |
| Profit Before Tax | 250.45 | 233.97 | +7.0% |
| Profit After Tax | 182.53 | 171.20 | +6.6% |
| Basic EPS (₹) | 188.63 | 176.73 | +6.7% |
Operating EBITDA computed as PBT before exceptional + finance costs + depreciation − other income. Not a company-reported figure.
Operating Leverage — Revenue Up 20%, Profit Up 7%
This is the central tension in ICRA's FY26. Revenue grew 20.4%, operating EBITDA grew 21.0%, and yet profit after tax grew only 6.6%. The operating business converted growth efficiently — EBITDA margin was essentially flat at 35.9% versus 35.7%. The leakage happened below the operating line, and it has three identifiable causes:
- Depreciation and amortisation up 72.4% (₹16.39 cr → ₹28.26 cr, an incremental ₹11.87 cr). This is overwhelmingly the amortisation of intangibles recognised on the Fintellix acquisition. Other intangible assets on the balance sheet jumped from ₹19.00 cr to ₹100.99 cr. This charge is non-cash but it is real and it will repeat for years.
- Other income fell 3.1% (₹77.41 cr → ₹75.02 cr), costing ₹2.39 cr at the PBT line. This is the direct consequence of spending ₹245.64 crore of treasury on Fintellix — the interest and fair-value income that cash was generating went away.
- The ₹6.92 crore exceptional charge from the new Labour Codes, a one-time gratuity and leave-liability true-up notified in November 2025.
Adjusting back the exceptional item, PAT growth would have been closer to 9.6%. The gap to 20% revenue growth is therefore structurally the acquisition: ICRA bought revenue and paid for it in amortisation and forgone treasury income.
The Organic Picture (₹ Crore)
Fintellix was consolidated only from 1 October 2025 and contributed ₹51.69 crore of revenue and ₹6.91 crore of PAT in that six-month stub. Stripping it out changes the story materially:
| Metric | Reported | Ex-Fintellix |
|---|---|---|
| FY26 Revenue from Operations | 599.51 | 547.82 |
| Growth over FY25 (₹498.02 cr) | +20.4% | +10.0% |
Organic revenue growth was roughly 10%, not 20%. Half of ICRA's headline top-line expansion in FY26 was purchased, not earned. That does not make it bad growth — but it does mean the FY27 base is higher and the comparison will be tougher once Fintellix annualises.
Segment Performance (₹ Crore)
| Segment | FY26 Rev | FY25 Rev | FY26 Margin | FY25 Margin |
|---|---|---|---|---|
| Ratings & Ancillary | 336.45 | 294.59 | 37.6% | 34.1% |
| Research & Analytics | 265.81 | 204.79 | 24.3% | 29.8% |
The Ratings business is doing the heavy lifting: revenue up 14.2% and segment margin expanding 3.5 percentage points to 37.6%. This is a high-quality, capital-light franchise operating at its best in years.
Research & Analytics is the problem area. Revenue looks strong at +29.8%, but ₹51.69 crore of that came from Fintellix; organic growth was closer to 4.6%. Meanwhile the segment margin compressed 5.5 percentage points, from 29.8% to 24.3%. In plain terms: ICRA paid ₹249 crore for a business that has so far diluted the margin of the division it joined. This is the single most important thing to watch in FY27.
Cash Flow Analysis
Why This Section Exists
Reported profit is an accounting opinion shaped by depreciation policy, fair-value marks and accrual timing. Cash is a fact. A dividend cannot be paid out of an opinion. So before judging whether ₹101.34 crore is affordable, we look at what actually moved through the bank account.
Consolidated Cash Flow (₹ Crore)
| Line Item | FY26 | FY25 |
|---|---|---|
| Profit Before Tax | 250.45 | 233.97 |
| Operating cash flow before working capital | 213.58 | 182.43 |
| Cash generated from operations | 220.80 | 200.07 |
| Income taxes paid (net) | (63.55) | (55.18) |
| Net Operating Cash Flow (OCF) | 157.26 | 144.89 |
| Capital expenditure | (12.49) | (12.41) |
| Free Cash Flow (computed) | 144.77 | 132.48 |
| Purchase consideration — Fintellix | (245.64) | — |
| Net investing cash flow | (110.19) | (16.89) |
| Dividend paid during the year | (58.77) | (97.46) |
| Net financing cash flow | (66.91) | (103.13) |
Operating Cash Flow vs Net Profit
OCF of ₹157.26 crore against PAT of ₹182.53 crore gives a conversion ratio of 0.86x — below 1.0. On its own that would be a warning sign. Here it is largely explained rather than alarming: roughly ₹75 crore of ICRA's profit is other income (treasury interest and investment gains), and under Ind AS most of that is stripped out of operating activities and shown under investing. FY25 showed the same pattern at 0.85x, so this is a structural feature of ICRA's model, not a fresh deterioration.
The honest read: ICRA's operating businesses generated ₹157 crore of cash. Its treasury generated the rest of the profit. Both are real, but only the first one scales with the business.
Receivables Growth vs Revenue Growth
This is the flag we would ask management about. Trade receivables rose from ₹47.59 crore to ₹78.41 crore — up 64.8% — against revenue growth of 20.4%. Days sales outstanding stretched from roughly 35 days to 48 days.
Part of this is mechanical: consolidating Fintellix brings its receivable book onto the balance sheet on day one, while only six months of its revenue appears in the income statement. That distortion inflates DSO artificially. But it does not obviously explain the full 13-day extension. If receivables keep outrunning revenue in FY27, the quality of reported revenue becomes a live question.
How Is This Dividend Being Funded?
Directly and unambiguously: out of current-year operating earnings, with a top-up from accumulated treasury.
- Not from borrowings. Total borrowings across the group are ₹0.63 crore. ICRA repaid ₹0.27 crore of debt during FY26 and paid ₹0.22 crore of interest on financial liabilities. This is an effectively debt-free balance sheet.
- Not from asset sales. Proceeds from disposal of property, plant and equipment were ₹0.37 crore — immaterial.
- Primarily from current earnings. Free cash flow of ₹144.77 crore comfortably exceeds the ₹101.34 crore outflow, giving FCF coverage of 1.43x.
- With reserves as backstop. Cash and investments of roughly ₹769 crore (current basis) provide 7.6 years of cover at this payout level.
The one qualifier worth stating plainly: the ₹101.34 crore will consume 64% of FY26's operating cash flow and 70% of free cash flow. Last year's ₹57.91 crore consumed only 40% of OCF. The cushion is still large, but it is meaningfully thinner than it was.
Balance Sheet Strength
Liquidity & Leverage (₹ Crore)
| Current investments | 726.99 |
| Cash & cash equivalents | 29.72 |
| Other bank balances | 12.77 |
| Liquid treasury (current) | 769.48 |
| Non-current other financial assets | 198.52 |
| Total borrowings | 0.63 |
| Lease liabilities | 17.78 |
| Net Cash Position | 768.85 |
| Total equity | 1,185.14 |
| Debt-to-equity | 0.001x |
Returns & Structure
| Return on Equity (computed) | ≈ 16.3% |
| Return on Capital Employed (computed) | ≈ 21.5% |
| Goodwill (FY26) | 165.90 |
| Goodwill (FY25) | 30.19 |
| Other intangibles (FY26) | 100.99 |
| Other intangibles (FY25) | 19.00 |
| Total assets | 1,486.10 |
| Deferred consideration payable | Not Disclosed by Company |
ROE computed on average equity attributable to owners; ROCE on (PBT + finance costs) ÷ (equity + borrowings). Neither is a company-reported figure.
The Treasury Shrank 27% This Year
This deserves attention because it is the context in which a 75% dividend increase is being announced. ICRA's liquid treasury (current investments + cash + bank balances) fell from ₹1,053.02 crore to ₹769.48 crore — a reduction of ₹283.54 crore, or 26.9%, in a single year.
The bulk of that is explained: ₹245.64 crore went out of the door for Fintellix. But it means ICRA is raising its payout immediately after its largest cash deployment ever. The balance sheet remains fortress-grade — effectively zero debt, ₹768.85 crore net cash, ROE of 16.3% — but the cushion is smaller than the headline "₹700 crore net cash" comfort suggests, and a second acquisition of similar size would materially change the calculus.
Goodwill Is Now 11% Of The Balance Sheet
Goodwill rose ₹135.71 crore to ₹165.90 crore, and now represents 11.2% of total assets and 14.0% of equity. Goodwill is not a cash asset and cannot fund a dividend — but it can destroy retained earnings if it is impaired. ICRA has recorded the Fintellix numbers on a provisional basis under Ind AS 103, meaning the purchase price allocation is not final. A downward revision, or a future impairment, would hit reported profit and therefore the payout-ratio arithmetic, even though it would not touch the cash available to distribute.
Dividend Sustainability Analysis
Coverage Metrics
| Test | Calculation | Result |
|---|---|---|
| Payout Ratio — Consolidated | 101.34 ÷ 182.53 | 55.5% |
| Payout Ratio — Standalone | 101.34 ÷ 126.71 | 80.0% |
| Dividend Cover — Consolidated | 188.63 ÷ 105 | 1.80x |
| Dividend Cover — Standalone | 131.68 ÷ 105 | 1.25x |
| FCF Coverage | 144.77 ÷ 101.34 | 1.43x |
| OCF Coverage | 157.26 ÷ 101.34 | 1.55x |
| Cash Coverage (years) | 769.48 ÷ 101.34 | 7.59x |
| Recurring-only payout (₹70) | 67.56 ÷ 182.53 | 37.0% |
Cash Position — Can ICRA Afford This?
Yes, comfortably. With ₹769.48 crore of liquid treasury against a ₹101.34 crore obligation, ICRA could fund this dividend for over seven years from the balance sheet alone even if operating cash flow went to zero. Total borrowings of ₹0.63 crore mean there are no competing creditor claims.
Free Cash Flow — Is It Covered?
Yes, but with a thinner margin than before. FCF of ₹144.77 crore covers the payout 1.43 times. Last year the same test produced 2.29x cover against a ₹57.91 crore obligation. The dividend grew 75%; free cash flow grew 9.3%. That divergence is the arithmetic reason the cushion narrowed.
Debt Position — Is Leverage Rising?
No. This is the cleanest part of the story. Borrowings fell from ₹1.16 crore to ₹0.63 crore. Even the ₹245.64 crore Fintellix payment was funded entirely from existing treasury with no new debt raised. ICRA is not borrowing to pay shareholders — a failure mode that ends badly and is worth explicitly ruling out.
Earnings Trend — Growing Or Declining?
Growing, but decelerating at the bottom line. PAT rose 6.6% in FY26 against revenue growth of 20.4%. Adjusted for the ₹6.92 crore exceptional charge, PAT growth was roughly 9.6%. Q4 FY26 PAT was actually down 5.9% year-on-year at ₹52.69 crore versus ₹55.99 crore. Earnings are not deteriorating — but they are not compounding at 20% either.
Verdict: Sustainable — With A Caveat On What "This" Means
We classify the recurring ₹70 component as Sustainable. At a 37.0% consolidated payout ratio, 2.07x free cash flow cover and effectively zero debt, ICRA can maintain and grow that base dividend from operations alone.
We classify the full ₹105 as Moderately Sustainable and, by design, non-repeating. The ₹35 special is tied to a 35-year anniversary that will not recur. Investors modelling ₹105 into FY27 are extrapolating a one-time event. On the company's own framing, the recurring line went from ₹60 to ₹70 — a 16.7% increase — and that is the number with predictive value.
The stress point to watch is the standalone entity, where cover is only 1.25x. If subsidiary profits are not upstreamed as inter-company dividends in a given year, the parent's distributable capacity tightens quickly.
Peer Comparison
Listed Indian Credit Rating Agencies — Latest Reported Year
| Metric | ICRA | CRISIL | CARE Ratings |
|---|---|---|---|
| Financial year basis | Apr–Mar (FY26) | Jan–Dec | Apr–Mar (FY26) |
| Consolidated revenue (₹ cr) | 599.51 | Not comparable* | 473.07 |
| Consolidated PAT (₹ cr) | 182.53 | Not comparable* | 173.70 |
| Revenue growth | +20.4% | +27–30% (recent Qs) | +18.0% |
| PAT growth | +6.6% | +26–46% (recent Qs) | +24.0% |
| Dividend per share | ₹105 (FV ₹10) | ₹61 (FV ₹1) | ₹22 (FV ₹10) |
| Dividend frequency | Annual | Quarterly | Interim + Final |
| Total dividend outflow (₹ cr) | 101.34 | Not Disclosed by Company | 56.96 |
| Dividend yield | ≈ 2.10% | ≈ 1.36–1.42% | ≈ 1.10–1.60% |
| Payout ratio | 55.5% | ≈ 49% (est.) | 32.8% |
| Market capitalisation (₹ cr) | ≈ 4,945–5,028 | ≈ 31,448–33,910 | Not Disclosed by Company |
| Net cash position | ₹768.85 cr | Not Disclosed by Company | Not Disclosed by Company |
| ROE (computed / reported) | ≈ 16.3% | Not Disclosed by Company | Not Disclosed by Company |
*CRISIL reports on a January–December calendar year and has a materially larger non-ratings research and analytics business, so full-year revenue and PAT are not like-for-like with ICRA's April–March consolidated figures. Peer figures sourced from public filings and market data providers; ROE and net cash for CRISIL and CARE were not verified from primary annual reports for this note and are shown as Not Disclosed by Company rather than estimated.
What The Comparison Shows
- ICRA now offers the highest yield in the pack at roughly 2.10% — but that is flattered by the one-time special and by a 24% share-price decline. On the recurring ₹70 alone, ICRA's 1.40% sits roughly in line with CRISIL's 1.36–1.42%.
- ICRA also has the most aggressive payout ratio at 55.5%, against CARE's notably conservative 32.8%. CARE is retaining nearly twice as much of its profit.
- ICRA has the weakest profit growth of the three. CARE grew PAT 24%; CRISIL's recent quarters ran 26–46%; ICRA managed 6.6%. Paying out the most while growing the slowest is a combination worth noticing.
- CRISIL pays quarterly; ICRA pays once a year. For an income-focused holder, CRISIL's cadence is smoother and more predictable, even at a lower headline yield.
- Sector context: all three yield between roughly 1.1% and 2.1%, well above the broad Indian market's typical 1.1–1.3%. Rating agencies are capital-light and cash-generative, so high payouts are structurally normal for the sector rather than a sign of distress.
Promoter Impact Analysis
Shareholding Pattern (June 2026)
| Category | Holding | Dividend (₹ cr) |
|---|---|---|
| Promoter (Moody's group) | 51.9% | 52.59 |
| DII (MFs, insurers) | 24.3% | 24.63 |
| Public / Retail | 16.7% | 16.92 |
| FII | 6.9% | 6.99 |
| Total | ≈ 99.8% | 101.13 |
Shareholding as reported by market data providers for the quarter ended June 2026; components round to ~99.8% and dividend allocation is computed on those percentages.
Promoter Benefit
Moody's Corporation, through its holding entities, will receive approximately ₹52.59 crore from this distribution — 51.9% of the total. Of that, roughly ₹17.53 crore comes from the special dividend alone.
It is worth being plain about the structural point: when a majority foreign parent controls the board, a large special dividend is also a repatriation mechanism. That is not improper, and Indian minority shareholders receive the identical per-share amount. But it is a legitimate lens through which to read a 75% payout hike in the same year the company deployed ₹245.64 crore on an acquisition.
Minority Shareholder Benefit & Distribution Impact
Non-promoter shareholders — institutions plus retail — will collectively receive approximately ₹48.54 crore, or 48.1% of the pool. Domestic institutions take the largest non-promoter slice at ₹24.63 crore.
Crucially, ICRA has a single class of equity with uniform rights. Every shareholder, from Moody's to someone holding one share, receives exactly ₹105 per share before tax. There is no differential entitlement, no preferential class, and no structure that advantages the promoter on a per-share basis. The only asymmetry is in taxation: the non-resident promoter is subject to withholding at treaty or statutory non-resident rates, while resident shareholders are taxed at their own slab rate with 10% TDS above the threshold.
Taxation Analysis
How Dividends Are Taxed In India
Since 1 April 2020, the Dividend Distribution Tax paid by companies has been abolished. Dividends are now taxed entirely in the hands of the shareholder. The key rules:
- Head of income: Dividend is taxed as Income from Other Sources and added to your total income.
- Rate: Taxed at your applicable slab rate — 5%, 20%, 30% and so on, plus surcharge where applicable and 4% health and education cess. There is no concessional rate and no exemption threshold on the income itself.
- TDS under Section 194: The company deducts tax at 10% if total dividend paid to a resident shareholder in a financial year exceeds ₹10,000. If PAN is not furnished, the rate rises to 20%.
- Forms 15G / 15H: A resident whose total income is below the taxable limit can file Form 15G (under 60) or Form 15H (senior citizen) with the registrar — KFin Technologies for ICRA — to avoid TDS.
- Deduction allowed: Interest expense incurred to earn dividend income is deductible, capped at 20% of the dividend. No other expenses qualify.
- Non-residents: Taxed at 20% plus surcharge and cess under domestic law, or at the lower rate available under the applicable Double Taxation Avoidance Agreement, subject to a Tax Residency Certificate and Form 10F.
- TDS is not the final tax. The 10% deducted is a credit against your final liability. A 30%-slab taxpayer still owes the balance at the time of filing.
Worked Example A — Standard Illustration
Investor holds 1,000 shares. Dividend ₹10 per share. Tax slab 30%.
| Gross dividend | ₹10,000 |
| TDS under Sec 194 @10% | ₹0 |
| Amount credited to bank | ₹10,000 |
| Tax at 30% slab | ₹3,000 |
| Health & education cess @4% | ₹120 |
| Total tax liability | ₹3,120 |
| Net dividend retained | ₹6,880 |
| Effective retention | 68.8% |
No TDS applies here because the gross dividend does not exceed the ₹10,000 threshold. Add one more share and TDS would kick in on the whole amount.
Worked Example B — Actual ICRA Numbers
Investor holds 100 ICRA shares. Dividend ₹105 per share. Tax slab 30%. Purchase price ₹5,009.50.
| Investment value | ₹5,00,950 |
| Gross dividend | ₹10,500 |
| TDS @10% (exceeds ₹10,000) | ₹1,050 |
| Amount credited to bank | ₹9,450 |
| Final tax (30% + 4% cess) | ₹3,276 |
| Balance payable at filing | ₹2,226 |
| Net dividend after all tax | ₹7,224 |
| Gross yield | 2.10% |
| Post-tax effective yield | 1.44% |
The Number That Actually Matters
For a shareholder in the highest slab, ICRA's headline 2.10% yield becomes 1.44% after tax. On the recurring ₹70 alone, the post-tax yield drops to roughly 0.96%. That is below most fixed deposit rates on a pre-tax basis, though FD interest is also taxed at slab. The practical implication: ICRA is not, and should not be modelled as, a high-income instrument for a top-bracket investor. Its dividend is better understood as a capital-return signal than as an income stream.
For a shareholder in the 5% slab, the same ₹10,500 gross leaves roughly ₹9,954 after tax — an effective yield of 1.99%. Post-tax dividend yield is a function of who owns the share, not of the company.
Key Risks
1. The Payout Has Been Cut Before — Sharply
ICRA reduced its dividend from ₹130 (FY23) to ₹100 (FY24) to ₹60 (FY25) — a 54% decline over two years — without a corresponding collapse in profits. The board demonstrably treats the payout as discretionary. Anyone assuming ₹105, or even ₹70, is a floor is assuming something the ten-year record does not support.
2. Standalone Dividend Cover Is Only 1.25x
The parent entity earned EPS of ₹131.68 and is distributing ₹105 — an 80% standalone payout. The parent depends on upstreamed subsidiary dividends (FY26 standalone accounts show ₹1.09 crore received from a subsidiary, against ₹26.87 crore in FY25) to sustain distributions of this size. If subsidiaries retain cash to fund their own growth, parent-level distributable capacity tightens fast.
3. Fintellix Integration And Provisional Goodwill
ICRA paid ₹249.06 crore for Fintellix and recorded ₹135.72 crore of goodwill on a provisional basis under Ind AS 103 — the purchase price allocation is not final. In its first six months, Fintellix delivered ₹51.69 crore of revenue and ₹6.91 crore of PAT, an implied net margin of 13.4% against the group's 30.4%. The acquisition has so far compressed Research & Analytics segment margin by 5.5 percentage points. A future impairment would hit reported profit and the payout ratio.
4. Revenue Concentration In Credit Cycle Activity
The Ratings segment contributed ₹336.45 crore (56% of revenue) and ₹126.40 crore (66% of segment profit). Management has stated that ratings revenue will be driven primarily by bank credit activity. Rating fees are tied to issuance volumes, which are cyclical. A slowdown in bond issuance or bank credit growth flows directly into the segment carrying most of the group's profitability — and corporate bond issuance was already reported as softening across FY26 at the sector level.
5. Regulatory And Litigation Exposure Inherent To Rating Agencies
Credit rating agencies operate under direct SEBI oversight, with rating accuracy, conflict-of-interest management and disclosure standards subject to continuous regulatory scrutiny. Adverse regulatory action, fee-structure intervention, or reputational damage from a high-profile rating failure can impair the franchise value that underpins the entire earnings stream. The sector has a documented history of regulatory penalties following credit events.
6. Foreign Exchange And Cross-Border Exposure
Management indicated on the FY26 call that roughly USD 18 million of the group's revenue is dollar-denominated — approximately 25% of the top line. The group also operates ICRA Nepal, ICRA Lanka, Fintellix South Africa and Fintellix US LLC. Currency movement and the economic conditions of these jurisdictions introduce volatility that has nothing to do with the Indian ratings cycle.
7. Receivables Quality And Employee Cost Inflation
Trade receivables grew 64.8% against revenue growth of 20.4%, stretching DSO from roughly 35 to 48 days. Separately, employee benefit expenses of ₹310.12 crore represent 51.7% of revenue and grew 18.8%. This is a people business with limited operating leverage on its largest cost line; wage inflation in analytical talent flows almost directly to margin.
What To Monitor
1. The FY27 Recurring Dividend — Does ₹70 Hold?
This is the single cleanest test of whether FY26 marked a genuine step-up in ICRA's payout policy or a one-off anniversary gesture. Watch the May 2027 board meeting. A recurring dividend of ₹70 or above confirms the reset. A reversion to ₹60 would confirm that the entire FY26 increase was ceremonial.
2. Research & Analytics Segment Margin
The benchmark is 29.8% (FY25); FY26 came in at 24.3%. If Fintellix integration is working, this margin should recover toward the high twenties through FY27 as synergies land and integration costs roll off. If it stays near 24% or drifts lower with a full year of Fintellix consolidated, the ₹249 crore acquisition thesis needs re-examining.
3. Organic Revenue Growth Once Fintellix Annualises
FY27 will be the first year with twelve months of Fintellix in both periods only from FY28. Until then, watch for management disclosure of like-for-like growth. The organic number in FY26 was roughly 10% against a reported 20.4%. If organic growth holds near 10% while headline growth decelerates, the underlying business is healthy. If organic slips to mid-single digits, the acquisition was masking a slowdown.
4. Days Sales Outstanding
DSO moved from roughly 35 days to 48 days. Some of that is the Fintellix consolidation artefact. By the Q2 FY27 balance sheet, that distortion will have washed through. If DSO is still near or above 48 days at that point, receivable quality — and therefore the reliability of reported revenue — becomes a genuine concern rather than an accounting artefact.
5. Treasury Rebuild Versus Further Deployment
Liquid treasury fell from ₹1,053 crore to ₹769 crore in FY26. Management guided to net cash staying above ₹700 crore. Track whether treasury rebuilds toward ₹850–900 crore through FY27 on retained cash flow, or whether it is deployed again. ICRA Analytics has already announced a ₹32 crore purchase of the remaining 40% of D2K Technologies — a further, if modest, cash use.
6. Bond Issuance And Bank Credit Volumes
Ratings revenue is a direct function of debt issuance activity. Track monthly corporate bond issuance data, bank credit growth, and securitisation volumes — ICRA's own published research reported Q1 FY27 securitisation volumes at roughly ₹61,000 crore, up 20% year-on-year, which is a constructive leading indicator for its own ratings pipeline.
7. Employee Cost As A Share Of Revenue
Currently 51.7% of revenue (₹310.12 crore). This ratio improved slightly in FY26 as revenue outgrew wages 20.4% to 18.8%. Sustained improvement here is what converts revenue growth into profit growth. If the ratio climbs back above 53%, the operating leverage story stalls regardless of top-line performance.
8. Final Purchase Price Allocation On Fintellix
The ₹135.72 crore goodwill figure is provisional. Ind AS 103 allows a twelve-month measurement period, so the final allocation should be disclosed by around Q3 FY27. Watch how much shifts from goodwill into amortisable intangibles — a larger intangible allocation means higher recurring amortisation and lower reported profit in future years.
Conclusion
Positives
- Largest dividend in ICRA's listed history at ₹105 per share, up 75% year-on-year.
- Ten consecutive years of dividend payment, including through FY20 and FY21.
- Effectively debt-free: total borrowings of ₹0.63 crore against ₹769.48 crore of liquid treasury.
- Free cash flow of ₹144.77 crore covers the payout 1.43 times; cash reserves cover it 7.59 times.
- Ratings segment margin expanded 3.5 percentage points to 37.6% — the core franchise is performing well.
- Revenue grew 20.4% to ₹599.51 crore; unmodified audit opinion from Deloitte Haskins & Sells on both sets of accounts.
- The dividend is funded from earnings and reserves, not from debt or asset sales.
Negatives
- ₹35 of the ₹105 does not recur. The forward-looking dividend is ₹70, a 16.7% increase — not 75%.
- PAT grew only 6.6% against 20.4% revenue growth; Q4 PAT actually fell 5.9% year-on-year.
- Roughly half of revenue growth was acquired, not organic. Ex-Fintellix growth was about 10%.
- Research & Analytics segment margin compressed 5.5 percentage points to 24.3%.
- Standalone payout of 80% with dividend cover of only 1.25x.
- Liquid treasury fell 26.9%; goodwill rose to ₹165.90 crore on a provisional basis.
- Receivables grew 64.8% against 20.4% revenue growth; DSO stretched to ~48 days.
- The board has cut the dividend twice in the last three years, most recently by 40%.
Bringing It Together
ICRA's FY26 dividend is a genuine, well-funded distribution from a debt-free, cash-rich business with an excellent core ratings franchise. Nothing about the payout looks financially strained.
But the headline is doing a lot of work. A 75% dividend increase sits alongside 6.6% profit growth, 10% organic revenue growth, a 27% reduction in treasury, and a 5.5 point margin compression in the division that just absorbed a ₹249 crore acquisition. The 2.10% yield is real, but roughly a third of its expansion came from a 24% share price decline, and a third of the dividend itself is a one-time anniversary payment.
The most useful framing for a reader: treat ₹70 and roughly 1.40% as the recurring picture, and treat the ₹35 special as what it is — a 35th-anniversary distribution that also happens to send ₹17.53 crore of it to a majority foreign parent. Both facts are true and both belong in the same sentence.
We present positives, negatives, risks and monitoring factors. We do not issue buy, sell or hold recommendations. The decision, and the responsibility for it, belongs to you.
Frequently Asked Questions
What dividend has ICRA Limited announced for FY2026?
What is ICRA's dividend yield on this payout?
What is the record date for ICRA's FY26 dividend?
What is the ex-dividend date, and why is it the same as the record date?
When will ICRA pay the dividend?
Who is eligible to receive the ₹105 dividend?
How will this dividend be taxed in my hands?
Is ICRA's dividend sustainable at this level?
What does ICRA's dividend history look like?
Why did profit grow only 6.6% when revenue grew 20.4%?
How much of the dividend goes to Moody's, ICRA's promoter?
How does ICRA's dividend compare with CRISIL and CARE Ratings?
What should I monitor before ICRA's next dividend decision?
Disclaimer
This article is published by ShareBazaar Online for informational and educational purposes only. It does not constitute investment advice, a recommendation, or an offer or solicitation to buy or sell any security. ShareBazaar Online does not issue buy, sell or hold recommendations.
All figures relating to the dividend, financial results, balance sheet and cash flows are drawn from ICRA Limited's stock exchange filings dated 21 May 2026, including the audited standalone and consolidated financial results for the quarter and year ended 31 March 2026 and the accompanying auditor's reports issued by Deloitte Haskins & Sells. Market prices, shareholding data, dividend history and peer comparisons are sourced from public market data providers and exchange corporate-action records, and are marked as such in the relevant sections. Ratios described as "computed" are our own calculations from primary filing data and are not company-reported figures.
The recommended dividend is subject to shareholder approval at the Annual General Meeting scheduled for 30 July 2026 and may be modified or not declared. Share prices quoted are intraday or closing values on the dates stated and change continuously. Past dividend payments are not a guarantee of future distributions — ICRA has reduced its dividend in prior years.
Taxation commentary reflects Indian income-tax provisions as generally understood at the time of writing and is illustrative only. Tax treatment depends on individual circumstances and legislation is subject to change. Readers should consult a SEBI-registered investment adviser and a qualified tax professional before acting on any information here.
Investments in securities markets are subject to market risks. Read all scheme-related and offer documents carefully before investing. ShareBazaar Online and its authors accept no liability for any loss arising from reliance on this content.