
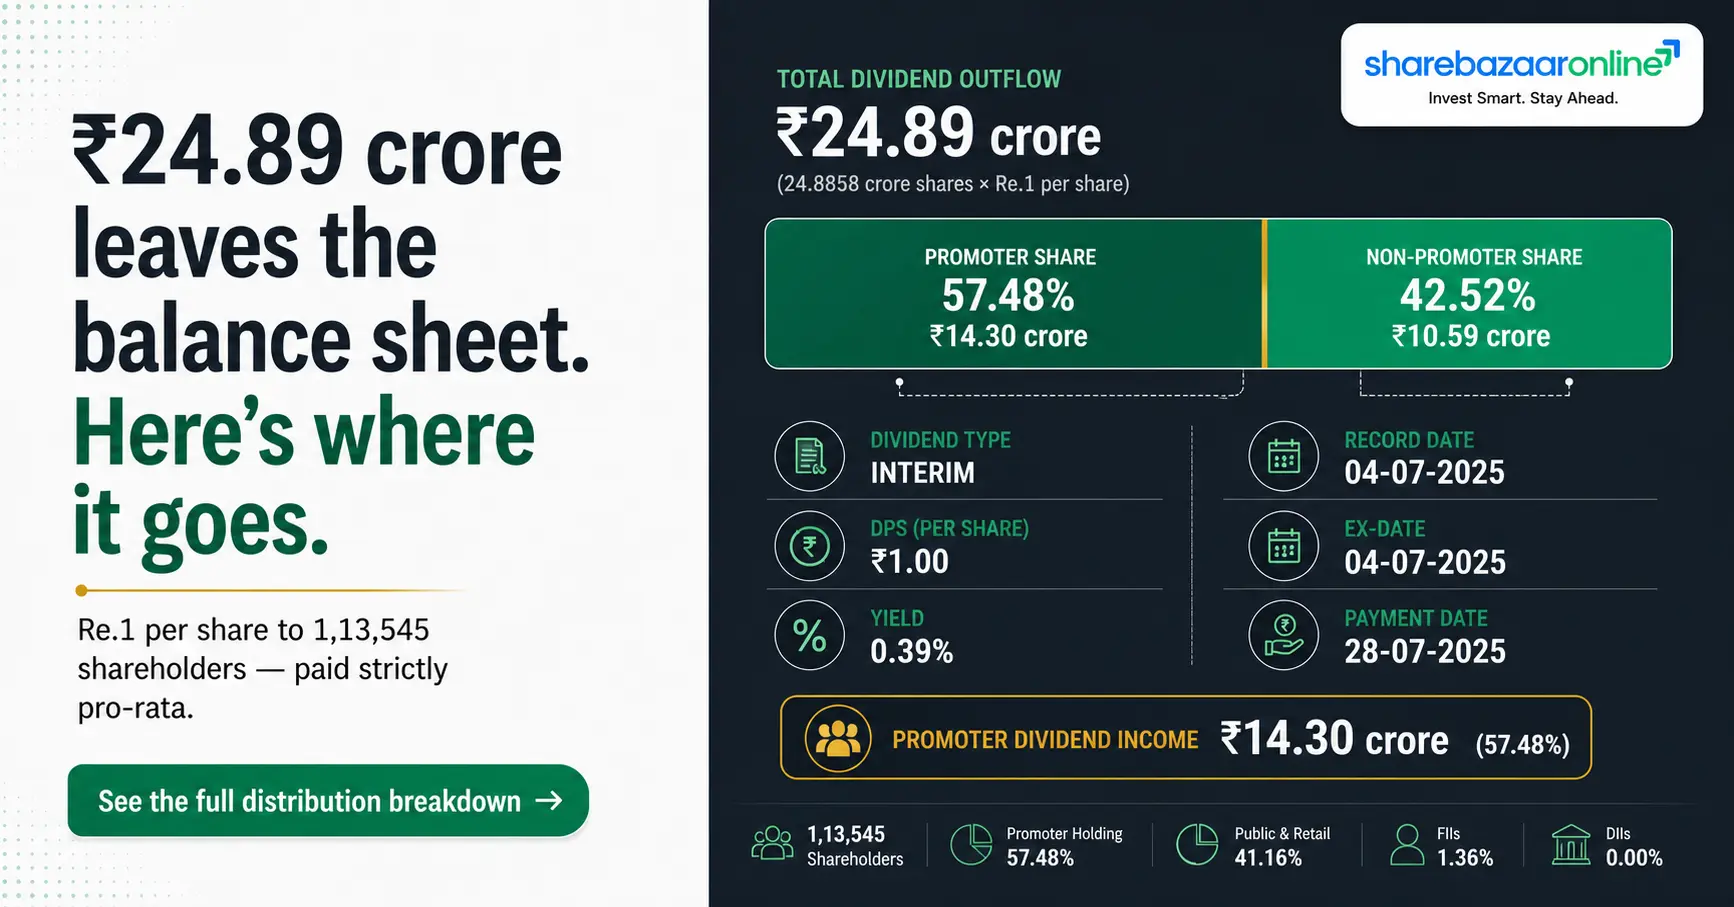
Dividend Snapshot
The Board of Bhansali Engineering Polymers Limited (BEPL) declared a 1st Interim Dividend of Re.1 per equity share (100% of face value) for FY 2026-27 at its meeting on 18th July 2026. The record date is 23rd July 2026 and payment will be made on or before 16th August 2026.
The dividend was announced alongside the company's strongest quarter in years: consolidated revenue rose 53.34% YoY to ₹472.15 crore and consolidated PAT rose 42.95% YoY to ₹65.60 crore. The stock responded by rallying from a pre-announcement close of ₹113.10 to ₹133.30 within two trading sessions.
Dividend Details
| Company | Bhansali Engineering Polymers Ltd |
| NSE Symbol | BEPL |
| BSE Code | 500052 |
| ISIN | Not Disclosed by Company |
| CIN | L27100MH1984PLC032637 |
| Dividend Type | 1st Interim Dividend |
| Dividend Per Share | ₹1.00 |
| Dividend % | 100% |
| Face Value | ₹1.00 |
| Financial Year | FY 2026-27 |
Payout Mathematics
| Paid-up Share Capital | ₹24.89 crore |
| Shares Outstanding | 24.8858 crore |
| Total Dividend Outflow | ₹24.89 crore |
| Q1 FY27 Consolidated PAT | ₹65.60 crore |
| Outflow as % of Q1 PAT | 37.9% |
| Q1 FY27 EPS (Consolidated) | ₹2.64 |
| Dividend Coverage (Q1 EPS ÷ DPS) | 2.64x |
| Promoter Share of Outflow | ₹14.30 crore |
| Non-Promoter Share of Outflow | ₹10.58 crore |
The One Number That Matters
On its own, Re.1 looks small. But BEPL has a face value of just ₹1, so this single interim dividend equals 100% of face value and costs the company ₹24.89 crore — cash that leaves the balance sheet in the same quarter the company has committed ₹200 crore of capex to be funded entirely from internal accruals. That collision is the real story of this announcement, and we work through it in detail below.
Dividend Announcement Summary
What the Board Approved
At the Board meeting held on 18th July 2026 (commenced 03:30 pm, concluded 04:47 pm), the Directors of Bhansali Engineering Polymers Limited approved three items under Regulations 30, 33 and 42 of SEBI (LODR) Regulations, 2015:
- • Un-audited Standalone and Consolidated Financial Results for the quarter ended 30th June 2026, with a Limited Review Report from statutory auditors M/s. Azad Jain & Co., Chartered Accountants.
- • Declaration of the 1st Interim Dividend of Re.1/- (100%) per equity share of face value Re.1/- each for FY 2026-27, subject to deduction of tax at source.
- • Fixing Thursday, 23rd July 2026 as the record date, with payment on or before 16th August 2026.
Interim vs Final — Why It Matters
An interim dividend is declared by the Board mid-year out of current-year profits and paid immediately. It does not need shareholder approval at an AGM. A final dividend is only recommended by the Board and must be approved by shareholders before it can be paid.
Because this is an interim dividend, no AGM approval is required and the money moves on schedule. Separately, BEPL's 42nd AGM held on 21st July 2026 approved the FY26 final dividend of Re.1 per share (record date 13th July 2026) — a different payout entirely. Shareholders on the register for both will receive two separate credits.
Management Commentary
Mr. Jayesh B. Bhansali, Joint Managing Director & CFO, attributed the quarter's profitability expansion to higher realisations, operating leverage and cost efficiencies, describing the performance as resilient despite a dynamic global geopolitical environment. He stated that the debt-free balance sheet, cash position and internal accruals would fund the planned expansion.
The filing itself contains no separate dividend rationale — no stated dividend policy target, no payout guidance for FY27. Investors are effectively relying on an 11-quarter pattern rather than a stated commitment.
Board Recommendation Status
One point of caution for readers comparing news sources: several outlets described this payout as "recommended… subject to the approval of shareholders." The company's own filing to BSE and NSE uses the word "Declared", and Note 5 of both the standalone and consolidated results states the Board "have declared" the 1st Interim Dividend. Treat the exchange filing as authoritative — this is a declared interim dividend, payable without AGM approval.
Key Dates Timeline
| Event | Date | What It Means For You |
|---|---|---|
| Board Meeting / Announcement | 18-07-2026 (Saturday) | Dividend declared. Markets were closed; first trading reaction came on 20-07-2026. |
| Last Cum-Dividend Trading Day | 22-07-2026 | Buy on or before this date to be eligible. |
| Ex-Dividend Date | 23-07-2026 | Under T+1 settlement the ex-date and record date coincide. Buy on this day and you do not get the dividend. |
| Record Date | 23-07-2026 | Register of members is frozen. Whoever holds shares in demat at end of day is eligible. |
| Payment Date | On or before 16-08-2026 | Credit lands in your registered bank account, net of TDS. |
A Practical Note on Eligibility
India moved to T+1 settlement in January 2023. Before that, the ex-date fell one trading day ahead of the record date. Today they are the same day for most corporate actions. The rule that still holds: your purchase must settle by the record date, which means the trade has to be executed one trading day before the ex-date. For BEPL, that trading day was Wednesday, 22nd July 2026.
On the ex-date, the stock price typically opens lower by roughly the dividend amount. At Re.1 on a share trading near ₹133, that adjustment is under 0.8% — likely to be invisible inside normal daily volatility.
Dividend Yield Analysis
Yield on This Dividend Alone
| Last close before announcement (17-07-2026) | ₹113.10 |
| Announcement-reference yield | 0.88% |
| Close 20-07-2026 (first session after) | ₹124.90 (+10.43%) |
| Latest CMP (NSE, 21-07-2026) | ₹133.30 |
| Yield on latest CMP | 0.75% |
Prices sourced from NSE/BSE market data via public financial portals.
Yield on Full-Year Dividends
| FY26 total dividend per share | ₹4.00 |
| Yield at ₹113.10 | 3.54% |
| Yield at ₹133.30 | 3.00% |
| Yield at 52-week low of ₹74.20 | 5.39% |
| Sector (Chemicals) average yield | ≈0.8% |
Yield Reality Check — Why the Yield Just Fell
Earlier in 2026, screening tools were flagging BEPL at yields of 4.2% to 5.0%. Today the same ₹4 annual dividend yields 3.00%. Nothing about the dividend changed. What changed is the denominator.
BEPL fell to a 52-week low of ₹74.20 during a period when FY26 revenue declined 8.7% and the stock was down roughly 21-28% over twelve months. A stable dividend divided by a falling price produces a high yield — the classic "yield trap" signature. It has now reversed: the stock is up about 80% from that low to ₹133.30 on the back of a genuinely strong Q1 FY27, and the yield has compressed accordingly.
The honest reading: BEPL's earlier 5% yield was not a reward for a generous dividend — it was a symptom of a de-rating. The current 3.0% is a healthier number, because it reflects a rising price alongside a maintained dividend. That is the version of high yield income investors should prefer.
Dividend History Analysis
Ten-Year Dividend Record (Per Share, ₹)
| Financial Year | Dividends Declared | Total DPS | Payout Ratio |
|---|---|---|---|
| FY2026-27 (to date) | 1 interim (this announcement) | ₹1.00 | In progress |
| FY2025-26 | 3 interims + 1 final | ₹4.00 | 55% |
| FY2024-25 | Multiple interims + final | ₹4.00 | 55% |
| FY2023-24 | Multiple interims + final | ₹4.00 | 56% |
| FY2022-23 | 2 interims + final + ₹14 special | ₹17.00 | 206% |
| FY2021-22 | 2 interims + final | ₹3.00 | 14% |
| FY2020-21 | 1 interim + final | ₹1.50 | 5% |
| FY2019-20 | Final only | ₹0.50 | 12% |
| FY2018-19 | Final only | ₹0.50 | 18% |
| FY2017-18 | Final only | ₹0.30 | 5% |
| FY2016-17 | Final only | ₹0.20 | 9% |
Dividends grouped by financial year of declaration. Ex-date history compiled from exchange corporate action records; payout ratios from consolidated financials.
What the Record Actually Shows
Uninterrupted, but not linear. BEPL has declared 33 dividends since July 2003 with no suspension in the last decade. But the shape is telling:
- • FY17–FY20: token payouts of ₹0.20–₹0.50, single annual final dividend, payout ratio 5–18%.
- • FY21–FY22: the ABS super-cycle. Profits exploded to ₹334 crore and ₹350 crore, but dividends stayed at ₹1.50 and ₹3.00 — payout of just 5% and 14%. Cash was retained.
- • FY23: a ₹14 special dividend pushed total DPS to ₹17 and payout to 206% of that year's ₹137 crore profit. That was a one-off release of accumulated super-cycle cash, not recurring generosity.
- • FY24–FY26: settled into a disciplined ₹4.00 annual rhythm at a ~55% payout — four ₹1 instalments a year.
Classification
Consistent Payer — with a cyclical top-up history
BEPL qualifies as a Consistent Payer: it has paid in every one of the last ten financial years, has never cut the base dividend, and has run a stable ₹4/₹1-per-quarter cadence for three straight years.
The caveat: the record contains one enormous special dividend (₹14 in FY23) that distorts any long-run "dividend CAGR" calculation. Screeners showing 50%+ dividend growth rates are usually anchoring on the ₹0.0667 base of a decade ago and the ₹17 spike of FY23. Neither is a fair guide to what FY27 or FY28 will look like. The honest base rate to plan around is ₹4.00 per year.
Financial Performance Analysis
Q1 FY27 Consolidated Results (₹ Crore)
| Particulars | Q1 FY27 | Q1 FY26 | YoY | Q4 FY26 | QoQ |
|---|---|---|---|---|---|
| Revenue from Operations | 472.15 | 307.91 | +53.34% | 341.61 | +38.21% |
| Other Income | 9.75 | 11.36 | -14.14% | 10.24 | -4.71% |
| Total Income | 481.91 | 319.27 | +50.94% | 351.84 | +36.97% |
| Total Expenses | 391.69 | 257.60 | +52.05% | 279.57 | +40.10% |
| Operating EBITDA (excl. other income) | 82.59 | 52.55 | +57.16% | 64.09 | +28.87% |
| Operating EBITDA Margin | 17.49% | 17.07% | +42 bps | 18.76% | -127 bps |
| Share of JV Profit | 0.46 | 0.29 | +59.03% | -0.08 | Turnaround |
| Profit Before Tax | 90.67 | 61.96 | +46.34% | 72.20 | +25.59% |
| Tax Expense | 25.08 | 16.07 | +56.08% | 20.60 | +21.74% |
| Effective Tax Rate | 27.66% | 25.93% | +173 bps | 28.53% | -87 bps |
| Profit After Tax | 65.60 | 45.89 | +42.95% | 51.60 | +27.13% |
| EPS (₹) | 2.64 | 1.84 | +43.48% | 2.07 | +27.54% |
Operating Leverage Analysis — Reading Past the Headline
Several wire reports stated that BEPL's "EBITDA margin moderated to 19.2% from 20.0%, a contraction of 80 basis points." That framing is misleading, and here is why.
The ₹92.30 crore EBITDA figure quoted in those reports is calculated on Total Income — that is, it includes ₹9.75 crore of other income (interest and treasury returns). Strip that out and compute EBITDA on operations only:
Headline (incl. other income)
₹92.34 Cr vs ₹63.91 Cr → +44.5%
Margin 19.16% vs 20.02% → -86 bps
Pure Operating Basis
₹82.59 Cr vs ₹52.55 Cr → +57.2%
Margin 17.49% vs 17.07% → +42 bps
The "margin contraction" is an arithmetic artefact. Operating revenue grew 53% while other income fell 14%; a shrinking numerator component dragged down a ratio measured against a rapidly growing denominator. On the business itself, margins expanded. This distinction matters for dividend investors, because operating cash — not treasury income — is what funds recurring payouts sustainably.
Where the Costs Moved
| Cost Head (% of revenue) | Q1 FY27 | Q1 FY26 | Change |
|---|---|---|---|
| Total material cost | 69.22% | 67.89% | +133 bps |
| Employee benefits | 3.85% | 5.01% | -116 bps |
| Other expenses | 9.44% | 10.04% | -60 bps |
| Depreciation | 0.43% | 0.71% | -28 bps |
Employee cost rose 17.8% in absolute terms but revenue rose 53% — classic positive operating leverage on a fixed cost base. Raw material intensity worsened by 133 bps, which is the one negative in the cost table.
The Finding Nobody Else Flagged
Purchase of stock-in-trade jumped from ₹19.50 crore to ₹75.14 crore — a 285% increase.
Stock-in-trade is bought-in finished goods that BEPL resells rather than manufactures. Traded goods went from 6.33% of revenue to 15.91% in a single year.
Why it matters: trading typically carries thinner margins than manufacturing. If roughly a sixth of the top line is now resale volume, then a meaningful slice of the celebrated "53% revenue growth" is lower-quality growth. It also partly explains the 133 bps rise in material intensity. Management has not disclosed the margin split between manufactured and traded volumes — this is a legitimate question for the next earnings call.
The Longer Trend — Five Years of Consolidated Performance (₹ Crore)
| Metric | FY22 | FY23 | FY24 | FY25 | FY26 |
|---|---|---|---|---|---|
| Revenue | 1,394 | 1,363 | 1,222 | 1,398 | 1,276 |
| Operating Profit | 463 | 177 | 212 | 215 | 216 |
| OPM % | 33% | 13% | 17% | 15% | 17% |
| Other Income | 20 | 30 | 40 | 38 | 40 |
| Net Profit | 350 | 137 | 179 | 180 | 180 |
| EPS (₹) | 14.06 | 5.49 | 7.21 | 7.23 | 7.24 |
Three flat years. Profit has been pinned near ₹180 crore for FY24, FY25 and FY26 — EPS moved from ₹7.21 to ₹7.24 across three full years, growth of 0.4% in total. Revenue actually fell 8.7% in FY26. Five-year compounded sales growth is 0% and five-year profit growth is negative 12% against the FY21-22 super-cycle base.
Q1 FY27 is a decisive break from that pattern. The open question is whether it is a durable inflection driven by realisations and capacity, or a favourable quarter in a cyclical commodity chain. One quarter does not establish a trend.
Consolidated vs Standalone
This analysis uses consolidated financials throughout. The difference is small but real: BEPL consolidates its joint venture Bhansali Nippon A&L Private Limited using the equity method. Standalone Q1 FY27 PAT was ₹65.14 crore (EPS ₹2.62); consolidated PAT was ₹65.60 crore (EPS ₹2.64), the ₹0.46 crore gap being BEPL's share of the JV's profit. The JV's interim results were reviewed by a different auditor, and BEPL's auditors have explicitly stated their conclusion on that portion relies solely on the other auditors' reports.
Cash Flow Analysis
Reported Profits Are Opinions. Cash Is Fact.
A quarterly SEBI filing carries no cash flow statement — companies are only required to publish one half-yearly. So the honest starting position is: Q1 FY27 operating cash flow is Not Disclosed by Company. Any commentary claiming this dividend is "covered by cash flow" this quarter is asserting something the filing does not contain. What we can do is examine the audited annual record.
Five-Year Cash Flow Record (Consolidated, ₹ Crore)
| Metric | FY22 | FY23 | FY24 | FY25 | FY26 |
|---|---|---|---|---|---|
| Net Profit | 350 | 137 | 179 | 180 | 180 |
| Cash from Operations (OCF) | 298 | 140 | 231 | 109 | 168 |
| OCF ÷ Net Profit | 85% | 102% | 129% | 61% | 93% |
| Free Cash Flow | 284 | 135 | 210 | 103 | 133 |
| Cash from Financing | -50 | -50 | -324 | -100 | -100 |
| CFO ÷ Operating Profit | 91% | 112% | 138% | 81% | 109% |
Cash Conversion — Broadly Healthy, One Weak Year
BEPL converts profit into cash well. Over five years, OCF has averaged roughly 94% of net profit — a respectable figure for a working-capital-intensive petrochemical processor.
The exception is FY25. Profit was ₹180 crore but OCF was just ₹109 crore — a conversion of 61%. Roughly ₹71 crore of reported profit did not arrive as cash that year. FY26 repaired this to 93%, but the episode is a reminder that BEPL's cash generation is not mechanical.
Receivables vs Revenue — A Warning Sign
| Working Capital | FY24 | FY25 | FY26 |
|---|---|---|---|
| Debtor Days | 69 | 67 | 73 |
| Inventory Days | 60 | 44 | 79 |
| Days Payable | 40 | 21 | 65 |
| Working Capital Days | 148 | 117 | 129 |
In FY26 revenue fell 8.7% while debtor days rose from 67 to 73 and inventory days rose from 44 to 79. Working capital expanded in a year the business shrank. Inventory days nearly doubled — the company was carrying substantially more stock relative to sales.
If Q1 FY27's 53% revenue surge was partly the sell-through of that built-up inventory, the profit is real but the cash flow benefit may be front-loaded. Conversely, sustaining 53% growth will consume working capital heavily. Watch the H1 FY27 cash flow statement closely.
How Is This Dividend Being Funded?
On the evidence available, the ₹24.89 crore is funded from current earnings, with cash reserves acting as the buffer:
✓ Current Earnings — Primary Source
Q1 FY27 PAT of ₹65.60 crore covers the ₹24.89 crore outflow 2.64 times. This is the cleanest possible funding source.
◐ Cash Reserves — Supporting Role
Net worth was ₹1,081.93 crore at 31 March 2026 with borrowings at NIL. FY26 financing outflow was ₹100 crore, almost entirely dividends. Exact cash and investments as at 30 June 2026: Not Disclosed by Company.
✗ Asset Sales — Not a Factor This Year
FY25 showed an unusual +₹235 crore investing inflow (likely treasury redemptions). FY26 reverted to a normal -₹30 crore investing outflow. No evidence of dividends funded by asset disposals in FY26.
✗ Borrowings — Categorically Not
Borrowings have been NIL every year since FY18. BEPL formally confirmed to BSE on 28 April 2026 that outstanding borrowing was NIL at 31 March 2026. Q1 finance cost was ₹0.09 crore. This dividend is not debt-funded.
Balance Sheet Strength
Key Balance Sheet Metrics
| Net Worth (31-03-2026) | ₹1,081.93 crore |
| Equity Share Capital | ₹24.89 crore |
| Reserves (consolidated, FY26) | ₹1,058.34 crore |
| Total Borrowings | NIL |
| Net Debt | Net Cash Positive |
| Debt-to-Equity | 0.00x |
| Q1 FY27 Finance Cost | ₹0.09 crore |
| Book Value Per Share | ₹43.50 |
| ROE (FY26) | 17.3% |
| ROCE (FY26) | 23.8% |
| Cash & Investments (30-06-2026) | Not Disclosed by Company |
What Debt-Free Really Buys You
BEPL has carried zero borrowings since FY18. In a commodity-linked chemicals business where input prices swing violently, that is a structural advantage, not an accounting curiosity.
Three practical consequences for a dividend investor:
- • No lender veto. Leveraged companies routinely have loan covenants restricting dividend payments. BEPL has none.
- • Interest doesn't compete with dividends. Finance cost of ₹0.09 crore a quarter is a rounding error. Almost the entire operating profit is available for shareholders or reinvestment.
- • Downside protection. In a bad cycle, a debt-free company reduces the dividend by choice; a leveraged one is forced to.
The flip side, raised by some analysts: persistent zero debt in a business earning 23.8% ROCE may indicate an unwillingness to lever up for growth. Deploying modest debt at Indian corporate borrowing rates against a 23.8% return should, in theory, be accretive.
Return Ratios in Context
ROE of 17.3% and ROCE of 23.8% are good in absolute terms, but note the direction: ten-year average ROE is 25%, five-year is 21%, three-year is 18%, and last year was 17.3%. Returns have been steadily compressing as the balance sheet accumulated cash faster than the business could deploy it.
This is the mathematical cost of hoarding: an idle cash pile earning treasury returns of 6-7% sits inside an equity base that is measured against a 17% ROE. The ₹200 crore capex is, viewed this way, partly a return-ratio repair exercise as much as a growth project.
Dividend Sustainability Analysis
Coverage Ratios
| Coverage Test | Calculation | Result | Read |
|---|---|---|---|
| This dividend vs Q1 earnings | ₹2.64 EPS ÷ ₹1.00 DPS | 2.64x | Comfortable |
| FY26 annual earnings coverage | ₹7.24 EPS ÷ ₹4.00 DPS | 1.81x | Adequate |
| FY26 payout ratio | ₹99.54 Cr ÷ ₹180.16 Cr PAT | 55.3% | Disciplined |
| FY26 OCF coverage | ₹168 Cr ÷ ₹99.54 Cr | 1.69x | Adequate |
| FY26 FCF coverage | ₹133 Cr ÷ ₹99.54 Cr | 1.34x | Tight |
| FY25 FCF coverage (worst year) | ₹103 Cr ÷ ₹99.54 Cr | 1.03x | Barely covered |
The FY25 Near-Miss Deserves Attention
In FY25, BEPL generated ₹103 crore of free cash flow and paid out ₹99.54 crore in dividends. That is a coverage ratio of 1.03x — the dividend consumed 96.6% of free cash flow. Independent screening data has flagged BEPL's cash payout ratio at levels above 100% at certain measurement points.
FY26 improved to 1.34x, but the underlying point stands: at the current ₹4 annual run-rate, BEPL's dividend is comfortably covered by earnings but only thinly covered by free cash flow in weaker years. Earnings coverage of 1.81x is the number most commentary quotes. FCF coverage of 1.34x is the number that determines whether the cash actually exists.
The FY27 Stress Test — Capex Meets Dividend
This is the single most important calculation in this article. BEPL has committed to a ₹200 crore debottlenecking capex (expanding ABS capacity from 75,000 MTPA to 100,000 MTPA at Abu Road and Satnoor), funded 100% via internal accruals with no debt, targeting commissioning by September 2026.
| Announced capex (FY27) | ₹200.00 crore |
| Dividends at ₹4 run-rate | ₹99.54 crore |
| Total cash commitment | ₹299.54 crore |
| FY26 operating cash flow | ₹168.00 crore |
| Gap to be funded from reserves | ₹131.54 crore |
Read carefully, because this cuts both ways.
The bear case: at FY26 cash generation levels, BEPL cannot fund both the capex and the dividend from the year's operating cash flow. It must draw down accumulated reserves by roughly ₹132 crore. Do that for two consecutive years and the cash cushion that makes the dividend look safe starts to thin.
The bull case: FY26 cash generation is not the right base. If Q1 FY27's ₹65.60 crore PAT holds, annualised profit runs at ₹262 crore — comfortably above the ₹300 crore commitment when depreciation is added back, and the ₹4 dividend would represent a payout of only 38%. On that basis the dividend and the capex coexist without touching reserves. BEPL also has a net worth of ₹1,081.93 crore and zero debt to absorb any shortfall.
The resolution depends entirely on whether Q1 FY27 repeats. One strong quarter closes the gap on paper. Four are needed to close it in cash.
Sustainability Classification
SUSTAINABLE
The Re.1 interim dividend is classified as Sustainable, with one qualification on the full-year run-rate.
Supporting the classification
- • Covered 2.64x by the current quarter's earnings
- • Zero debt; no lender restrictions on distribution
- • ₹1,081.93 crore net worth as a buffer
- • Ten consecutive years of uninterrupted payment
- • Payout discipline held at ~55% for three years
- • Earnings trend just inflected sharply upward
The qualification
- • FCF coverage of only 1.03x in FY25 and 1.34x in FY26
- • ₹200 crore capex competes for the same cash in FY27
- • Revenue fell 8.7% in FY26; growth is not yet proven
- • Five-year sales CAGR of 0%
- • Working capital lengthening (129 days in FY26)
- • No published dividend policy or payout guidance
In plain terms: this specific Re.1 payment is safe. Whether BEPL sustains four such payments through FY27 while simultaneously spending ₹200 crore on capacity is a question the H1 results will begin to answer.
Peer Comparison
Styrenics Peer Set
| Metric | BEPL | Styrenix Performance Materials | Supreme Petrochem | Sector Avg |
|---|---|---|---|---|
| Dividend Yield | 3.00% | 1.13% – 2.51% | 1.39% | ≈0.80% |
| Dividend Payout Ratio | 55.3% | 74.3% | 48% | — |
| Return on Equity | 17.3% | 29.5% | Not Disclosed | — |
| Return on Capital Employed | 23.8% | 37.5% | Not Disclosed | — |
| Balance Sheet | Zero debt | Low debt | Low debt | — |
| Market Cap | ≈₹3,180 Cr | ≈₹4,125 Cr | ≈₹13,380 Cr | — |
| Dividend Pattern | 4 × ₹1 quarterly | Large, uneven | Regular | — |
Peer data compiled from public financial data providers; measurement dates differ across sources. Yields move with price and should be re-checked before use.
Where BEPL Wins
- • Highest yield in the peer set at 3.00%, roughly 3.7x the chemicals sector average of 0.8% and well inside the top quartile of Indian dividend payers.
- • Most predictable rhythm. Four ₹1 instalments a year is easy for an income investor to plan around. Styrenix pays lumpy amounts (₹23, ₹31, ₹62, ₹80 at various points) on an uneven schedule — a much harder cash flow to budget.
- • Most conservative payout. At 55.3%, BEPL retains substantially more than Styrenix's 74.3%. A lower payout gives more room to absorb a bad quarter without cutting.
- • Cleanest balance sheet. Zero borrowings since FY18.
Where BEPL Lags
- • Materially lower returns on capital. Styrenix earns 29.5% ROE and 37.5% ROCE versus BEPL's 17.3% and 23.8%. That is not a small gap — Styrenix generates roughly 70% more return per rupee of equity.
- • The reason is partly the cash pile. BEPL's idle balance sheet dilutes returns. Styrenix's higher payout keeps its equity base leaner, which flatters ROE.
- • Scale disadvantage. Supreme Petrochem is roughly four times BEPL's market capitalisation with a broader product base.
- • Growth. BEPL's five-year sales CAGR is 0%; the peer set has generally grown faster.
The Trade-Off in One Sentence
BEPL offers the highest and most predictable yield with the safest balance sheet in its peer group, at the cost of the lowest returns on capital and the weakest growth record — which is precisely the trade-off an income-focused investor and a growth-focused investor would evaluate in opposite directions.
Promoter Impact Analysis
Shareholding Pattern (March 2026)
| Category | Holding | Dividend Received |
|---|---|---|
| Promoters | 57.48% | ₹14.30 crore |
| Foreign Institutional Investors | 1.36% | ₹0.34 crore |
| Domestic Institutional Investors | 0.00% | ₹0.00 crore |
| Public & Retail | 41.16% | ₹10.24 crore |
| Total | 100.00% | ₹24.89 crore |
Number of shareholders: 1,13,545 as at March 2026.
Reading the Distribution
₹14.30 crore of the ₹24.89 crore — 57.5% — goes to the promoter family (B.M. Bhansali, Jayesh B. Bhansali and associates). On the full ₹4 annual run-rate, promoter dividend income is approximately ₹57.22 crore a year.
Is that a problem? Not inherently. Every rupee of dividend is paid pro-rata; the promoter receives more only because they own more. Unlike related-party transactions or excessive managerial remuneration, dividends are the most shareholder-neutral form of distribution available. If anything, high promoter ownership aligns incentives — the family has ₹57 crore a year of reasons to keep the payout intact.
The reasonable question a governance-minded reader might ask is whether the payout policy is calibrated to promoter liquidity needs rather than optimal capital allocation. There is no evidence of this at BEPL — the payout of 55% is moderate, not aggressive, and promoter holding has been static at 57.48% for over two years with no pledging or selling reported. But it is the right question to hold in mind at any promoter-heavy company.
The Institutional Absence Is the Real Story
The number worth staring at is not the promoter's 57.48%. It is DII holding of 0.00%.
Indian mutual funds, insurers and pension funds hold zero in BEPL as at March 2026 — down from a peak of 1.69% in FY19. FIIs hold just 1.36%. Combined institutional ownership is under 1.4%, in a company with a ₹3,180 crore market cap, zero debt and a 3% dividend yield.
Two readings, both worth holding:
- • Opportunity: a genuinely under-followed stock where institutional re-entry could be a meaningful demand catalyst.
- • Warning: professional investors with full analytical resources have looked at a debt-free, dividend-paying, 24% ROCE business and consistently chosen not to own it. Zero DII holding is a deliberate collective judgement, most likely about the 0% five-year sales growth and the commodity cyclicality — not an oversight.
The practical consequence for retail holders: with 41.16% public float and negligible institutional support, price discovery is retail-driven and can be volatile. The 10.43% single-day move on 20 July 2026 is characteristic.
Taxation Analysis
How Dividends Are Taxed in India
Until 31 March 2020, companies paid Dividend Distribution Tax (DDT) and dividends were tax-free in the investor's hands. The Finance Act 2020 abolished DDT and shifted the burden entirely to the shareholder. Since 1 April 2020:
- • Dividend income is taxable as "Income from Other Sources" and added to your total income.
- • It is taxed at your applicable slab rate — 0%, 5%, 10%, 15%, 20%, 25% or 30% depending on income and regime, plus applicable surcharge and 4% Health & Education Cess.
- • There is no exemption limit and no concessional rate for resident individuals.
- • Surcharge on dividend income is capped at 15%, even for very high income earners who otherwise face 25% or 37% surcharge.
- • You may deduct interest expense on money borrowed to invest, limited to 20% of the dividend income. No other expense is deductible.
TDS Rules — Section 194
| Situation | TDS Rate | Notes |
|---|---|---|
| Resident individual, dividend from one company ≤ ₹10,000 in the FY | Nil | Threshold raised from ₹5,000 to ₹10,000 with effect from 1 April 2025 |
| Resident individual, dividend exceeding ₹10,000 in the FY | 10% | Deducted on the full amount, not just the excess |
| PAN not furnished / inoperative PAN | 20% | Section 206AA |
| Form 15G / 15H submitted, income below taxable limit | Nil | 15G for under-60s, 15H for senior citizens; file with the RTA before the record date |
| Non-resident / NRI | 20% + surcharge & cess | Section 195; a lower DTAA rate may apply with valid TRC and Form 10F |
TDS is not your final tax. It is an advance credit. If your slab rate is 30%, the 10% withheld leaves 20% plus cess still payable when you file. Claim the TDS credit against your final liability using Form 26AS / AIS. If your slab is below 10%, you claim a refund.
Worked Example — Standard Illustration
An investor holds 1,000 shares, dividend is ₹10 per share, and the investor is in the 30% tax slab.
| Gross Dividend (1,000 × ₹10) | ₹10,000 |
| TDS under Section 194 | ₹0 (does not exceed the ₹10,000 threshold) |
| Amount credited to bank | ₹10,000 |
| Tax at 30% slab | ₹3,000 |
| Health & Education Cess at 4% | ₹120 |
| Total tax (effective 31.2%) | ₹3,120 |
| Net Dividend in hand | ₹6,880 |
| Gross yield at CMP ₹133.30 | 7.50% |
| Effective post-tax yield | 5.16% |
Note the trap in the threshold: at ₹10,000 exactly, no TDS is deducted and the full amount hits your account — but ₹3,120 of tax is still owed. Investors who treat the credited amount as net income are setting themselves up for a shortfall at filing time.
Worked Example — Actual BEPL Dividend
The same investor holding 1,000 BEPL shares receiving this Re.1 interim dividend, at a 30% slab:
| Gross Dividend (1,000 × ₹1) | ₹1,000 |
| TDS | ₹0 |
| Tax at 31.2% | ₹312 |
| Net Dividend | ₹688 |
| Investment value at ₹133.30 | ₹1,33,300 |
| Pre-tax yield on this dividend | 0.75% |
| Post-tax yield on this dividend | 0.52% |
Scaled to the full ₹4 annual run-rate on 1,000 shares: gross ₹4,000, tax ₹1,248, net ₹2,752. Annual post-tax yield on a ₹1,33,300 position works out to 2.06% versus the 3.00% headline. A 30%-slab investor loses roughly one-third of the headline yield to tax. Investors in lower slabs keep proportionately more — which is why dividend yield comparisons across investors are less meaningful than they look.
Note: tax rules change with each Finance Act and individual circumstances vary considerably. This section is general information, not tax advice. Consult a qualified chartered accountant or tax professional for your specific situation.
Key Risks
1. Raw Material Price Volatility
Material cost is 69.22% of revenue, up 133 bps year-on-year. ABS production depends on styrene, acrylonitrile and butadiene — all crude-linked petrochemical feedstocks with violent price swings. A 5% adverse move in input cost, unrecovered, would erase roughly 3.5% of revenue in gross margin — approximately ₹16.5 crore per quarter at current volumes, more than half of one quarterly dividend outflow.
2. Growth Has Not Been Established
Five-year compounded sales growth is 0%. FY26 revenue declined 8.7%. EPS moved from ₹7.21 to ₹7.24 across three full years. Q1 FY27's 53% jump is a single data point against a three-year flat line. If it proves to be a favourable pricing quarter rather than a structural inflection, the FY27 cash flow arithmetic that makes the dividend and capex coexist stops working.
3. Single-Segment Concentration
BEPL discloses that it operates in a single segment — "Highly Specialized Engineering Thermoplastics." There is no diversification cushion. End-demand is concentrated in automobiles, home appliances and consumer electronics — all discretionary, all cyclical, and all correlated with the same macro conditions. A simultaneous auto and white-goods slowdown hits the entire business at once.
4. Import Competition and Trade Policy
A substantial share of Indian ABS demand is met by imports from Korea, Taiwan and China. BEPL's investment case rests explicitly on import substitution and its position as one of India's lowest-cost ABS producers. That advantage is exposed to global capacity gluts, dumping, and any change in Indian anti-dumping duties or trade agreements. A single adverse policy decision can compress domestic realisations regardless of BEPL's own execution.
5. Capex Execution Risk
The ₹200 crore debottlenecking from 75,000 to 100,000 MTPA targets commissioning by September 2026 — approximately two months from this announcement — with optimal utilisation only expected in FY28. Delays or cost overruns absorb cash without generating revenue. Worse, 25,000 MTPA of new capacity arriving into a soft demand year would pressure realisations rather than lift volumes.
6. Thin Free Cash Flow Coverage
In FY25, dividends consumed 96.6% of free cash flow (₹99.54 Cr against ₹103 Cr FCF). FY26 improved to 1.34x coverage. Layer ₹200 crore of capex onto FY27 and total commitments reach ₹299.54 crore against FY26 operating cash flow of ₹168 crore — a gap of ₹131.54 crore. The reserves absorb this comfortably once. Twice is a different conversation.
7. Other Income Dependence
Other income was ₹40 crore in FY26 — 22% of net profit — and comes largely from treasury deployment of the idle cash pile. As ₹200 crore of that cash converts into plant and machinery, this income stream shrinks. Q1 FY27 already showed other income down 14.14% year-on-year. Operating performance must improve just to hold total profit flat.
8. Working Capital Deterioration
FY26 saw debtor days rise to 73, inventory days nearly double to 79, and working capital days climb to 129 — in a year when revenue fell. Rapid growth in FY27 will consume working capital aggressively. Cash locked in receivables and stock is cash not available for dividends.
9. Negligible Institutional Ownership
DII holding is 0.00% and FII holding is 1.36%. With 41.16% public float and virtually no institutional anchor, price action is retail-driven and volatile — the stock moved 10.43% in a single session on 20 July 2026. It also means little independent institutional scrutiny of management decisions.
10. No Dividend Guarantee
Interim dividends are declared at the Board's discretion, quarter by quarter. BEPL has published no formal dividend distribution policy target and issued no FY27 payout guidance. The company has already demonstrated it will vary payouts dramatically — from ₹0.20 in FY17 to ₹17.00 in FY23 to ₹4.00 today. History is a pattern, not a promise.
What To Monitor
1. Whether Q1 FY27 Repeats in Q2
The entire sustainability case rests on this. Q2 FY27 results (expected around late October / November 2026) will show whether ₹472 crore of quarterly revenue and ₹65.60 crore of PAT are the new base or a single strong quarter. Benchmark to watch: revenue above ₹420 crore and PAT above ₹55 crore. Anything materially below suggests Q1 was pricing-driven.
2. The H1 FY27 Cash Flow Statement
Half-yearly results carry a mandatory cash flow statement — the first hard cash data since FY26. Watch OCF as a percentage of PAT. Above 90% confirms the profit is real. Below 70% (as in FY25's 61%) means growth is being funded into receivables and inventory rather than converting to cash, and the dividend is being paid from the balance sheet rather than the business.
3. Debottlenecking Commissioning by September 2026
Track exchange announcements for confirmation that the 100,000 MTPA capacity is commissioned on schedule and for the actual capex spent versus the ₹200 crore budget. Then track capacity utilisation quarterly through FY27 and FY28. Management has guided to optimal utilisation in FY28 — a slip in that timeline stretches the cash drain by a full year.
4. Traded Goods as a Share of Revenue
Purchase of stock-in-trade rose from 6.33% to 15.91% of revenue. Monitor whether this keeps climbing. Rising trading share means the revenue growth is lower-margin and less durable than manufacturing growth. If it retreats towards single digits while revenue holds, the quality of growth is improving. Ask management for the manufactured-versus-traded margin split.
5. Operating Margin Excluding Other Income
Ignore headline EBITDA margins that bundle in treasury income. Compute operating EBITDA margin as (Revenue − Expenses excluding finance and depreciation) ÷ Revenue. The Q1 FY27 figure was 17.49%. Sustained expansion above 18% signals genuine pricing power; slippage below 16% signals input cost pass-through failure.
6. Debtor and Inventory Days
FY26 ended at 73 debtor days and 79 inventory days. In a 53%-growth environment these can balloon quickly. Watch the annual report ratios and the half-yearly balance sheet. Working capital days pushing beyond 140 would be a genuine warning that growth is consuming rather than generating cash.
7. The Next Three Dividend Declarations
BEPL has paid four ₹1 instalments annually for three years. Track whether the 2nd, 3rd and final FY27 dividends arrive on the usual cadence — roughly October, January and the year-end recommendation. A skipped instalment or a reduction to ₹0.50 would be the clearest possible signal that the ₹200 crore capex is squeezing distributable cash.
8. Other Income Trajectory
Other income of ₹40 crore in FY26 represented 22% of net profit. As cash converts into fixed assets, expect this to fall. Q1 FY27 was already down 14.14%. Model the decline explicitly — if other income halves to ₹20 crore in FY27, operating profit must grow by ₹20 crore just to hold PAT flat. Many published forecasts overlook this.
9. ABS Import Volumes and Trade Duties
Monitor DGTR notifications on anti-dumping investigations covering ABS resins, and monthly import data for styrenic polymers. Rising import volumes at falling prices directly compress BEPL's realisations — the very lever that drove Q1 FY27's 53% growth. This is the single external variable with the most influence on BEPL's earnings.
10. Institutional Shareholding Pattern
DII holding has been 0.00% for three consecutive quarters. Watch quarterly shareholding filings. Any DII entry above 0.5% would mark a shift in professional sentiment and would likely be a meaningful demand catalyst in a stock with only 41% public float. Continued zero suggests institutions remain unconvinced by the growth story.
Conclusion
What This Announcement Actually Tells Us
Bhansali Engineering Polymers has declared its 1st Interim Dividend of Re.1 per share for FY 2026-27, costing ₹24.89 crore, with a record date of 23rd July 2026 and payment on or before 16th August 2026. On its own, that is routine — the eleventh consecutive quarterly-cadence ₹1 dividend from a company that has paid without interruption for a decade.
What makes it worth analysing is the context. This dividend arrives with a genuinely strong quarter behind it — revenue up 53.34%, PAT up 42.95%, operating margin expanded 42 basis points on a like-for-like basis — and a large cash commitment in front of it.
Positives
- • Dividend covered 2.64x by the current quarter's earnings
- • Zero debt since FY18; net worth of ₹1,081.93 crore
- • Ten straight years of dividends; 33 declarations since 2003
- • Disciplined 55% payout, lower than peer Styrenix's 74.3%
- • Yield of 3.00% versus sector average of ~0.8%
- • Operating margin expanded once treasury income is stripped out
- • ₹200 crore expansion funded without adding a rupee of debt
- • ROCE of 23.8% remains healthy in absolute terms
- • Every rupee distributed pro-rata; no promoter-favouring structure
Negatives
- • Five-year sales CAGR of 0%; FY26 revenue fell 8.7%
- • EPS moved just ₹7.21 → ₹7.24 over three years
- • FCF coverage of only 1.03x in FY25, 1.34x in FY26
- • FY27 commitments of ₹299.54 crore versus FY26 OCF of ₹168 crore
- • Traded goods jumped to 15.91% of revenue from 6.33%
- • Material cost intensity worsened 133 bps
- • Other income (22% of PAT) will shrink as cash is deployed
- • Working capital lengthened to 129 days as revenue fell
- • ROE compressing: 25% (10yr) → 21% (5yr) → 17.3% (last year)
- • DII holding of 0.00%; institutions absent
The Question That Decides It
Everything reduces to one issue: is Q1 FY27 an inflection or an outlier?
If it is an inflection, BEPL annualises to roughly ₹262 crore of profit, the ₹4 dividend becomes a 38% payout, the ₹200 crore capex is funded from the year's own cash flow, the new 100,000 MTPA capacity meets rising import-substitution demand, and today's 3.0% yield sits on a growing earnings base. That is a genuinely attractive income proposition.
If it is an outlier — a favourable realisations quarter helped by a 285% jump in lower-margin traded goods, in a business with 0% five-year sales growth — then FY27 looks like FY26: roughly ₹168 crore of operating cash flow against ₹299.54 crore of commitments, funded by drawing down reserves. The dividend survives on balance sheet strength rather than business performance, which is sustainable for a year or two and not indefinitely.
We do not know which it is, and neither does anyone else after one quarter. What we can say is that the Re.1 being paid on 16th August 2026 is safe, that BEPL has the balance sheet to absorb a bad year, and that the evidence which settles the question will arrive in the H1 FY27 cash flow statement. Readers can weigh those facts against their own objectives.
Frequently Asked Questions
What dividend has Bhansali Engineering Polymers announced?
What is the dividend yield on this announcement?
What is the record date for the BEPL dividend?
What is the ex-dividend date and why does it matter?
When will the BEPL dividend be paid?
Who is eligible to receive this dividend?
How will this dividend be taxed?
Is BEPL's dividend sustainable?
What is BEPL's dividend history?
What should investors monitor going forward?
Do I need to hold BEPL shares until the payment date to receive the dividend?
Why did BEPL's share price jump after this announcement?
Does this interim dividend need shareholder approval at the AGM?
How much of this dividend goes to the promoters?
Can BEPL afford this dividend alongside its ₹200 crore capex?
Disclaimer
This article is published by ShareBazaar Online for informational and educational purposes only. It does not constitute investment advice, a recommendation, or an offer or solicitation to buy or sell any security. ShareBazaar Online does not provide buy, sell or hold recommendations.
All figures relating to the dividend declaration, financial results and corporate dates are sourced from Bhansali Engineering Polymers Limited's official filing to BSE Limited and the National Stock Exchange of India Limited dated 18th July 2026 (Ref: BEPL/SEC/2026/222) and the accompanying un-audited standalone and consolidated financial results for the quarter ended 30th June 2026, which carry a Limited Review Report from M/s. Azad Jain & Co., Chartered Accountants — not a full audit opinion.
Market prices, shareholding patterns, historical dividend records, cash flow statements, peer comparisons and return ratios are sourced from public exchange data and third-party financial data providers. Measurement dates differ across sources and figures may have changed since publication. Readers should verify all data independently before acting.
Ratios, coverage calculations and forward-looking scenarios presented here are ShareBazaar Online's own computations based on the above data and are stated as analysis, not as company disclosure. Where information was unavailable, we have stated "Not Disclosed by Company" rather than estimating.
Investments in securities are subject to market risks. Past dividend payments do not guarantee future dividends — interim dividends are declared at the Board's discretion and may be reduced, deferred or discontinued. Past performance is not indicative of future results. Taxation commentary is general in nature and based on rules prevailing at the time of writing; consult a qualified chartered accountant or SEBI-registered investment adviser regarding your individual circumstances.
ShareBazaar Online and its authors may or may not hold positions in the securities discussed. No compensation has been received from any company mentioned for the publication of this analysis.
Explore More Investment Opportunities
Discover IPOs, unlisted shares, and broker comparison tools curated for smart investors.