
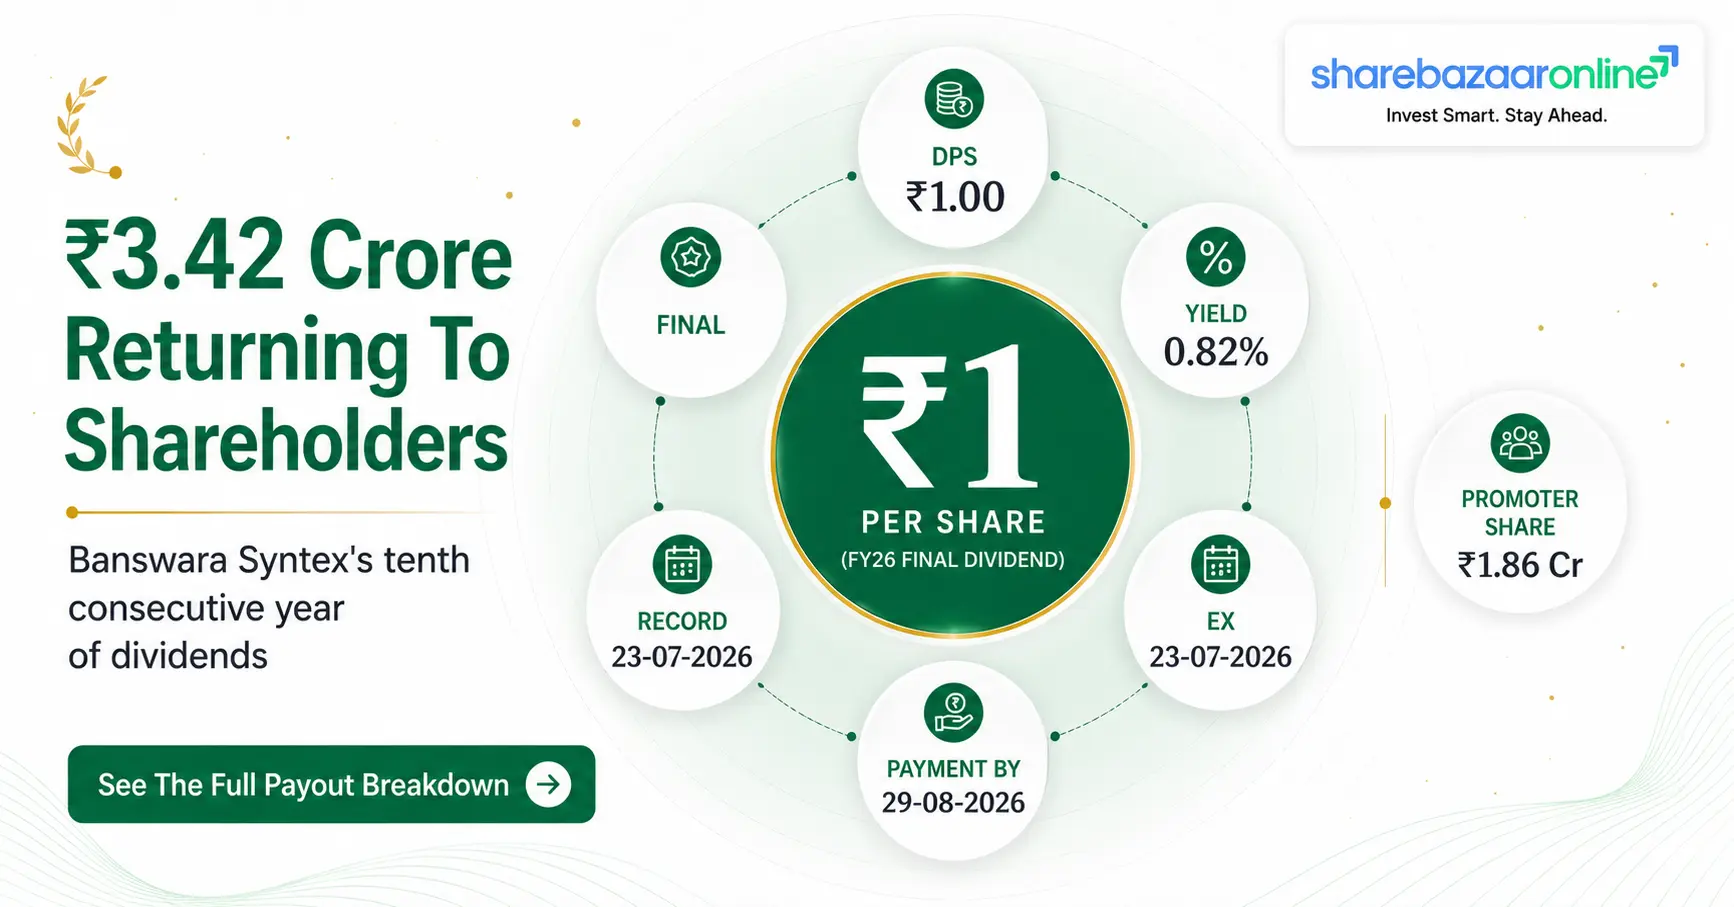
Dividend Snapshot
Banswara Syntex Limited, a 50-year-old vertically integrated textile manufacturer from Banswara, Rajasthan, has recommended a Final Dividend of ₹1 per equity share for the financial year ended 31 March 2026. On a face value of ₹5, this works out to a dividend rate of 20%. The total cash going out of the company is ₹3.42 crore — a number the company itself has disclosed in its results notes as ₹342.32 lakhs.
The headline figure investors should hold on to: this dividend costs the company ₹3.42 crore, while the company carried ₹473.66 crore of gross borrowings and just ₹1.60 crore of cash and cash equivalents on its consolidated balance sheet as at 31 March 2026. The dividend is small enough to be comfortably paid, but it is being paid by a business that is heavily leveraged.
Company & Listing Details
Company Name: Banswara Syntex Limited
NSE Symbol: BANSWRAS
BSE Scrip Code: 503722
ISIN: INE629D01020
CIN: L24302RJ1976PLC001684
Sector: Textiles — Yarn, Fabric & Garments
Registered Office: Industrial Area, Dahod Road, Banswara, Rajasthan 327001
Dividend Details
Dividend Type: Final Dividend
Dividend Per Share: ₹1.00
Dividend Percentage: 20%
Face Value: ₹5 per share
Financial Year: FY 2025-26
Total Dividend Outflow: ₹3.42 Crore
Shares Outstanding: 3,42,32,000
Paid-up Share Capital: ₹17.12 Crore
AGM Approval Required: Yes — 50th AGM on 30 July 2026
Yield & Coverage At A Glance
Dividend Yield (latest CMP ₹122.67): 0.82%
Dividend Payout Ratio (Consolidated): 10.97%
Dividend Coverage Ratio: 9.11x
Free Cash Flow Coverage: 6.10x
Operating Cash Flow Coverage: 34.47x
Cash & Equivalents Coverage: 0.47x
Board Meeting & Governance Actions
The board meeting on 19 May 2026 ran from 3:30 PM to 6:00 PM and did far more than approve a dividend. The board also re-appointed the Chairman, Vice-Chairman and Managing Director for three years from 1 January 2027, appointed Mr. Udeypaul Singh Gill as an Independent Director, changed the Registrar and Share Transfer Agent from Computech Sharecap to Bigshare Services, and accepted the resignation of the Company Secretary and Compliance Officer, Mr. Ketan Kumar Dave, with effect from the same day.
Dividend Announcement Summary
What The Board Actually Said
The exchange filing (Reference BSL/SEC/2026-27/07) states that the board recommended a final dividend of ₹1 per equity share of ₹5 each for the financial year ended 31 March 2026, subject to the approval of members at the ensuing Annual General Meeting. The word "recommended" matters. A final dividend is only a proposal until shareholders vote it through. Until 30 July 2026, this is a board recommendation, not a declared dividend.
Note 4 to both the standalone and consolidated results confirms the arithmetic independently: "if approved, would result in a cash outflow of Rs. 342.32 lakhs." That is ₹3.42 crore, and it ties exactly to 3,42,32,000 shares multiplied by ₹1.
Board Recommendations Passed
- Audited standalone and consolidated results for Q4 and FY26, with an unmodified (clean) audit opinion from K.G. Somani & Co. LLP
- Final dividend of ₹1 per share for FY 2025-26
- Re-appointment of Ankit Maheshwari & Associates as Chief Internal Auditor for FY 2026-27
- Re-appointment of K.G. Goyal & Company as Cost Auditor for FY 2026-27
- Re-appointment of Mr. Rakesh Mehra (Chairman), Mr. Ravindrakumar Toshniwal (Vice-Chairman) and Mr. Shaleen Toshniwal (Managing Director) for three years from 1 January 2027 to 31 December 2029
- Appointment of Mr. Udeypaul Singh Gill as Non-Executive Independent Director for five years from 20 May 2026
- Change of RTA to Bigshare Services Private Limited
Management Commentary
The board outcome filing carries no narrative management commentary on the dividend, on capital allocation policy, or on the FY27 outlook. There is no explanation of why ₹1 was chosen, no stated dividend policy target, and no discussion of the trade-off against debt reduction.
On the substance of the dividend decision itself: Not Disclosed by Company.
Two governance points the filing does disclose and readers should note. First, the Company Secretary and Compliance Officer resigned effective 19 May 2026 — the same day as the results — with the stated reason being "better prospects" and confirmation that there is no other material reason. Second, the entire executive leadership is family-connected: Mr. Rakesh Mehra, Mr. Ravindrakumar Toshniwal, Mr. Shaleen Toshniwal and Mrs. Kavita Soni are disclosed in Annexure IV as brothers, brothers-in-law and sister.
Key Dates Timeline
The Six Dates That Matter
| Event | Date | What It Means For You |
|---|---|---|
| Board Announcement | 19 May 2026 | Board recommended the dividend |
| Ex-Dividend Date | 23 July 2026 | Buy on or after this date and you do not get the dividend |
| Record Date | 23 July 2026 | Your name must be on the register on this date |
| E-Voting Window | 25–29 July 2026 | Shareholders vote on the dividend resolution |
| 50th AGM | 30 July 2026, 5:00 PM IST | Dividend becomes legally declared if approved (video conferencing) |
| Payment Date | On or before 29 August 2026 | Statutory limit is 30 days from AGM; exact date Not Disclosed by Company |
Record date, AGM date and e-voting window per company intimation to exchanges, reported by ScanX (July 2026). Payment date is derived from the statutory 30-day limit under Section 127 of the Companies Act, 2013.
Why Ex-Date And Record Date Are The Same Day
Indian equity markets moved to T+1 settlement, meaning a trade settles one working day after it is executed. Under T+1, the ex-date and record date fall on the same calendar day. So to be eligible, you must have bought the share on or before 22 July 2026 — the previous trading day. Buying on 23 July 2026 itself is too late.
Last year the company followed the identical pattern: ex-date and record date were both 23 July 2025, with payment on 28 August 2025.
Action Required Before The Record Date
The company has notified shareholders that tax will be deducted at source in line with the Income Tax Act, and that the TDS rate depends on shareholder category and on PAN validity as available on the record date. Shareholders were asked to update PAN, residential status and bank mandate details with their depository participant or with the registrar, Computech Sharecap Limited, by 23 July 2026.
If your PAN is not linked or your bank mandate is stale, the practical consequence is a higher TDS deduction and a delayed or failed credit.
Dividend Yield Analysis
The Yield Calculation, Step By Step
Dividend Yield tells you what percentage of your purchase price comes back to you as cash in a year. The formula is Dividend Per Share divided by Current Market Price, multiplied by 100.
| Basis | Share Price | Yield |
|---|---|---|
| Latest verified CMP (14 July 2026) | ₹122.67 | 0.82% |
| Post-announcement price (12 June 2026) | ₹126.85 | 0.79% |
| Announcement date close (19 May 2026) | Not Publicly Verified | Not Publicly Verified |
| 52-week high basis (₹165.49) | ₹165.49 | 0.60% |
CMP of ₹122.67 as reported by Share.Market for NSE on 14 July 2026; ₹126.85 as reported by Mirae Asset Sharekhan for 12 June 2026; 52-week high per Kotak Neo. We could not verify an authoritative NSE closing price for 19 May 2026 and have therefore not computed an announcement-date yield rather than estimating one.
Yield Reality Check — Why Is It Only 0.82%?
A yield below 1% is low. But the reason here is not a falling business or a weak payout decision made under stress. It is a deliberate choice to keep the payout tiny.
Consider the counterfactual. The company earned an EPS of ₹9.11 on a consolidated basis in FY26. If the board had paid out a typical Indian mid-cap payout of 30%, the dividend would have been about ₹2.73 per share and the yield would have been 2.23%. If it had matched its own FY2023 dividend of ₹3 per share, the yield today would be 2.45%.
So the low yield is a capital allocation choice, not a market signal. Management is retaining roughly ₹28 crore of the ₹31 crore it earned.
The Price Context You Should Not Miss
Banswara's share price has been under sustained pressure. The stock traded at a 52-week high of ₹165.49 and touched a low of ₹98.00 during the same window. It has recovered to the ₹120–₹127 zone as of July 2026.
Here is the important nuance: because the share price fell over the past year while the dividend stayed flat at ₹1, the yield mechanically rose from roughly 0.60% at the 52-week high to 0.82% today. A rising yield driven by a falling denominator is not the same thing as a rising yield driven by a growing dividend. Readers who screen on yield should understand which one they are looking at. In this case it is the former.
Dividend History Analysis
Ten-Year Dividend Record
| Ex-Date | Dividend Per Share | Type | Observation |
|---|---|---|---|
| 23 Jul 2026 (proposed) | ₹1.00 | Final | Third consecutive year at ₹1 |
| 23 Jul 2025 | ₹1.00 | Final | Flat |
| 30 Jul 2024 | ₹1.00 | Final | Cut of 67% from prior year |
| 28 Jul 2023 | ₹3.00 | Final | Peak payout year |
| 21 Jul 2022 | ₹1.25 | Final | Post-Covid recovery |
| 16 Sep 2021 | ₹0.75 | Final | Covid-affected year |
| 27 Feb 2020 | ₹0.75 | Interim | Only interim in the decade |
| 19 Sep 2019 | ₹0.50 | Final | Low base |
| 14 Sep 2018 | ₹0.50 | Final | Flat |
| 6 Sep 2017 | ₹0.50 | Final | Flat |
| 18 Aug 2016 | ₹1.00 | Final | Pre-split face value era |
Historical dividend and date data compiled from TipRanks dividend history for BANSWRAS. Important caveat: the company's face value has changed over this period (older records reflect a ₹10 face value), so absolute per-share amounts across the full decade are not strictly like-for-like. The FY2022 through FY2026 entries are on the current ₹5 face value and are directly comparable.
Classification: Consistent Payer, But Not A Growing One
Banswara has paid a dividend in every one of the last ten years. There is no suspension anywhere in the record — not even in FY2021, the Covid year, when it still paid ₹0.75. On the test of consistency, this is a Consistent Payer.
On the test of growth, the picture is far less flattering. The dividend went ₹0.50 → ₹0.75 → ₹1.25 → ₹3.00 → ₹1.00 → ₹1.00 → ₹1.00. The ₹3 paid in FY2023 was a one-off spike that followed an exceptional profit year, and it was cut by 67% the very next year. Since then the dividend has been frozen at ₹1 for three straight years even as consolidated EPS moved from ₹10.38 (FY2024) to ₹6.47 (FY2025) to ₹9.11 (FY2026).
What The Flat ₹1 Actually Tells You
Between FY2025 and FY2026, consolidated profit rose 40.8%, from ₹22.16 crore to ₹31.20 crore. The dividend did not move at all.
There are two readings of this. The generous one: management is being disciplined, refusing to raise a payout it may not be able to sustain, and is instead directing cash toward a heavy capital expenditure programme. The sceptical one: a company earning ₹9.11 per share and paying ₹1 is effectively telling shareholders that it needs almost all its earnings internally — which is consistent with a balance sheet carrying ₹473.66 crore of debt.
Both readings are defensible. What is not defensible is treating ₹1 as evidence of a strong dividend franchise. It is not.
Financial Performance Analysis
FY2026 Consolidated Results (₹ Crore)
| Particulars | FY2026 | FY2025 | Change |
|---|---|---|---|
| Revenue From Operations | 1,356.28 | 1,292.53 | +4.93% |
| Other Income | 13.86 | 15.74 | -11.94% |
| Total Income | 1,370.14 | 1,308.27 | +4.73% |
| Cost of Materials Consumed | 557.66 | 576.33 | -3.24% |
| Employee Benefits Expense | 320.66 | 294.93 | +8.72% |
| Power & Fuel | 134.87 | 136.63 | -1.29% |
| Other Expenses | 200.04 | 214.78 | -6.86% |
| Finance Costs | 42.55 | 39.59 | +7.48% |
| Depreciation & Amortisation | 53.20 | 47.93 | +11.00% |
| EBITDA (computed) | 128.57 | 101.13 | +27.13% |
| Profit Before Exceptional Item & Tax | 46.68 | 29.34 | +59.09% |
| Exceptional Item (Labour Codes) | (8.91) | — | New |
| Share of Profit in Joint Venture | 3.99 | 1.79 | +122.5% |
| Profit Before Tax | 41.76 | 31.14 | +34.13% |
| Profit After Tax | 31.20 | 22.16 | +40.81% |
| Basic EPS (₹) | 9.11 | 6.47 | +40.80% |
All figures from the audited consolidated financial results filed with BSE and NSE on 19 May 2026, converted from ₹ lakhs to ₹ crore. EBITDA is computed by ShareBazaar Online as Revenue from Operations less total expenses, adding back finance costs and depreciation.
Operating Leverage: The Good News
This is the strongest part of Banswara's FY26. Revenue grew a modest 4.93%, but EBITDA grew 27.13% and PAT grew 40.81%. Profits growing roughly eight times faster than revenue is textbook positive operating leverage.
The mechanism is visible in the cost lines. Cost of materials consumed fell 3.24% in absolute rupees while revenue rose — meaning raw material cost as a share of revenue dropped from 44.59% to 41.12%, a gain of roughly 347 basis points. Other expenses fell 6.86% and power and fuel fell 1.29%, both in absolute terms.
EBITDA margin therefore expanded from 7.82% to 9.48%. For a commodity-exposed textile business, a 166 basis point margin gain in a single year is meaningful.
Where The Pressure Still Sits
Three cost lines went the wrong way and deserve attention.
Employee costs rose 8.72% to ₹320.66 crore, nearly double the revenue growth rate. Employee cost as a share of revenue climbed from 22.82% to 23.64%. In a labour-intensive garment and fabric business, this is a structural headwind, not a one-off.
Finance costs rose 7.48% to ₹42.55 crore. To put that in perspective, the company paid 12.4 times more in interest than it is paying in dividends. Lenders are the primary claimant on this company's cash, not shareholders.
Depreciation rose 11.00% to ₹53.20 crore, reflecting the large capex programme. This will keep climbing as capital work-in-progress of ₹30.16 crore is capitalised.
The Exceptional Item Investors Must Understand
FY26 carries a ₹8.91 crore exceptional charge. The company explains in Note 5 that the Government of India notified the four Labour Codes — the Code on Wages 2019, the Industrial Relations Code 2020, the Code on Social Security 2020, and the Occupational Safety, Health and Working Conditions Code 2020 — with effect from 21 November 2025, subsuming and rationalising 29 existing labour laws. Banswara reassessed its employee benefit obligations and recognised ₹8.91 crore as an expense for past periods.
Two things follow. First, underlying profitability was better than the reported number: excluding this charge, profit before tax would have been roughly ₹50.67 crore rather than ₹41.76 crore. Second — and this is the part readers should file away — the company explicitly states that it "continues to monitor the finalisation of the State Rules and further clarifications from the Government, and any additional impact, if any, will be accounted for in the future period." In plain English: this charge may not be the last one. Labour Code compliance also raises the recurring cost base going forward, which connects directly to the 8.72% employee cost rise.
Q4 FY26 Performance
Consolidated Q4 revenue was ₹365.65 crore against ₹340.08 crore in Q4 FY25, up 7.52%. Consolidated Q4 PAT nearly doubled to ₹11.49 crore from ₹5.87 crore. Q4 EPS was ₹3.36 versus ₹1.71.
However, Q4 profit was lower than Q3 FY26's ₹13.998 crore, and Q4 absorbed the entire ₹8.91 crore Labour Code charge. Sequentially the business was not accelerating.
Consolidated vs Standalone — And Why It Matters Here
Our analysis uses consolidated numbers, but the gap between the two is instructive. Standalone PAT was ₹28.40 crore (EPS ₹8.30); consolidated PAT was ₹31.20 crore (EPS ₹9.11).
The ₹2.80 crore difference comes from two entities. The joint venture Tesca Textile & Seat Components (India) Private Limited contributed a share of profit of ₹3.99 crore. The wholly owned subsidiary Banswara Brands Private Limited contributed a share of net loss of ₹2.46 crore on total revenues of just ₹1.40 crore and total assets of ₹3.20 crore. The parent also invested a further ₹2.00 crore in Banswara Brands during the year and booked a ₹1.29 crore impairment provision against its investment in the wholly owned subsidiary in the standalone accounts.
In short: the joint venture is doing the heavy lifting on the consolidation, and the branded subsidiary is currently a cash drain. That is a detail most quick summaries of this result miss entirely.
Cash Flow Analysis
Reported Profits Are Opinions. Cash Is Fact.
| Consolidated Cash Flow (₹ Crore) | FY2026 | FY2025 |
|---|---|---|
| Net Profit Before Tax | 41.76 | 31.14 |
| Operating Profit Before Working Capital Changes | 133.85 | 115.00 |
| Increase in Trade & Other Receivables | (44.91) | (3.47) |
| Decrease/(Increase) in Inventories | 9.93 | (41.09) |
| Increase in Trade Payables & Others | 25.22 | 7.99 |
| Cash Generated From Operations | 126.18 | 88.27 |
| Direct Tax Paid | (8.19) | (11.05) |
| Net Cash From Operating Activities | 117.99 | 77.22 |
| Acquisition of Property, Plant & Equipment | (97.12) | (144.37) |
| Free Cash Flow (computed) | 20.87 | (67.15) |
| Net Cash Used In Investing Activities | (95.01) | (136.97) |
| Interest Paid | (42.57) | (39.56) |
| Dividend Paid | (3.42) | (3.42) |
| Net Cash From Financing Activities | (25.43) | 55.23 |
| Net Decrease In Cash | (2.45) | (4.51) |
| Closing Cash & Cash Equivalents | 1.60 | 4.05 |
From the audited consolidated statement of cash flow for the year ended 31 March 2026, converted from ₹ lakhs. Free Cash Flow is computed by ShareBazaar Online as Net Cash From Operating Activities less Acquisition of Property, Plant and Equipment.
Operating Cash Flow vs Net Profit — This Passes
Operating cash flow of ₹117.99 crore against PAT of ₹31.20 crore gives a cash conversion ratio of 3.78x. Operating cash flow also grew 52.8% year on year, faster than the 40.8% PAT growth.
This is a genuine strength and it is worth being explicit about why. The gap between profit and cash is largely non-cash charges: depreciation of ₹53.20 crore and finance costs of ₹42.55 crore added back. Both are real economic costs, so a 3.78x ratio is not evidence of extraordinary cash generation — it is evidence of a capital-heavy, debt-heavy business. But the reported profits are not fictional. The cash is arriving.
Receivables Growth vs Revenue Growth — This Does Not Pass
This is the single most important negative finding in the FY26 accounts and it deserves to be highlighted prominently.
Consolidated trade receivables rose from ₹201.49 crore to ₹243.53 crore — an increase of 20.86%. Revenue grew only 4.93%. Receivables grew at more than four times the rate of sales.
Translated into days: debtor days moved from roughly 56.9 days to 65.5 days, a deterioration of about 8.6 days. The cash flow statement confirms the drag directly — an outflow of ₹44.91 crore from the increase in trade and other receivables, against just ₹3.47 crore last year.
Why this matters: when receivables outrun sales this sharply, it can mean the company extended longer credit to win orders, that some customers are paying more slowly, or that a large sale landed close to year-end. The company does not explain which. The provision for doubtful advances and receivables did rise from ₹0.18 crore to ₹0.41 crore, which is a small number but a rising one. This is the metric to watch in Q1 and Q2 FY27.
How Is This Dividend Actually Being Funded?
This is the question that separates analysis from reporting, and the honest answer here is nuanced.
Not from cash reserves. Consolidated cash and cash equivalents at year end were ₹1.60 crore — less than half the ₹3.42 crore dividend. Cash on hand was ₹0.12 crore and the current account balance ₹1.47 crore. Even including other bank balances of ₹7.72 crore and current investments of ₹0.17 crore, total liquid resources are roughly ₹9.49 crore. The company does not hold a cash pile.
Not from asset sales. Proceeds from sale of property, plant and equipment were just ₹1.66 crore, and this was ordinary-course disposal, not a funding event.
Primarily from current-year operating cash flow. Operating cash flow of ₹117.99 crore covers the ₹3.42 crore dividend 34.47 times over. After capex of ₹97.12 crore, free cash flow of ₹20.87 crore still covers it 6.10 times. On this test the dividend is comfortably funded.
But there is a borrowing overlay. During FY26 the company drew ₹59.06 crore of new term loans, repaid ₹58.75 crore, took ₹3.27 crore of unsecured loans, repaid ₹2.71 crore, and increased working capital facilities by ₹20.79 crore. Gross borrowings rose from ₹452.13 crore to ₹473.66 crore — an increase of ₹21.53 crore. Money is fungible, so it is not accurate to say the dividend was borrowed. It is accurate to say that the company paid a dividend in a year in which its total debt increased. Readers should hold both facts together.
Balance Sheet Strength
Consolidated Balance Sheet As At 31 March 2026 (₹ Crore)
| Particulars | FY2026 | FY2025 | Change |
|---|---|---|---|
| Property, Plant & Equipment | 550.58 | 515.34 | +6.84% |
| Capital Work-in-Progress | 30.16 | 19.53 | +54.44% |
| Investment in Joint Venture (Equity Method) | 13.55 | 9.55 | +41.97% |
| Inventories | 303.19 | 313.12 | -3.17% |
| Trade Receivables | 243.53 | 201.49 | +20.86% |
| Cash & Cash Equivalents | 1.60 | 4.05 | -60.55% |
| Other Bank Balances | 7.72 | 9.82 | -21.41% |
| Total Assets | 1,272.20 | 1,196.64 | +6.31% |
| Total Equity | 584.90 | 559.37 | +4.56% |
| Non-Current Borrowings | 193.71 | 202.52 | -4.35% |
| Current Borrowings | 279.95 | 249.61 | +12.15% |
| Total Borrowings | 473.66 | 452.13 | +4.76% |
| Provisions (Non-Current) | 22.89 | 6.61 | +246.4% |
Key Ratios Computed
Net Debt: ₹464.17 Crore
Debt to Equity: 0.81x
Net Debt to EBITDA: 3.61x
Interest Coverage (EBIT/Finance Cost): 1.77x
Return on Equity (avg equity): 5.45%
Return on Capital Employed (computed): 8.43%
Book Value Per Share: ₹170.86
Debtor Days: 65.5 days (FY25: 56.9)
Inventory Days: 81.6 days (FY25: 88.4)
All ratios computed by ShareBazaar Online from the audited consolidated results. ROCE is calculated as (PBT + Finance Costs) divided by (Total Equity + Total Borrowings). Independent sources report a consolidated ROE of 5.45% for the last reported financial year, consistent with our computation.
Reading The Balance Sheet Honestly
The leverage is significant but not alarming. A debt-to-equity of 0.81x is manageable for a capital-intensive textile manufacturer. Net debt to EBITDA of 3.61x is on the higher side of comfortable; anything above 4x would start to constrain the business.
Interest coverage of 1.77x is the number that should worry you most. EBIT of ₹75.37 crore covers finance costs of ₹42.55 crore less than twice over. That is thin. A 30% fall in operating profit would take coverage close to 1.2x. This company has limited room for an operational stumble.
The debt mix shifted the wrong way. Long-term borrowings fell ₹8.81 crore while short-term borrowings rose ₹30.34 crore. Current borrowings now make up 59.1% of total debt, up from 55.2%. Short-term debt is cheaper but must be refinanced constantly, which increases rollover risk.
Non-current provisions jumped 246% from ₹6.61 crore to ₹22.89 crore — the balance sheet footprint of the Labour Code reassessment. Total current liabilities of ₹448.30 crore against current assets of ₹624.24 crore gives a current ratio of 1.39x, which is adequate but not generous.
The Valuation Context
Book value per share works out to ₹170.86 on the consolidated balance sheet, against a market price of roughly ₹122.67. That is a price-to-book of about 0.72x — the market is valuing the company at well below the accounting value of its net assets. Independent data providers report a P/B in the 0.62x to 0.70x range and a P/E around 13.07x as of mid-July 2026.
A sub-1x price-to-book usually signals one of two things: the market believes the assets will not earn an adequate return, or the market has simply overlooked the stock. An ROE of 5.45% — well below the roughly 9% cost of debt implied by ₹42.55 crore of finance costs on ₹473.66 crore of borrowings — supports the first explanation. The company is currently earning less on shareholder equity than it pays its lenders.
Dividend Sustainability Analysis
Verdict: Sustainable
On every quantitative coverage test, the ₹3.42 crore dividend is comfortably affordable. The reason is not that Banswara is a financially powerful company — it is that the dividend is deliberately tiny relative to the business. It represents 0.25% of revenue, 2.66% of EBITDA, and 0.72% of gross borrowings. There is essentially no realistic operating scenario in which the company cannot pay ₹3.42 crore.
The sustainability question that actually matters is different: can the dividend grow? On that, the evidence is far weaker.
The Four Tests
| Test | Result | Verdict |
|---|---|---|
| Earnings Coverage | 9.11x | Strong |
| Free Cash Flow Coverage | 6.10x | Strong |
| Operating Cash Flow Coverage | 34.47x | Strong |
| Cash & Equivalents Coverage | 0.47x | Weak |
| Cash + Bank + Investments Coverage | 2.77x | Adequate |
| Debt Trend While Paying | Debt up ₹21.53 Cr | Caution |
| Earnings Trend | PAT +40.8%, but volatile | Mixed |
Why "Sustainable" Is Not The Same As "Attractive"
A dividend that is 100% safe but yields 0.82% delivers very little to a shareholder. On a ₹1,00,000 investment at ₹122.67 per share (815 shares), the annual dividend is ₹815 before tax. For an investor in the 30% slab, that becomes roughly ₹561 after tax.
The earnings trend also deserves scrutiny beyond the headline. Consolidated EPS went ₹10.38 (FY2024) → ₹6.47 (FY2025) → ₹9.11 (FY2026). FY26 was a strong year, but the company has not yet regained its FY2024 earnings level. Independent analysis notes that EPS has declined roughly 16% over the last five years. This is a cyclical textile business, and the earnings base from which any future dividend increase would come is not stable.
Our classification: Sustainable on affordability, Constrained on growth.
Peer Comparison
Where Banswara Sits In The Textile Pack
Banswara Syntex is commonly benchmarked against Vardhman Textiles, Trident, Arvind, Welspun Living, Alok Industries and Grasim Industries within the Indian textiles universe. It is materially smaller than all of them — market capitalisation of roughly ₹412–435 crore against multi-thousand-crore peers — which means direct ratio comparisons should be read with care.
| Metric | Banswara Syntex | Listed Textile Peers |
|---|---|---|
| Dividend Yield | 0.82% | Not Independently Verified |
| Dividend Payout Ratio | 10.97% | Not Independently Verified |
| Return on Equity | 5.45% | Not Independently Verified |
| Return on Capital Employed | 8.43% | Not Independently Verified |
| Debt to Equity | 0.81x | Not Independently Verified |
| Price to Book | 0.72x | Not Independently Verified |
| Cash & Equivalents | ₹1.60 Cr | Not Independently Verified |
Editorial note: ShareBazaar Online does not publish peer financial ratios that we have not sourced from the peer companies' own filings. Peer cells above are marked Not Independently Verified pending desk verification against each company's latest audited results rather than being filled with third-party screener estimates. Peer set identified from Business Today's BANSWRAS peer listing.
What We Can Say With Confidence
Banswara's dividend yield of 0.82% sits well below the broader sector benchmark. TipRanks places the sector average dividend yield at 2.489% against Banswara's 0.84%, meaning Banswara yields roughly one-third of its sector.
On payout discipline, Banswara's 10.97% is at the conservative end of Indian listed textiles. Third-party analysis places its payout ratio in the 11% to 17% band depending on the calculation basis, and describes the payout as covered by both profit and free cash flow.
The Structural Disadvantage
Banswara competes against companies with far larger balance sheets and better access to low-cost capital. Its ROE of 5.45% and ROCE of 8.43% are the numbers that constrain everything else. When a business earns 8.43% on capital employed while paying roughly 9% on its debt, there is no surplus economic profit from which to fund a materially larger dividend.
Independent commentary notes the company has delivered poor sales growth of 11.5% over the past five years and a low return on equity of 5.76% over the last three years. Until returns on capital rise above the cost of capital, the dividend will remain a token payout rather than a genuine income stream.
Promoter Impact Analysis
Who Actually Receives This ₹3.42 Crore?
| Shareholder Category | Holding | Shares | Gross Dividend |
|---|---|---|---|
| Promoter & Promoter Group | 54.20% | 1,85,56,744 | ₹1.86 Crore |
| Foreign Institutional Investors | 7.90% | 27,04,328 | ₹0.27 Crore |
| Domestic Institutional Investors | 0.00% | Nil | Nil |
| Public & Retail | 37.90% | 1,29,70,928 | ₹1.30 Crore |
| Total | 100% | 3,42,32,000 | ₹3.42 Crore |
Shareholding pattern as reported by Share.Market for 14 July 2026. Share counts and dividend amounts computed by ShareBazaar Online. Equitymaster reports promoter holding at 54.19% as of March 2026 with no shares pledged.
Promoter Benefit In Context
The promoter family will receive approximately ₹1.86 crore of the ₹3.42 crore dividend — 54.20% of the total. Minority and public shareholders receive the remaining ₹1.56 crore.
Two observations that are genuinely favourable here. First, no promoter shares are pledged, which removes a common concern in family-controlled mid-caps where dividends are sometimes used to service promoter-level borrowings. Second, promoter holding has been stable at 54.19–54.20% across recent quarters — no promoter selling and no dilution.
The counterpoint worth stating plainly: because the payout is so small, the promoter family's dividend income of ₹1.86 crore is materially less than what the family draws through executive remuneration across three whole-time director positions. Independent commentary has previously raised questions about the scale of CEO pay increases at this company. Shareholders assessing whether the promoter interest is aligned with the minority interest should look at the remuneration disclosures in the annual report, not just at the dividend.
Distribution Impact On Retail Investors
For a retail shareholder holding 100 shares, the gross dividend is ₹100. After tax at a 30% slab plus 4% cess, the net receipt is roughly ₹68.80.
This is worth stating without euphemism. At this payout level, the dividend is not a meaningful component of shareholder return for a retail investor. Over the past year the share price moved by tens of rupees; the dividend is ₹1. Anyone holding BANSWRAS is holding it for the operating turnaround and the sub-1x book valuation, not for the income.
The absence of any DII holding (0.00%) is also notable. Domestic mutual funds and insurers have not taken a position. FIIs hold 7.90%. This is a stock with a thin institutional following and correspondingly thin trading volumes — Business Standard recorded traded value of just ₹0.02 crore on one session in January 2026. Liquidity risk is real here.
Taxation Analysis
How Dividends Are Taxed In India
Since the abolition of Dividend Distribution Tax in the Finance Act 2020, dividends are taxed entirely in the hands of the shareholder. The company no longer pays tax on your behalf.
1. Taxable at your slab rate. Dividend income is added to your total income under "Income from Other Sources" and taxed at whatever slab you fall into — 5%, 20%, 30% and so on, plus applicable surcharge and 4% health and education cess.
2. TDS is deducted at source. For resident individual shareholders, the company deducts TDS at 10% where the aggregate dividend from that company in a financial year exceeds the prescribed threshold. Banswara has confirmed that TDS will apply and that the rate depends on shareholder category and PAN validity as on the record date.
3. No PAN means a much higher deduction. If your PAN is invalid or not linked, TDS is deducted at 20% instead of 10%.
4. TDS is not your final tax. The 10% deducted is only an advance. If you are in the 30% slab, you still owe the balance when you file your return. If you are below the taxable limit, you can claim a refund, or submit Form 15G (under 60) or Form 15H (senior citizens) in advance to avoid deduction.
5. Interest deduction. You may claim interest paid on money borrowed to invest in shares, capped at 20% of the dividend income.
6. Non-residents. TDS is generally 20% plus surcharge and cess, subject to relief under an applicable Double Taxation Avoidance Agreement where valid documentation is furnished.
Worked Example A — Standard Illustration
Investor holds 1,000 shares, dividend of ₹10 per share, tax slab 30%.
Gross Dividend: 1,000 × ₹10 = ₹10,000
TDS Deducted (10%): ₹1,000
Amount Credited To Bank: ₹9,000
Total Tax Liability (30% + 4% cess = 31.2%): ₹3,120
Balance Payable At Filing: ₹3,120 − ₹1,000 = ₹2,120
Net Dividend In Hand: ₹6,880
Effective Post-Tax Retention: 68.8%
The key lesson: the ₹9,000 that lands in your bank account is not what you keep. You keep ₹6,880.
Worked Example B — Actual Banswara Numbers
Investor holds 1,000 BANSWRAS shares bought at ₹122.67 (investment ₹1,22,670), dividend ₹1 per share, tax slab 30%.
Gross Dividend: 1,000 × ₹1 = ₹1,000
TDS Deducted: Nil (below the TDS threshold for resident individuals)
Amount Credited To Bank: ₹1,000
Tax Liability (31.2%): ₹312
Net Dividend In Hand: ₹688
Pre-Tax Yield: 0.82%
Post-Tax Effective Yield: 0.56%
A 0.56% post-tax yield is the honest number a 30%-slab investor should use when evaluating this dividend. For a 5%-slab investor the post-tax yield is roughly 0.78%, and for someone below the taxable limit who has filed Form 15G, it stays at 0.82%.
This is a general illustration and not tax advice. TDS thresholds and rates are subject to change under prevailing tax law. Please consult a qualified tax professional for your specific situation.
Key Risks
1. Receivables Deterioration
Trade receivables grew 20.86% against revenue growth of 4.93%, pushing debtor days from 56.9 to 65.5. The cash flow statement shows a ₹44.91 crore working capital outflow from this alone. If this trend continues, operating cash flow will compress even if profits hold, and provisions for doubtful debts — already up from ₹0.18 crore to ₹0.41 crore — could rise materially.
2. Thin Interest Coverage
EBIT of ₹75.37 crore covers finance costs of ₹42.55 crore just 1.77 times. Finance costs rose 7.48% in FY26 while short-term borrowings rose 12.15% to ₹279.95 crore, now 59.1% of total debt. A rate increase, a refinancing squeeze, or a 30% profit decline would push coverage toward uncomfortable territory.
3. Further Labour Code Charges
The ₹8.91 crore exceptional charge is explicitly not final. The company states it continues to monitor State Rules and government clarifications, and that any additional impact will be accounted for in future periods. Non-current provisions already jumped 246% to ₹22.89 crore. Recurring compliance costs also raise the permanent employee cost base, which grew 8.72% in FY26.
4. Export Concentration And Currency Exposure
Export turnover accounts for approximately 47% of total revenue. The cash flow statement records an unrealised exchange loss of ₹3.59 crore in FY26 against ₹1.92 crore in FY25 — a near-doubling. Global apparel demand softness, tariff changes in destination markets, or adverse rupee movement would hit nearly half the revenue base directly.
5. Loss-Making Subsidiary And Concentrated Segment Risk
Banswara Brands Private Limited generated revenue of just ₹1.40 crore and a share of net loss of ₹2.46 crore. The parent injected a further ₹2.00 crore during the year and booked a ₹1.29 crore impairment provision. Separately, the company reports operations as a single reportable segment — Textiles, meaning there is no business-line diversification to cushion a textile downturn.
6. Governance And Continuity
The Company Secretary and Compliance Officer resigned effective 19 May 2026 — the same day as the results — and the company simultaneously changed its Registrar and Share Transfer Agent from Computech Sharecap to Bigshare Services. Executing an RTA transition while the compliance officer position is vacant, in the same window as a dividend record date, creates operational execution risk for shareholder servicing. All three whole-time executive positions are held by family members whose re-appointment runs to December 2029.
7. Minimal Liquidity Buffer
Consolidated cash and cash equivalents stood at ₹1.60 crore at year end, down 60.55% from ₹4.05 crore. Total liquid resources including bank balances and current investments are roughly ₹9.49 crore against current liabilities of ₹448.30 crore. The business runs on working capital lines, not on a cash cushion, which leaves little room to absorb a payment shock.
8. Low Trading Liquidity And No Institutional Support
Domestic institutional holding is 0.00%. Traded value on individual sessions has been recorded as low as ₹0.02 crore. For a stock with a market capitalisation around ₹412–435 crore, this means wide bid-ask spreads and the possibility that a modest sell order moves the price significantly.
What To Monitor
1. Debtor Days In Q1 And Q2 FY27
The benchmark to beat is 65.5 days. If the September 2026 half-yearly balance sheet shows receivables continuing to grow faster than revenue, the FY26 increase was structural rather than a year-end timing effect. If debtor days revert toward 57 days, the concern resolves.
2. Capital Work-in-Progress Conversion
CWIP rose 54.44% to ₹30.16 crore, on top of ₹97.12 crore of capex during the year. Track how quickly this converts into operating property, plant and equipment and — crucially — whether revenue per rupee of gross block improves. If capex rises without an asset turnover improvement, ROCE stays stuck near 8.43%.
3. Employee Cost As A Percentage Of Revenue
This rose from 22.82% to 23.64% in FY26. With the Labour Codes now in force from 21 November 2025, FY27 will be the first full year of the new cost base. Watch whether this ratio stabilises near 23.6% or breaches 24%. Every 100 basis points here is roughly ₹13.6 crore of pre-tax profit.
4. Short-Term Versus Long-Term Debt Mix
Current borrowings now stand at ₹279.95 crore, or 59.1% of total debt, up from 55.2%. Monitor whether the company terms out this debt or leans further on working capital lines. A rising short-term share alongside rising receivables is a combination that tends to precede a liquidity squeeze in textile businesses.
5. Further Labour Code Provisions
The company has committed in writing to accounting for any additional impact once State Rules are finalised. Watch the non-current provisions line, currently ₹22.89 crore, and the exceptional items line in each FY27 quarterly result. Another charge of similar scale would erase roughly 28% of FY26's consolidated PAT.
6. Banswara Brands Private Limited Turnaround
The wholly owned subsidiary produced ₹1.40 crore of revenue and a ₹2.46 crore share of loss. The parent has already invested ₹3.50 crore into it during FY26 and taken a ₹1.29 crore impairment. Watch whether FY27 brings a revenue inflection, a further capital injection, or a decision to write it down. Continued funding of a loss-making brand venture is a direct competitor for the same cash that could fund dividends or debt reduction.
7. Joint Venture Contribution From Tesca
Tesca Textile & Seat Components contributed a share of profit of ₹3.99 crore in FY26, up from ₹1.79 crore — a 122.5% increase, and roughly 12.8% of consolidated PAT. This is now a material earnings contributor from an entity the company does not fully control and whose accounts are audited by other auditors. Track whether this momentum sustains.
8. Export Realisation And Fabric Division Momentum
Exports contribute approximately 47% of revenue, and the Fabric division was reported as the highest segmental revenue contributor in FY26. Unrealised exchange losses nearly doubled to ₹3.59 crore. Monitor quarterly export share, order book commentary, and hedging disclosures in the FY27 annual report.
Conclusion
The Balanced View
Banswara Syntex's ₹1 final dividend for FY2025-26 is a safe dividend from a leveraged company having a good year. Both halves of that sentence are true and neither should be dropped.
Positives
- Consolidated PAT rose 40.81% to ₹31.20 crore; EPS ₹9.11
- Real operating leverage: EBITDA up 27.13% on revenue up 4.93%, margin from 7.82% to 9.48%
- Operating cash flow up 52.8% to ₹117.99 crore
- Free cash flow turned positive at ₹20.87 crore from negative ₹67.15 crore
- Material cost as a share of revenue improved by roughly 347 basis points
- Dividend covered 9.11x by earnings and 6.10x by free cash flow
- Unbroken dividend record across ten consecutive years, including the Covid year
- Clean, unmodified audit opinion on both standalone and consolidated results
- Promoter holding stable at 54.20% with zero pledge
- Trading at roughly 0.72x book value
Negatives
- Receivables grew 20.86% versus revenue growth of 4.93%; debtor days up to 65.5
- Total borrowings rose ₹21.53 crore to ₹473.66 crore in a year when a dividend was paid
- Interest coverage of just 1.77x
- Cash and cash equivalents of ₹1.60 crore — less than half the dividend outflow
- ROE of 5.45% and ROCE of 8.43%, below the implied cost of debt
- Dividend frozen at ₹1 for three consecutive years despite a 40.8% profit rise
- Yield of 0.82% versus a sector average nearer 2.49%
- ₹8.91 crore Labour Code charge, with the company confirming more may follow
- Subsidiary Banswara Brands lost ₹2.46 crore on ₹1.40 crore of revenue
- Zero DII holding and very low traded volumes
The Honest Framing
If you are reading this because you screen for dividend income, the arithmetic is unambiguous: a 0.82% pre-tax yield falling to 0.56% after tax at the 30% slab does not qualify as an income investment. There are far higher-yielding options in Indian listed equity.
If you are looking at Banswara for other reasons — the sub-1x price-to-book, the FY26 margin recovery, the positive free cash flow inflection after a heavy capex cycle — then the dividend is best understood as a secondary signal of management discipline rather than a return in itself. Management chose to retain roughly ₹28 crore of ₹31 crore earned. Whether that retained capital earns an adequate return will determine everything, and today's ROCE of 8.43% says it has not yet.
The dividend will almost certainly be paid. Whether it ever becomes meaningful depends on the company fixing its return on capital, and that is a multi-year question, not a dividend-season one.
Frequently Asked Questions
What dividend has Banswara Syntex announced for FY 2025-26?
What is the Banswara Syntex dividend yield?
What is the record date for the Banswara Syntex dividend?
What is the ex-dividend date and by when must I buy the shares?
When will the Banswara Syntex dividend be paid?
Who is eligible to receive this dividend?
How is the Banswara Syntex dividend taxed in my hands?
Is the Banswara Syntex dividend sustainable?
What is the Banswara Syntex dividend history?
What should investors monitor after this dividend announcement?
Why did Banswara keep the dividend at ₹1 when profit rose 40.8%?
What was the ₹8.91 crore exceptional item in the FY26 results?
How much of this dividend goes to the promoter family?
Why is the consolidated profit higher than the standalone profit?
Should I buy Banswara Syntex shares just to capture this dividend?
Disclaimer
This article is published by ShareBazaar Online for informational and educational purposes only. It does not constitute investment advice, a recommendation, or an offer or solicitation to buy or sell any security. ShareBazaar Online is not a SEBI-registered investment adviser or research analyst.
All company financial data is sourced from Banswara Syntex Limited's audited standalone and consolidated financial results for the quarter and year ended 31 March 2026, filed with BSE Limited and the National Stock Exchange of India Limited on 19 May 2026, together with the accompanying board outcome letter reference BSL/SEC/2026-27/07. Market prices, shareholding data, dividend history and record date information are sourced from publicly available third-party financial data providers and are cited where used. All ratios and derived figures are computed by ShareBazaar Online and are clearly identified as such.
The recommended dividend of ₹1 per share is subject to shareholder approval at the 50th Annual General Meeting scheduled for 30 July 2026 and is not guaranteed until approved. Record dates, payment dates and tax treatment are subject to change. Tax information provided is general in nature, reflects our understanding of prevailing law, and should not be relied upon for personal tax planning.
Share prices are volatile and past performance is not indicative of future results. Investments in securities are subject to market risk. Readers should conduct their own research and consult a qualified SEBI-registered financial adviser and tax professional before making any investment decision. ShareBazaar Online, its authors and its affiliates accept no liability for any loss arising from reliance on this content.