
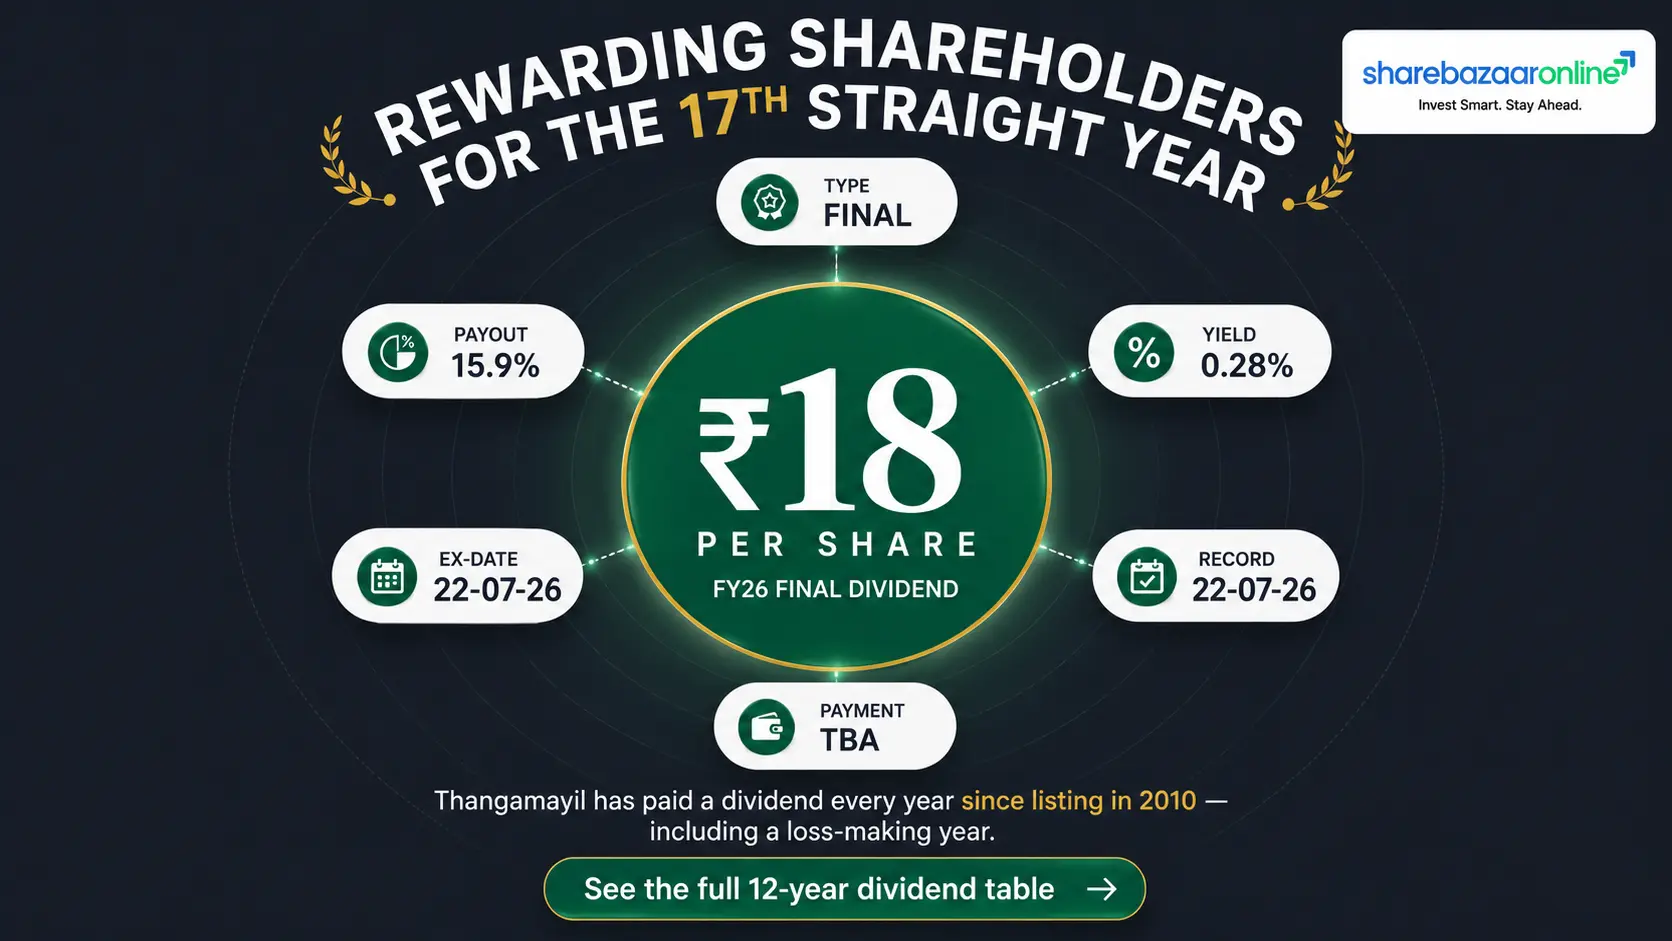
Dividend Snapshot
Thangamayil Jewellery Limited has recommended a Final Dividend of ₹18 per equity share (180% on face value of ₹10) for the financial year ended 31 March 2026. The record date was 22 July 2026, and the payment date will be fixed only after shareholders approve the payout at the Annual General Meeting scheduled for 29 July 2026 in Madurai.
Company & Security Details
| Company Name | Thangamayil Jewellery Limited |
| NSE Symbol | THANGAMAYL |
| BSE Scrip Code | 533158 |
| ISIN | INE085J01014 |
| Sector | Gems, Jewellery & Watches |
| Registered Office | 124, Nethaji Road, Madurai 625001 |
| CIN | L36911TN2000PLC044514 |
Dividend Details
| Dividend Type | Final Dividend |
| Dividend Per Share | ₹18.00 |
| Dividend Percentage | 180% |
| Face Value | ₹10.00 |
| Financial Year | FY 2025-26 |
| AGM Approval Required | Yes — 29 July 2026 |
| Payment Date | Not Disclosed by Company |
Computed Metrics
| Yield on Announcement Date CMP (₹3,594.20) | 0.50% |
| Yield on Latest CMP (₹6,447.50) | 0.28% |
| Total Dividend Outflow | ≈ ₹56 Crore |
| Dividend Payout Ratio (FY26 PAT) | 15.9% |
| Dividend Coverage (EPS ÷ DPS) | 6.29x |
| Free Cash Flow Coverage | 4.45x |
| Promoter Dividend Income | ≈ ₹34.5 Crore |
The One Number That Matters Most
On the day the board recommended this dividend (15 May 2026), the stock closed at ₹3,594.20. By 21 July 2026 — one day before the record date — it had climbed to ₹6,447.50, a rise of 79.4% in roughly nine weeks.
The dividend amount never changed. The share price did. As a result the effective yield for anyone buying near the record date collapsed from 0.50% to 0.28%. This is a growth-stock dividend, not an income-stock dividend, and the arithmetic makes that unavoidable.
Dividend Announcement Summary
What the Company Actually Filed
On 15 May 2026, Thangamayil Jewellery filed an intimation with BSE and NSE under Regulation 29(1)(E) of SEBI (LODR) Regulations, 2015, signed by Company Secretary CS K. Narayanan. The filing did three things at once: it fixed the AGM date, it fixed the book closure window, and it disclosed the board's dividend recommendation.
The precise wording matters here. The board has recommended a final dividend — it has not declared one. Under the Companies Act, 2013, a final dividend only becomes a legal obligation once shareholders approve it at the AGM. Until 29 July 2026, this remains a proposal.
Disclosed in the Filing
- Annual General Meeting on 29 July 2026 at Madurai
- Book closure from 23 July 2026 to 29 July 2026, both days inclusive
- Cut-off and record date for AGM and dividend: 22 July 2026
- Final dividend of ₹18 per share of ₹10 each (180%)
- Subject to shareholder approval at the ensuing AGM
- Payment date to be announced after the AGM
Not Disclosed in the Filing
- Payment date — Not Disclosed by Company
- Total dividend outflow in rupees — Not Disclosed by Company
- Shares outstanding as on record date — Not Disclosed by Company
- Management commentary on the payout decision — Not Disclosed by Company
- Dividend distribution policy reference — Not Disclosed by Company
Outflow and share-count figures used elsewhere in this analysis are computed by ShareBazaar Online from reported EPS, PAT and equity capital.
The Legal Deadline Nobody Mentions
Although the company has not given a payment date, Section 127 of the Companies Act, 2013 requires that a declared dividend be paid or the warrant despatched within 30 days of declaration. With the AGM on 29 July 2026, the outer limit for payment is therefore on or before 28 August 2026, assuming shareholders approve. Thangamayil's own recent pattern supports this — the FY25 final dividend of ₹12.50 had an ex-date of 21 July 2025 and was paid on 20 August 2025.
Key Dates Timeline
| Event | Date | Status |
|---|---|---|
| Board Meeting Intimation Filed | 07-05-2026 | Completed |
| Board Meeting & Dividend Announcement | 15-05-2026 | Completed |
| Newspaper Publication of Results | 16-05-2026 | Completed |
| Ex-Dividend Date | 22-07-2026 | Passed |
| Record Date | 22-07-2026 | Passed |
| Book Closure Begins | 23-07-2026 | In progress |
| Annual General Meeting, Madurai | 29-07-2026 | Upcoming |
| Book Closure Ends | 29-07-2026 | Upcoming |
| Payment Date | Not Disclosed by Company | Post-AGM |
| Statutory Outer Limit for Payment | 28-08-2026 | Computed |
Why Ex-Date and Record Date Are the Same
Indian equity markets settle on a T+1 basis, meaning a trade completes one working day after execution. Because of this, the ex-date and record date now fall on the same calendar day. To have been eligible, an investor needed to buy on or before 21 July 2026 and hold through the close of that session.
What Book Closure Actually Means
Book closure is the period during which the company freezes its register of members so it can finalise who gets the dividend and who can vote at the AGM. It does not stop you from trading the share on the exchange. Shares held in demat form continue to trade normally through 23–29 July 2026.
Dividend Yield Analysis
Yield at Three Different Prices
| Reference Point | Share Price | Yield on ₹18 |
|---|---|---|
| Announcement date close, 15 May 2026 | ₹3,594.20 | 0.50% |
| All-time high, 09 July 2026 | ₹7,114.95 | 0.25% |
| Latest available, 21 July 2026 | ₹6,447.50 | 0.28% |
| 52-week low, Aug 2025 zone | ₹1,750.10 | 1.03% |
Announcement-date close sourced from public share-price history archives; 52-week high/low and latest price from NSE/BSE market data aggregators. All yields computed by ShareBazaar Online.
Yield Reality Check — Why It Is So Low
A low yield can mean a stingy dividend or an expensive stock. Here it is clearly the second.
The dividend per share rose 44%, from ₹12.50 in FY25 to ₹18.00 in FY26. That is a genuine, meaningful increase in cash returned to shareholders.
But the share price rose far faster. Over the twelve months to 20 July 2026 the stock gained roughly 234%. When the numerator grows 44% and the denominator grows 234%, the yield has to fall. It is the re-rating, not the payout, that produced the 0.28% figure.
The Practical Implication for Buyers
At ₹6,447.50 per share, a single share costs roughly 358 times the annual dividend it pays. An investor deploying ₹10 lakh into the stock would have received approximately ₹2,791 in gross dividend for the year.
For comparison, a standard bank fixed deposit in the current environment yields several multiples of this in cash terms. Anyone buying Thangamayil for dividend income specifically is buying the wrong instrument. The dividend here is a by-product of earnings growth, not the reason to own the share.
Historical Yield Context
Thangamayil's dividend yield has been trending steadily downward for several years, not because payouts shrank but because the share price compounded far faster than the payout. Market data aggregators recorded the trailing yield at roughly 0.39% at the start of January 2026, 0.33% by mid-January 2026, and 0.19%–0.30% through July 2026. The direction of travel has been one-way. Investors who bought this stock five years ago are now sitting on a very healthy yield-on-cost; investors buying today are not.
Dividend History Analysis
Declared Dividend History — Last Twelve Years
| Ex-Date | Type | DPS (₹) | % on FV ₹10 |
|---|---|---|---|
| 22 Jul 2026 | Final | 18.00 | 180% |
| 21 Jul 2025 | Final | 12.50 | 125% |
| 18 Jul 2024 | Final | 6.00 | 60% |
| 12 Feb 2024 | Interim | 4.00 | 40% |
| 27 Jun 2023 | Final | 6.00 | 60% |
| 01 Feb 2023 | Interim | 6.00 | 60% |
| 27 Jul 2022 | Final | 5.00 | 50% |
| 03 Feb 2022 | Interim | 5.00 | 50% |
| 17 Aug 2021 | Final | 4.00 | 40% |
| 09 Mar 2021 | Interim | 6.00 | 60% |
| 23 Mar 2020 | Interim | 5.00 | 50% |
| 24 Jul 2019 | Final | 5.00 | 50% |
| 24 Jul 2018 | Final | 3.50 | 35% |
| 18 Jul 2017 | Final | 2.00 | 20% |
| 19 Jul 2016 | Final | 1.00 | 10% |
| 20 Jul 2015 | Final | 1.00 | 10% |
Dividend history compiled from exchange corporate action records via public market data aggregators. Figures are as-declared and are not adjusted for the 1:1 bonus issue in FY2023-24 or the rights issue completed in March 2025.
Consistency Record
- The company has paid a dividend every single financial year since listing in February 2010 — a 17-year unbroken streak.
- It paid ₹1 per share even in FY2014-15, a year in which it reported a net loss of ₹22 crore. That is a strong signal of management's commitment to the payout.
- There have been no dividend cuts and no suspensions in the last decade.
- No special dividends have been declared — every payout has been a routine interim or final.
Growth Trend and Structural Shift
Total dividend per share has grown from ₹1.00 in FY2015 to ₹18.00 in FY2026 — an eighteen-fold rise over eleven years, working out to a compound annual growth rate of roughly 30%.
A structural change is visible from FY2025 onward. Until FY2024 the company frequently paid two dividends a year (an interim plus a final). From FY2025 it has moved to a single annual final dividend. This shortens nothing for the shareholder in rupee terms, but it does mean cash arrives once a year rather than twice.
Classification: Consistent Payer
On the evidence, Thangamayil qualifies as a Consistent Payer rather than a cyclical or irregular one. The business itself is cyclical — jewellery retail swings with gold prices, wedding seasons and festival demand — but the dividend has not been. Management has treated the payout as a fixed obligation and has raised it in step with, and sometimes ahead of, earnings. The one qualification worth noting is that the payout ratio has been volatile, ranging from 13% to 36% over the last decade, which means the absolute rupee amount has been steadier than the proportion of profit distributed.
Financial Performance Analysis
FY2026 Full Year vs FY2025 (Standalone)
Thangamayil Jewellery reports standalone financials as its primary statements; the company does not have material subsidiaries that would create a meaningful consolidated-versus-standalone gap. All figures below are standalone and in ₹ Crore.
| Metric | FY2026 | FY2025 | Change |
|---|---|---|---|
| Revenue from Operations | 8,513.75 | 4,916.30 | +73.2% |
| Operating Profit (EBITDA) | 579 | 219 | +164.4% |
| Operating Margin | 6.8% | 4.5% | +230 bps |
| Interest Cost | 68 | 41 | +65.9% |
| Depreciation | 40 | 24 | +66.7% |
| Profit Before Tax | 469 | 160 | +193.1% |
| Net Profit | 351.65 | 118.71 | +196.2% |
| Earnings Per Share | ₹113.14 | ₹38.19 | +196.3% |
Q4 FY2026 — The Quarter That Changed the Story
| Metric | Q4 FY26 | Q4 FY25 |
|---|---|---|
| Revenue (₹ Cr) | 2,838.21 | 1,380.50 |
| EBITDA (₹ Cr) | 214 | 57 |
| EBITDA Margin | 7.52% | 4.14% |
| Net Profit (₹ Cr) | 142.66 | 31.40 |
| EPS (₹) | 45.90 | 10.10 |
Q4 alone contributed 40.6% of the full year's net profit. That is an extreme concentration and it deserves scrutiny rather than applause.
Operating Leverage — Genuinely Positive
The three growth rates line up in the right order, which is what healthy operating leverage looks like:
- Revenue: +73.2%
- EBITDA: +164.4%
- Net Profit: +196.2%
Each successive line grew faster than the one above it. Fixed costs — rent, salaries, showroom overheads — were spread across a much larger revenue base, and the operating margin expanded 230 basis points from 4.5% to 6.8%. This is real and it is not an accounting artefact.
The Finding That Deserves the Most Attention
Revenue grew 73.2%. Gold sales volume, according to company disclosures reported in market commentary, grew approximately 15.1% year on year, while gold prices rose roughly 59% during the same period.
Break that down and the picture changes. Roughly four-fifths of the revenue growth came from gold price inflation, not from selling meaningfully more jewellery. The company sold about 15% more metal and charged far more for it.
This is not a criticism of management — every jeweller in India benefited from the same tailwind, and holding inventory during a rising gold market produces genuine, bankable profit. But it does mean the FY26 profit figure carries an embedded commodity bet. Investors should be clear that they are looking at a business that grew volumes at a solid mid-teens rate, amplified by a gold price move that management did not create and cannot control.
Five-Year Growth Record
| Financial Year | Revenue (₹ Cr) | Net Profit (₹ Cr) | OPM % |
|---|---|---|---|
| FY2022 | 2,193 | 39 | 4% |
| FY2023 | 3,153 | 80 | 5% |
| FY2024 | 3,827 | 123 | 6% |
| FY2025 | 4,911 | 119 | 4% |
| FY2026 | 8,514 | 352 | 7% |
Note FY2025: revenue rose 28% but net profit actually fell 3.5%, from ₹123 crore to ₹119 crore. The margin compressed from 6% to 4%. That year is a useful reminder that this business can grow the top line and shrink the bottom line at the same time. Five-year compounded profit growth stands at roughly 32% and five-year sales growth at roughly 36%.
Cash Flow Analysis
Reported Profits Are an Opinion. Cash Is a Fact.
| ₹ Crore | FY2026 | FY2025 | FY2024 | FY2023 |
|---|---|---|---|---|
| Net Profit | 352 | 119 | 123 | 80 |
| Cash from Operations | 322 | -424 | 330 | 10 |
| Cash from Investing | -165 | -138 | -30 | -86 |
| Cash from Financing | -122 | 637 | -293 | 78 |
| Free Cash Flow | 249 | -482 | 293 | -21 |
| OCF as % of Net Profit | 91.6% | Negative | 268% | 13% |
Cash flow figures compiled from the company's filed financial statements as aggregated by public financial data platforms.
The Good News: FY26 Cash Conversion Is Solid
Operating cash flow of ₹322 crore against net profit of ₹352 crore gives a conversion ratio of 91.6%. For a working-capital-heavy jewellery retailer, that is a genuinely good number. The profit reported on the income statement showed up in the bank account.
Free cash flow of ₹249 crore comfortably exceeds the ₹56 crore dividend outflow. On FY26 numbers alone, the dividend is fully funded by current-year cash generation — not by borrowings, not by asset sales, and not by drawing down reserves.
The Warning: This Was Not True Last Year
In FY2025 the company reported a profit of ₹119 crore but burned ₹424 crore of operating cash. Free cash flow was negative ₹482 crore. It still paid a dividend of ₹12.50 per share, roughly ₹39 crore.
That FY25 dividend was funded not by operations but by the ₹637 crore raised through financing activities — principally the ₹510 crore rights issue completed in March 2025. Shareholders effectively received back a small slice of the money they had just subscribed. This is a pattern worth remembering: in a year when gold prices move against the company or inventory build accelerates, operating cash can vanish entirely while the dividend continues.
The Cash Flow Volatility Problem
Look at the four-year operating cash flow sequence: +₹10 Cr, +₹330 Cr, -₹424 Cr, +₹322 Cr. There is no trend line here, only a sawtooth.
The reason is inventory. Jewellery retail requires the company to hold large quantities of gold on shelves. When Thangamayil opens showrooms or stocks up ahead of a festive season, cash flows out even if profits are rising. Inventory stood at ₹2,953.63 crore at 31 March 2026, up from ₹1,979.57 crore a year earlier — an increase of ₹974 crore, or 49.2%.
There is a genuine positive buried in that number, though. Inventory grew 49.2% while revenue grew 73.2%. Inventory is turning faster than it used to: inventory days improved from 164 days in FY25 to 142 days in FY26, and the cash conversion cycle shortened from 162 days to 142 days. Receivables are effectively nil in this business — debtor days sit at 1 day — because jewellery is sold for cash or card, not on credit. So the classic receivables-inflation warning sign simply does not apply here.
How Is This Dividend Actually Funded?
| Possible Source | Assessment |
|---|---|
| Current Earnings | Yes — ₹56 Cr dividend against ₹352 Cr PAT and ₹322 Cr operating cash flow |
| Cash Reserves | Not required in FY26; net cash flow for the year was positive ₹36 Cr |
| Asset Sales | No — investing cash flow was an outflow of ₹165 Cr, consistent with expansion |
| Borrowings | Indirectly relevant — borrowings rose ₹95.6 Cr in FY26, more than the ₹56 Cr dividend |
The honest conclusion: on a direct basis the dividend is earnings-funded. On a whole-balance-sheet basis, the company took on ₹95.6 crore of additional debt in the same year it distributed ₹56 crore. Both statements are true, and readers should hold them together.
Balance Sheet Strength
Balance Sheet Position (₹ Crore)
| Item | FY2026 | FY2025 | Change |
|---|---|---|---|
| Equity Share Capital | 31 | 31 | Unchanged |
| Reserves & Surplus | 1,385 | 1,071 | +29.3% |
| Total Borrowings (incl. leases) | 913 | 797 | +14.6% |
| Reported Borrowings (company disclosure) | 774.16 | 678.60 | +14.1% |
| Inventories | 2,953.63 | 1,979.57 | +49.2% |
| Fixed Assets | 293 | 201 | +45.8% |
| Total Assets | 3,820 | 2,559 | +49.3% |
| Cash & Investments | Not Disclosed by Company in the dividend intimation; separately disclosed investments line reported at nil | ||
Return Ratios
| Return on Equity (FY26) | 28.1% |
| Return on Capital Employed (FY26) | 25.5% |
| ROE — 5-year average | 23% |
| ROE — 10-year average | 22% |
| ROCE — FY2025 (for contrast) | 14% |
| Book Value Per Share | ₹456 |
ROCE nearly doubled from 14% to 25.5% in a single year. That is impressive, but it is also a reminder of how much these ratios swing with the gold cycle.
Debt Reality Check
Borrowings have risen every year for five years: ₹417 Cr (FY22) → ₹571 Cr → ₹532 Cr → ₹797 Cr → ₹913 Cr (FY26).
Set against reserves of ₹1,385 crore and equity capital of ₹31 crore, total borrowings of ₹913 crore give a debt-to-equity ratio of roughly 0.65 times. That is manageable for a jewellery retailer, where debt is largely gold metal loans and working capital lines rather than long-term project finance.
Interest cost of ₹68 crore is covered 8.5 times by EBITDA of ₹579 crore. Comfortable today. But note that in FY2025, EBITDA of ₹219 crore against interest of ₹41 crore gave cover of only 5.3 times, and in FY2022 EBITDA of ₹86 crore against interest of ₹26 crore gave cover of 3.3 times. The cushion shrinks fast when margins compress.
Credit Rating and External Validation
ICRA has reaffirmed Thangamayil's credit ratings at ICRA A (Stable) for fixed deposits of ₹95 crore and working capital facilities of ₹1,412 crore, with banking relationships spanning Axis, HDFC, ICICI, Kotak, Yes Bank and Federal Bank. ICRA has projected FY27 income growth of 23–25% with operating margins of 6.0–6.5% — notably, a margin forecast slightly below the 6.8% achieved in FY26. India Ratings also issued a rating update in December 2025.
Dividend Sustainability Analysis
Coverage Metrics
| Test | Calculation | Result | Verdict |
|---|---|---|---|
| Earnings Coverage | ₹113.14 EPS ÷ ₹18.00 DPS | 6.29x | Strong |
| Payout Ratio | ₹56 Cr ÷ ₹352 Cr PAT | 15.9% | Conservative |
| Free Cash Flow Coverage | ₹249 Cr FCF ÷ ₹56 Cr | 4.45x | Strong |
| Operating Cash Coverage | ₹322 Cr OCF ÷ ₹56 Cr | 5.76x | Strong |
| Cash & Investment Coverage | Cash balance not separately disclosed | Not Disclosed by Company | Cannot assess |
| Debt Trajectory Test | Borrowings +₹95.6 Cr vs dividend ₹56 Cr | Debt rising | Caution |
What Supports Sustainability
- A payout ratio of 15.9% is the lowest in five years — the company retained 84% of FY26 profit, leaving a large buffer.
- Free cash flow covers the dividend 4.45 times over.
- ROE of 28.1% means retained profits are being redeployed productively.
- A 17-year unbroken payment record, including a loss-making year.
- Interest cover of 8.5x leaves room before lenders would object to distributions.
What Threatens Sustainability
- FY26 earnings were substantially gold-price-driven; volume growth was only about 15%.
- Operating cash flow was negative ₹424 crore just one year ago. This is not a stable cash generator.
- Import duty on gold and silver rose from 6% to 15% effective May 2026, a 150% increase that may dampen consumer demand.
- Borrowings have risen for five consecutive years.
- Aggressive showroom expansion consumes cash; capex-driven investing outflows were ₹165 crore in FY26.
- ICRA's own FY27 margin projection of 6.0–6.5% sits below the FY26 outcome.
Classification: Sustainable
On the evidence, the ₹18 dividend is classified as Sustainable. The absolute rupee amount is small relative to earnings, cash flow and reserves. Even if FY27 profit halved to around ₹175 crore, a ₹56 crore dividend would still represent a payout ratio of only 32% — within the range this company has paid before.
The important nuance is that sustainability of the amount does not imply sustainability of the growth rate. Dividend per share has grown at roughly 30% compounded over eleven years. That trajectory depended on an earnings base that nearly tripled in FY26 on a commodity tailwind. Investors extrapolating ₹18 to ₹26 next year are making an assumption the data does not support.
Peer Comparison
Listed Jewellery Retailers — Dividend and Returns
| Company | Dividend Yield | Payout Ratio | ROE | ROCE |
|---|---|---|---|---|
| Thangamayil Jewellery | 0.28% | 15.9% | 28.1% | 25.5% |
| Titan Company | 0.24%–0.33% | ≈30% | 37.1% | 25.8% |
| Kalyan Jewellers | 0.42% | Not Disclosed by Company | 21.9% | Not Disclosed by Company |
| Senco Gold | ≈0.51% (FY26E) | Not Disclosed by Company | Not Disclosed by Company | Not Disclosed by Company |
| P N Gadgil Jewellers | Nil — pays no dividend | 0% | Not Disclosed by Company | Not Disclosed by Company |
Peer figures sourced from public financial data platforms and stock analysis portals as of July 2026. Yields move daily with share prices. Items marked "Not Disclosed by Company" were not available from verifiable public sources at the time of writing and have not been estimated.
What the Comparison Shows
Thangamayil's yield of 0.28% sits at the low end of its peer group but is not an outlier. The entire Indian organised jewellery sector yields under 0.6%. One data provider places the industry average dividend yield for Indian specialty retail at approximately 0.2%, and the Indian market's top quartile of dividend payers at roughly 1.3%.
The reason is structural. Jewellery retail is enormously working-capital hungry. Every rupee retained goes into gold inventory that funds the next showroom. Companies in this sector conserve cash by design.
Where Thangamayil Stands Out
On ROE of 28.1%, Thangamayil beats Kalyan Jewellers (21.9%) though it trails Titan (37.1%). On ROCE of 25.5% it is effectively level with Titan (25.8%) — a striking result for a company roughly one-twentieth of Titan's market capitalisation.
Its payout ratio of 15.9% is the most conservative among peers that pay at all, roughly half of Titan's ≈30%. Thangamayil is choosing to reinvest, and given a 28% ROE that is defensible arithmetic. On one-year share price return, market data placed Thangamayil at approximately +179% versus Kalyan Jewellers at approximately -38% — the widest spread in the peer set.
Promoter Impact Analysis
Shareholding Pattern as at March 2026 and Dividend Split
| Category | Holding % | Dividend Share (₹ Cr) |
|---|---|---|
| Promoters | 61.61% | ≈ 34.5 |
| Domestic Institutions (DII) | 17.41% | ≈ 9.7 |
| Public / Retail | 16.61% | ≈ 9.3 |
| Foreign Institutions (FII) | 4.37% | ≈ 2.4 |
| Total | 100.00% | ≈ 55.9 |
Shareholding percentages from the company's filed shareholding pattern as aggregated by public financial data platforms. Rupee allocations computed by ShareBazaar Online.
Promoter Benefit
The promoter group will receive approximately ₹34.5 crore of the ₹56 crore dividend, or 61.61% of the pool. For FY25 the equivalent figure was roughly ₹24 crore, so promoter dividend income rises about 44%, in line with the DPS increase.
This is proportionate, not preferential. There is no differential dividend class here — every equity share receives ₹18 regardless of who holds it.
Minority Shareholder Benefit
Non-promoter shareholders collectively receive approximately ₹21.4 crore, split between institutions (₹12.1 crore) and retail public (₹9.3 crore).
The more meaningful development for minority holders is not the dividend but the ownership mix. DII holding has climbed from 11.46% in June 2023 to 17.41% by March 2026, while public holding has fallen from 21.17% to 16.61% over the same window. Mutual fund shareholding alone was reported around 15.5% in July 2026. Institutional accumulation on this scale tends to bring closer scrutiny of governance and capital allocation, which usually works in minority shareholders' favour.
Distribution Impact and Promoter Stake Movement
Promoter holding has moved from 67.33% in March 2024 to 61.61% in March 2026 — a decline of roughly 5.7 percentage points over three years. The bulk of this dilution came from the rights issue and other capital raises rather than open-market promoter selling; promoter holding has in fact edged marginally upward from 61.28% in September 2024 to 61.61% in March 2026, which suggests promoters have been subscribing rather than exiting.
The ₹56 crore leaving the company represents 3.9% of the ₹1,416 crore of shareholders' funds. In balance-sheet terms it is a small distribution. The number of shareholders on record has grown from 20,917 in June 2023 to 48,097 in March 2026, so this dividend is being spread across a far broader base than in previous years.
Taxation Analysis
How Dividends Are Taxed in India
Before April 2020, companies paid Dividend Distribution Tax and the dividend arrived tax-free in the shareholder's hands. That system is gone. Since 1 April 2020, dividends are taxable directly in the hands of the shareholder.
- Dividend income is added to your total income and taxed at your applicable slab rate. There is no special or concessional rate.
- It is reported under the head "Income from Other Sources" in your income tax return.
- Companies must deduct TDS at 10% under Section 194 before paying, once dividends from that company exceed the annual threshold.
- The TDS threshold was raised to ₹10,000 per company per financial year with effect from FY2025-26. Below that, no TDS is deducted — but the income is still taxable.
- If PAN is not linked or not furnished, TDS is deducted at 20%.
- Non-resident shareholders face TDS at 20% plus applicable surcharge and cess, subject to relief under any applicable tax treaty.
- TDS is only an advance collection, not the final tax. It is adjusted against your total liability when you file your return.
- Investors whose total income is below the taxable limit can file Form 15G (or Form 15H for senior citizens) with the registrar to avoid TDS.
- Interest paid on money borrowed to buy shares is deductible against dividend income, capped at 20% of the dividend. No other expenses are allowed.
Worked Example A — Standard Illustration
Investor holds 1,000 shares, dividend of ₹10 per share, tax slab 30%.
| Gross Dividend | ₹10,000 |
| TDS deducted (threshold not exceeded) | ₹0 |
| Amount credited to bank | ₹10,000 |
| Tax at 30% slab | ₹3,000 |
| Health & Education Cess at 4% | ₹120 |
| Total tax payable | ₹3,120 |
| Net Dividend in Hand | ₹6,880 |
The investor keeps 68.8% of the gross dividend. A stated yield of 1.00% becomes an effective post-tax yield of 0.688% for a 30%-slab investor.
Worked Example B — Actual Thangamayil Dividend
Investor holds 1,000 shares of THANGAMAYL, dividend of ₹18 per share, tax slab 30%, bought at ₹6,447.50.
| Investment value | ₹64,47,500 |
| Gross Dividend | ₹18,000 |
| TDS at 10% (threshold exceeded) | ₹1,800 |
| Amount credited to bank | ₹16,200 |
| Total tax at 30% plus 4% cess | ₹5,616 |
| Balance tax payable at filing | ₹3,816 |
| Net Dividend After Tax | ₹12,384 |
| Pre-tax yield | 0.279% |
| Post-tax effective yield | 0.192% |
A ₹64.5 lakh position generates ₹12,384 of post-tax annual income. The tax analysis makes the earlier point unavoidable: this share is not an income instrument.
A Note on Slab Differences
The post-tax outcome varies sharply by tax bracket. On the same ₹18,000 gross dividend, an investor in the 5% slab keeps roughly ₹17,064, one in the 20% slab keeps roughly ₹14,256, and one in the 30% slab keeps ₹12,384. An investor whose total income falls below the basic exemption limit keeps the entire ₹18,000 and can reclaim the TDS as a refund. Tax rules change with each Finance Act — readers should confirm the position applicable to their own circumstances with a qualified tax professional.
Key Risks
1. Gold Import Duty Shock
Import duty on gold and silver was raised from 6% to 15% effective May 2026 — a 150% increase. Higher duty raises retail prices, which can suppress volume demand and revive grey-market competition that undercuts organised jewellers. This directly threatens the volume growth that must replace the price tailwind.
2. Gold Price Reversal Risk
Roughly 75% of revenue comes from gold jewellery, and gold prices rose approximately 59% during FY26. A sharp correction would hit the business three ways simultaneously: inventory of ₹2,954 crore would be revalued downward, per-piece realisation would fall, and consumers who bought at peak prices may defer purchases. The FY26 margin expansion could reverse quickly.
3. Working Capital and Cash Flow Volatility
Operating cash flow was negative ₹424 crore in FY2025 and positive ₹322 crore in FY2026. A business that can swing ₹746 crore in operating cash within twelve months carries real funding risk. Inventory of ₹2,954 crore against total assets of ₹3,820 crore means 77% of the balance sheet is stock on shelves.
4. Geographic Concentration
The business is heavily concentrated in Tamil Nadu, with recent expansion into Chennai. A regional economic shock, an adverse monsoon affecting agricultural incomes, or state-specific policy changes would hit disproportionately hard. Titan and Kalyan operate nationally and are far more insulated from any single state.
5. Rising Debt Alongside Expansion
Borrowings have increased in each of the last five years, reaching ₹913 crore including leases. Interest cost rose 66% to ₹68 crore in FY26. Each new showroom requires gold inventory funded largely by metal loans. If margins compress while store count grows, interest cover of 8.5x can deteriorate rapidly — it was only 3.3x in FY2022.
6. Valuation Risk
The stock trades at a P/E of roughly 52–56 times and around 11.8–14 times book value. The share has risen approximately 234% in twelve months. Valuations at this level price in continued exceptional performance. Any quarter that disappoints against that expectation can trigger a sharp de-rating, and the dividend yield of 0.28% provides no meaningful downside cushion.
7. Volume Growth Dependency
Gold sales volume grew approximately 15% while revenue grew 73%. If gold prices merely stabilise rather than fall, revenue growth would drop toward the mid-teens. ICRA's FY27 projection of 23–25% income growth is a fraction of the FY26 outcome, and its margin forecast of 6.0–6.5% is below FY26's 6.8%.
8. Payment Date Uncertainty
The company has not committed to a payment date, stating only that it will follow AGM approval on 29 July 2026. While the statutory deadline of 28 August 2026 provides protection, shareholders relying on a specific cash-flow date should note that the timing remains Not Disclosed by Company.
What To Monitor
1. Gold Volume Growth in Grams, Not Rupees
The single most useful disclosure is tonnage sold. If quarterly volume growth holds in the mid-teens or better while gold prices flatten, the business is genuinely expanding. If volume growth falls into low single digits, revenue growth in FY27 will be almost entirely price-driven and unrepeatable.
2. Same-Store Sales Growth
The company added 8 showrooms recently, including new Chennai branches at Neelankarai and Pallavaram opened 7 June 2026. Headline revenue growth from new stores is easy. The number that reveals underlying health is like-for-like growth at stores open more than a year. Watch for this in quarterly investor presentations.
3. Operating Margin Versus ICRA's 6.0–6.5% Forecast
FY26 delivered 6.8%. The credit rating agency expects FY27 to come in slightly lower. Quarterly OPM printing consistently above 6.5% would suggest the margin gain is structural; readings below 6.0% would indicate the gold cycle was doing the heavy lifting.
4. Operating Cash Flow Each Half-Year
Given the FY25 swing to negative ₹424 crore, cash conversion deserves monitoring at every reporting opportunity. Sustained OCF above 70% of net profit would confirm the FY26 improvement is durable. A return to negative territory would put the FY27 dividend under pressure regardless of reported profit.
5. Inventory Days and Working Capital Cycle
Inventory days improved from 164 to 142 and the cash conversion cycle from 162 to 142 days. Continued improvement means expansion is being funded efficiently. Deterioration back toward 160+ days would signal that new stores are absorbing more capital than they generate.
6. Borrowings and Interest Cover
Track total borrowings each half-year against the ₹913 crore FY26 base, and interest cost against the ₹68 crore run rate. Watch for any change to ICRA's A (Stable) rating or to the ₹1,412 crore working capital facility, both of which would be early warning signals.
7. Import Duty and Regulatory Developments
The May 2026 duty increase to 15% is recent enough that its full demand impact has not yet appeared in reported numbers. Q1 and Q2 FY27 results will be the first clean read. Watch also for any further duty revisions, hallmarking rule changes, or gold monetisation policy announcements.
8. Institutional Holding Trajectory
DII holding has risen from 11.46% to 17.41% over three years while public holding fell to 16.61%. Continued institutional accumulation typically supports the share; sustained institutional selling in a stock that has risen 234% would be a meaningful signal. The quarterly shareholding pattern filing is the place to check.
Conclusion
Positives
- Dividend per share up 44%, from ₹12.50 to ₹18.00.
- 17 consecutive years of dividend payment, including through a loss-making year.
- Payout ratio of just 15.9% — a very large safety cushion.
- Free cash flow covers the dividend 4.45 times.
- Net profit up 196%; revenue up 73%; operating margin up 230 bps.
- ROE 28.1%, ROCE 25.5% — ROCE now level with Titan.
- Operating cash conversion of 91.6% of net profit.
- Working capital cycle improved from 162 to 142 days.
- Credit rating reaffirmed at ICRA A (Stable).
- Institutional holding rising steadily to 17.41%.
Negatives
- Yield of 0.28% is negligible; 0.19% post-tax at the 30% slab.
- Roughly four-fifths of revenue growth was gold price, not volume.
- Operating cash flow was negative ₹424 crore just one year ago.
- Borrowings up for five straight years, reaching ₹913 crore.
- Debt rose ₹95.6 crore in the same year ₹56 crore was distributed.
- Import duty jump from 6% to 15% threatens FY27 demand.
- Q4 alone contributed 40.6% of full-year profit — heavy concentration.
- Valuation at 52–56x earnings and 11.8–14x book.
- FY25 showed revenue up 28% with profit down 3.5% — it can happen again.
- Payment date remains Not Disclosed by Company.
The Balanced View
Thangamayil Jewellery's ₹18 final dividend is a well-covered, comfortably affordable payout from a company that has just delivered its strongest financial year on record. On every coverage test that matters — earnings, operating cash, free cash flow — the dividend passes easily. The 17-year payment record and the willingness to pay even in a loss year say something real about management's attitude to shareholders.
Two things temper that assessment. First, the yield is functionally irrelevant: at 0.28% pre-tax and 0.19% post-tax, no rational investor is holding this share for the cash it distributes. Second, and more importantly, the record earnings that make the dividend look so safe were substantially manufactured by a 59% move in gold prices against roughly 15% volume growth. That is not a criticism of execution — the company converted the opportunity efficiently — but it does mean the ₹352 crore profit base should not be treated as the new normal.
The questions that will actually determine FY27 are whether volume growth can carry the business when the gold tailwind fades, and whether the 15% import duty dents demand in a state where jewellery buying is deeply cultural but also price-sensitive. The positives, negatives, risks and monitoring factors are set out above. The judgment belongs to the reader.
Frequently Asked Questions
What dividend has Thangamayil Jewellery announced for FY2026?
What is the dividend yield on this ₹18 payout?
What is the record date for the Thangamayil dividend?
What is the ex-dividend date, and why is it the same as the record date?
When will the Thangamayil dividend actually be paid?
Who is eligible to receive this dividend?
How will this dividend be taxed in my hands?
Is this dividend sustainable?
What is Thangamayil Jewellery's dividend history?
What should investors monitor after this dividend?
How much will the promoters receive from this dividend?
Why is the dividend yield so low when the dividend increased 44%?
Is the dividend funded from profits or from borrowings?
How does Thangamayil's dividend compare with Titan and Kalyan Jewellers?
What happens if I did not buy before the ex-date?
Disclaimer
This article is published by ShareBazaar Online for informational and educational purposes only. It does not constitute investment advice, a recommendation, or a solicitation to buy, sell or hold any security. ShareBazaar Online is not a SEBI-registered investment adviser or research analyst.
Dividend details are sourced from the company's official filing with BSE Limited and the National Stock Exchange of India Limited dated 15 May 2026. Financial data, share prices, shareholding patterns, peer figures and dividend history are sourced from publicly available exchange filings and third-party financial data platforms, and were accurate to the best of our knowledge at the time of publication. Share prices and yields change continuously. All ratios described as computed have been calculated by ShareBazaar Online from underlying reported figures and may differ from figures published elsewhere due to methodology differences.
The dividend discussed remains a board recommendation subject to shareholder approval at the Annual General Meeting on 29 July 2026 and may be modified or not approved. The payment date has not been disclosed by the company.
Taxation information reflects our understanding of Indian income tax law as applicable to resident individual shareholders and is general in nature. Tax treatment depends on individual circumstances and may change. Readers should consult a qualified chartered accountant or tax adviser regarding their own position.
Investments in securities markets are subject to market risks. Past performance, including past dividend payments, is not indicative of future results. Readers should conduct their own research and consult a SEBI-registered financial adviser before making any investment decision. ShareBazaar Online and its authors accept no liability for any loss arising from reliance on this content.