
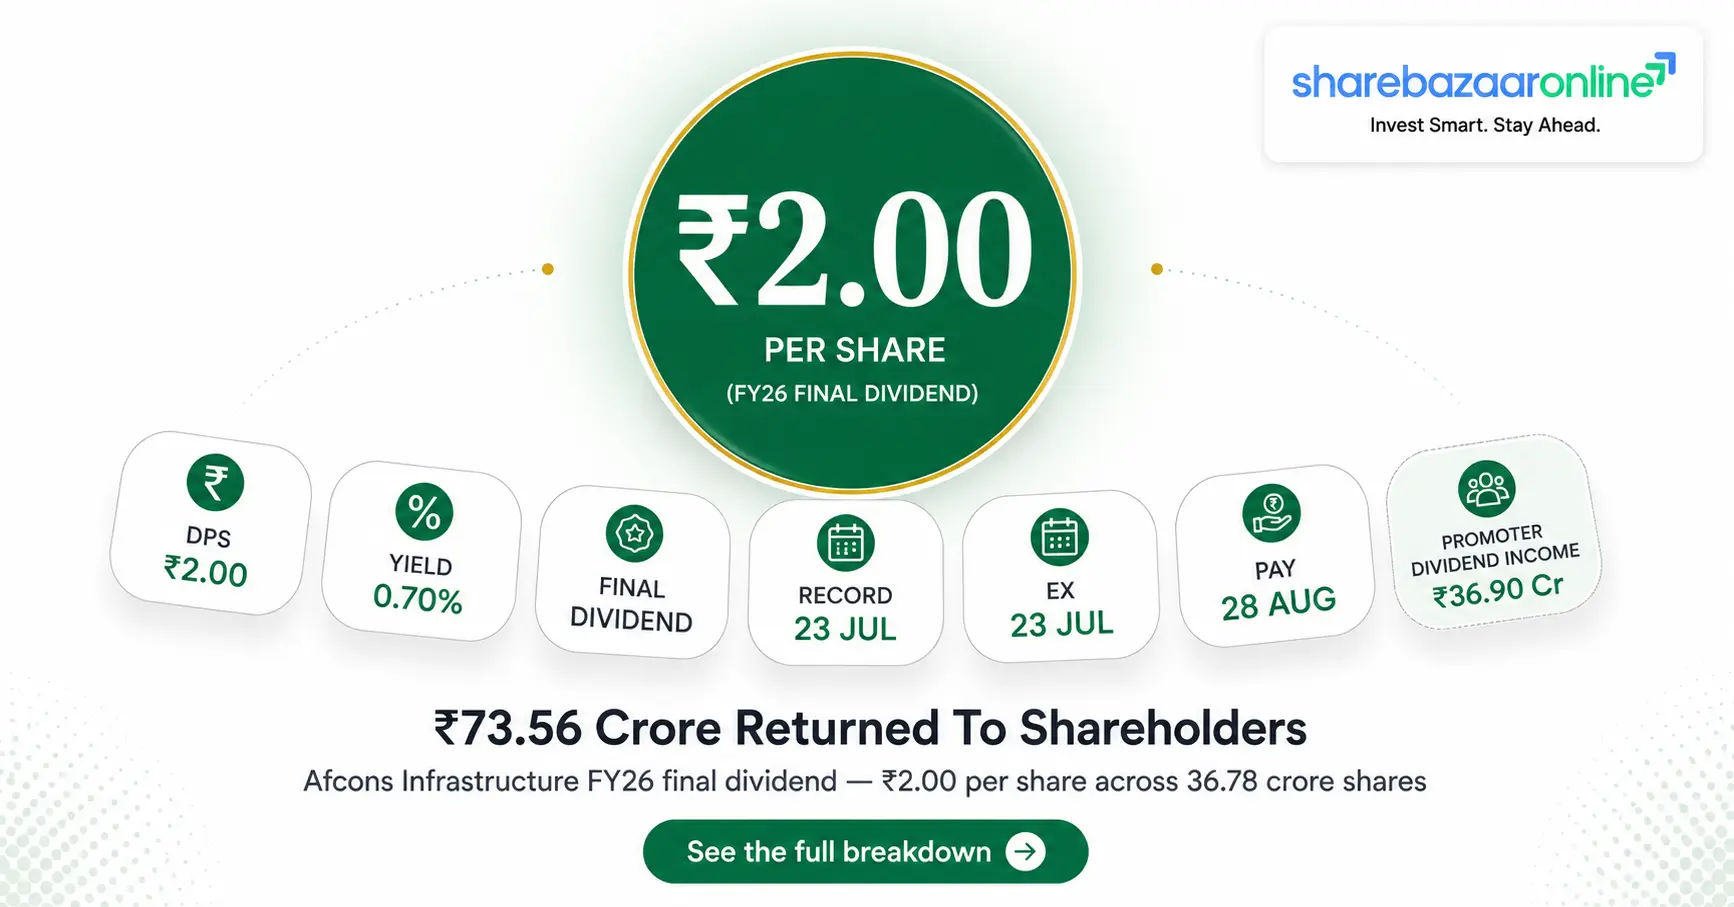
Dividend Snapshot
Afcons Infrastructure Limited, the flagship engineering and construction arm of the Shapoorji Pallonji Group, has recommended a final dividend of ₹2.00 per equity share (20% on face value of ₹10) for the financial year 2025-26. The recommendation was made by the Board at its meeting held on 18 May 2026 and is subject to shareholder approval at the 50th Annual General Meeting.
This is the company's second dividend since its stock market listing in November 2024 — and it is 20% lower than the ₹2.50 per share paid for FY 2024-25. The cut comes in a year where consolidated profit after tax fell by nearly half.
Dividend Details
| Company | Afcons Infrastructure Limited |
| NSE Symbol | AFCONS |
| BSE Scrip Code | 544280 |
| ISIN | INE101I01011 |
| Dividend Type | Final Dividend |
| Dividend Per Share | ₹2.00 |
| Dividend Percentage | 20% |
| Face Value | ₹10 |
| Financial Year | FY 2025-26 |
| AGM Approval Required | Yes — 50th AGM |
Key Computed Metrics
| Dividend Yield (Current) | 0.70% |
| Yield on Announcement Price | 0.63% |
| Total Dividend Outflow | ₹73.56 Crore |
| Shares Outstanding | 36,77,84,640 |
| Paid-up Share Capital | ₹367.78 Crore |
| Payout Ratio (Consolidated) | 29.34% |
| Dividend Coverage Ratio | 3.41x |
| Cash Coverage | 12.04x |
| Free Cash Flow Coverage | Negative (-6.68x) |
| Promoter Dividend Income | ₹36.90 Crore |
The One Number That Matters Most
Afcons reported a consolidated profit of ₹250.74 crore in FY26. In the same year, cash flow from operations was negative ₹127.49 crore. That means the business consumed cash even while reporting a profit — for the second consecutive year. The ₹73.56 crore dividend is therefore not being funded by cash the business generated. It is being funded by borrowings and existing cash reserves. This single fact should frame everything else in this analysis.
Dividend Announcement Summary
What the Board Approved
At the Board meeting held on Monday, 18 May 2026 (commenced 2:00 p.m., concluded 5:05 p.m.), the Directors of Afcons Infrastructure Limited approved the audited standalone and consolidated financial results for the quarter and financial year ended 31 March 2026, and recommended a final dividend of ₹2.00 per equity share.
The joint statutory auditors — Deloitte Haskins & Sells LLP and HDS & Associates LLP — issued audit reports with an unmodified opinion on both standalone and consolidated results. However, the audit reports carry three separate Emphasis of Matter paragraphs, all relating to disputed claims under arbitration and High Court proceedings. An unmodified opinion with emphasis of matter means the accounts are considered true and fair, but the auditor is specifically drawing your attention to areas of uncertainty.
Other Board Decisions
- Enabling approval sought from members to raise up to ₹250 crore via NCDs, bonds or other instruments on a private placement basis
- Re-appointment of Mr. Subramanian Krishnamurthy as Executive Chairman (Whole-time Director) for two years from 1 July 2026
- Re-appointment of Mr. Srinivasan Paramasivan as Managing Director for two years from 1 July 2026
- HDS & Associates LLP to exit as joint auditor at the 2026 AGM; Deloitte Haskins & Sells LLP continues as sole statutory auditor
- Re-appointment of M/s. Kishore Bhatia & Associates as Cost Auditor for FY 2026-27
- Senior management changes: Mr. Gokul Javalikar retires 30 June 2026; Mr. Satish Tengeri elevated to Business Unit Head – Industrial Division
Management Commentary
The Board's outcome letter dated 18 May 2026 contains no narrative management commentary on the dividend rationale, the reduction from ₹2.50 to ₹2.00, or the capital allocation logic behind paying a dividend in a year of negative operating cash flow.
Dividend rationale disclosure: "Not Disclosed by Company"
Forward earnings guidance: "Not Disclosed by Company". Press reports following the results noted that management refrained from providing FY27 earnings guidance, citing no visible improvement as of the first quarter of FY27. (Source: Business Today, 20 May 2026)
Key Dates Timeline
| Event | Date | What It Means For You |
|---|---|---|
| Board Meeting / Announcement | 18-05-2026 | Dividend recommended by Directors |
| Ex-Dividend Date | 23-07-2026 | Buy on or after this date and you will not get the dividend |
| Record Date | 23-07-2026 | Your name must be on the register on this date |
| Annual General Meeting | 30-07-2026 | Shareholders formally approve the dividend (via VC/OAVM) |
| Payment Date | On or before 28-08-2026 | Money credited to your registered bank account |
Record date, AGM date and payment window sourced from company corporate action intimations reported by market data providers (Groww, Screener) as of 14 July 2026. The 18 May 2026 board outcome letter itself stated the AGM date and payment date were "to be informed in due course."
Understanding Ex-Date vs Record Date
Since Indian markets moved to T+1 settlement, the ex-date and record date fall on the same day. To receive this dividend, you needed to buy the shares on or before 22 July 2026, so the trade settled into your demat account by 23 July 2026. Buying on 23 July itself is too late — the seller receives the dividend, not you.
Dividend Yield Analysis
Yield Calculation
Current Yield
₹2.00 ÷ ₹286.30 × 100 = 0.70%
NSE price as on 23 July 2026 (Source: ICICI Direct)
Yield on Announcement Date Price
₹2.00 ÷ ₹316.90 × 100 = 0.63%
Closing price on 18 May 2026, derived from reported 8.7% intraday fall to ₹289.30 on 19 May 2026 (Source: Business Standard)
Yield on 52-Week High (₹479.40)
= 0.42%
Yield on 52-Week Low (₹265.80)
= 0.75%
Yield Reality Check
Here is the honest reading. Afcons' dividend yield has risen from 0.63% to 0.70% since the announcement. That looks like an improvement. It is not.
The dividend amount did not increase — in fact it was cut by 20%. The yield rose only because the share price fell from ₹316.90 to ₹286.30, a decline of 9.66% in roughly two months. Over one year the stock is down approximately 33%, and it sits 40.3% below its 52-week high of ₹479.40.
This is a falling-price yield, not a rising-dividend yield. Investors should never read a higher yield as a positive signal without checking which of the two variables moved.
How This Compares
At 0.70%, Afcons yields less than a savings bank account and materially less than any fixed deposit. The Indian construction sector average dividend yield sits at approximately 0.8% (Source: Simply Wall St industry data). Afcons is therefore below its own sector average. For context, the top quartile of dividend-paying Indian stocks yields around 1.4% — double what Afcons offers.
Anyone buying Afcons for dividend income is buying the wrong instrument. On a ₹1,00,000 investment at ₹286.30, you would receive approximately ₹698 in gross dividend per year — before tax.
Dividend History Analysis
Dividend Track Record
| Financial Year | Dividend Per Share | Dividend % | Total Outflow | Status |
|---|---|---|---|---|
| FY 2025-26 | ₹2.00 | 20% | ₹73.56 Cr | Recommended |
| FY 2024-25 | ₹2.50 | 25% | ₹91.95 Cr | Paid (Aug 2025) |
| FY 2023-24 | Pre-listing | — | ₹32.33 Cr | Paid pre-IPO (FY25 cash flow) |
| FY 2016-17 to FY 2022-23 | Not Disclosed by Company — Afcons was an unlisted Shapoorji Pallonji Group entity until its stock market listing on 4 November 2024. A ten-year listed dividend history does not exist. | |||
Outflow figures for FY25 and FY24 are taken directly from the "Dividend paid on equity shares" line in the audited Consolidated Statement of Cash Flows. The company also paid ₹0.04 crore of preference dividend in FY25.
Consistency Verdict
With only two dividends declared since listing, and the second one 20% lower than the first, Afcons cannot yet be classified as a Consistent Payer. There simply is not enough listed history to establish a pattern.
Classification: Irregular Payer / Insufficient Track Record
The direction of travel is the more useful signal. The company's first-ever change to its listed dividend was a cut, not an increase. Investing.com data shows a five-year dividend growth rate of approximately -6.51%.
Reading the Cut Correctly
The ₹0.50 reduction saves the company ₹18.39 crore in cash. In the context of a business with ₹3,528.60 crore of total debt and negative operating cash flow, ₹18 crore is a rounding error.
This suggests the cut is signalling, not liquidity management. A board that genuinely needed cash would have suspended the dividend entirely. A board that cuts by 20% while still paying ₹73.56 crore is trying to acknowledge a weak year without breaking a payout record — a fairly common corporate compromise.
Financial Performance Analysis
Consolidated FY26 vs FY25
| Particulars (₹ Crore) | FY 2025-26 | FY 2024-25 | Change |
|---|---|---|---|
| Revenue from Operations | 11,948.38 | 12,548.42 | -4.78% |
| Total Income | 12,322.10 | 13,022.77 | -5.38% |
| EBITDA | 1,438.77 | 1,661.80 | -13.42% |
| EBITDA Margin | 11.68% | 12.76% | -108 bps |
| Profit Before Tax | 386.79 | 710.01 | -45.52% |
| Profit After Tax | 250.74 | 486.79 | -48.49% |
| PAT Margin | 2.03% | 3.74% | -171 bps |
| Basic EPS (₹) | 6.82 | 13.24 | -48.49% |
| Return on Equity | 4.68% | 10.99% | -631 bps |
| Return on Capital Employed | 11.96% | 17.30% | -534 bps |
EBITDA, ROE and ROCE taken from the company's own Key Performance Indicators disclosure filed with the results. All other figures from Consolidated Financial Results.
Operating Leverage — Where the Profit Went
Revenue fell 4.78%. EBITDA fell 13.42%. PAT fell 48.49%. Each line down the profit statement fell harder than the one above it. That is negative operating leverage — a fixed cost base spread over shrinking revenue. Here is exactly where it happened:
- Other expenses rose 13.68% to ₹1,388.21 crore from ₹1,221.15 crore, even as revenue fell. This is the single biggest swing factor. It is driven largely by the provision for expected credit loss, which jumped to ₹321.71 crore from ₹122.53 crore — a 162% increase. Within this, the Afcons Gunanusa JV alone booked a ₹124.12 crore provision for doubtful debtors after an adverse ONGC arbitration award published on 10 March 2026.
- Employee costs rose 1.16% to ₹1,451.72 crore on falling revenue — meaning employee cost as a percentage of revenue rose from 11.44% to 12.15%.
- Finance costs rose 7.06% to ₹673.61 crore, consuming 46.8% of EBITDA versus 37.9% last year. Interest service coverage ratio deteriorated from 3.61x to 2.76x.
- An exceptional item of ₹76.51 crore was booked for the incremental retiral benefit impact of the four new Labour Codes notified on 21 November 2025. This is a genuine one-off, but it still reduced reported profit.
- Material costs fell 13.52% to ₹2,845.17 crore — faster than revenue, which is normal when execution slows, and confirms the revenue decline is an activity problem rather than a pricing problem.
The Q4 Collapse
The full-year numbers understate how bad the final quarter was. In Q4 FY26 Afcons reported a consolidated net loss of ₹88.55 crore against a profit of ₹110.92 crore in Q4 FY25. Quarterly revenue fell 18.91% to ₹2,613.84 crore. The quarterly operating margin collapsed to 0.26% from 7.77%.
The dividend was recommended in the same board meeting that approved a loss-making quarter.
The Order Book Warning
For a construction company, the order book is the forward revenue guarantee. Both key metrics moved in the wrong direction:
- Order Book fell 11.86% to ₹32,495.65 crore from ₹36,868.61 crore
- Order Inflow collapsed 74.15% to ₹4,125.00 crore from ₹15,960.42 crore
- Book-to-Bill ratio declined to 2.72x from 2.94x
- Overseas order book fell 17.24% to ₹4,130.53 crore, and overseas share of the book slipped to 12.71% from 13.54%
An order inflow of ₹4,125 crore against revenue execution of ₹11,948 crore means the company won only 34 paise of new work for every rupee it executed. If sustained, the order book depletes. This is the most forward-looking negative in the entire filing.
Cash Flow Analysis
Profit Is An Opinion. Cash Is A Fact.
This is the section that separates a dividend report from a dividend analysis. Afcons reported a consolidated profit of ₹250.74 crore. It generated cash flow from operations of negative ₹127.49 crore.
The gap between reported profit and operating cash is ₹378.23 crore. And this is not a one-year aberration — FY25 operating cash flow was also negative, at -₹132.20 crore. The company's own KPI disclosure puts CFO/EBITDA at -8.86% in FY26 and -7.96% in FY25.
Consolidated Cash Flow Summary
| Operating profit before working capital | ₹1,702.20 Cr |
| Increase in trade receivables | -₹680.11 Cr |
| Increase in contract assets | -₹635.74 Cr |
| Decrease in contract liabilities | -₹642.95 Cr |
| Increase in trade payables | +₹519.64 Cr |
| Cash generated from operations | ₹110.00 Cr |
| Income tax paid | -₹237.49 Cr |
| Net cash used in operations | -₹127.49 Cr |
| Capex (PPE payments) | -₹371.79 Cr |
| Free Cash Flow | -₹491.42 Cr |
Receivables vs Revenue — The Divergence
This is the clearest red flag in the balance sheet:
- Revenue: down 4.78%
- Current trade receivables: up 23.47% to ₹3,431.52 crore from ₹2,779.32 crore
- Current contract assets (unbilled work): up 14.41% to ₹6,234.46 crore from ₹5,449.18 crore
- Net working capital: 143 days, up from 113 days — an increase of 30 days
- Debtors turnover: fell to 3.02x from 3.43x
When receivables grow four times faster than revenue shrinks, the company is booking revenue it is not collecting. Combined receivables and contract assets now stand at ₹9,665.98 crore — roughly 81% of a full year's revenue sitting on the balance sheet rather than in the bank.
How Is This Dividend Actually Being Funded?
Working through the financing section of the cash flow statement gives an unambiguous answer:
- Current earnings: No. Operating cash flow was negative ₹127.49 crore.
- Free cash flow: No. FCF was negative ₹491.42 crore.
- Asset sales: Marginal. Proceeds from sale of PPE were only ₹7.86 crore.
- Cash reserves: Partly. Cash and equivalents fell ₹56.29 crore during FY26 to ₹385.70 crore.
- Borrowings: Primarily. Net new borrowing in FY26 was ₹1,298.80 crore (long-term ₹771.50 crore drawn less ₹447.14 crore repaid, plus net short-term ₹974.44 crore).
Conclusion: the FY26 dividend of ₹73.56 crore will be paid from borrowed money and existing cash, not from cash the business generated. This is a debt-funded dividend in substance, whatever its legal form.
Balance Sheet Strength
Debt Position
| Metric | FY26 | FY25 |
|---|---|---|
| Total Debt | ₹3,528.60 Cr | ₹2,229.80 Cr |
| Net Debt | ₹2,642.71 Cr | ₹1,459.24 Cr |
| Net Debt / EBITDA | 1.84x | 0.88x |
| Debt / Equity | 0.65x | 0.42x |
| Interest Service Coverage | 2.76x | 3.61x |
| Debt Service Coverage | 1.69x | 2.08x |
Total debt rose 58.25% and net debt rose 81.10% in a single year. Net debt to EBITDA more than doubled. The company is simultaneously increasing leverage and distributing cash to shareholders.
Liquidity Position
| Cash & Cash Equivalents | ₹385.70 Cr |
| Other Bank Balances | ₹500.19 Cr |
| Total Cash & Bank | ₹885.89 Cr |
| Current Ratio | 1.29x |
| Total Equity | ₹5,450.58 Cr |
| Net Worth | ₹5,312.14 Cr |
| Dividend as % of Cash | 8.30% |
On a pure liquidity test, the dividend is comfortably affordable — cash covers it 12.04 times over. Affordability is not the issue. The issue is whether paying it is the best use of that cash given ₹3,528.60 crore of debt.
Contingent and Disputed Positions
A material portion of Afcons' balance sheet depends on winning legal disputes. The auditors flagged these in three separate Emphasis of Matter paragraphs:
- Transtonnelstroy Afcons JV / Chennai Metro: ₹659.87 crore recognised as contract assets, ₹120.81 crore as non-current trade receivables, ₹30.63 crore of arbitration interest and ₹25.77 crore of encashed bank guarantee — a combined ₹837.08 crore dependent on arbitration, Madras High Court and Supreme Court outcomes.
- Konkan Railway / Chenab Bridge: ₹243.53 crore arbitration award, of which ₹115.00 crore sits in non-current contract assets.
- Gabon (SAG) contract: Bonds of Euro 17.84 million (approximately ₹193.82 crore) invoked by Lombard Insurance. The company has initiated ICC arbitration; SAG has filed counterclaims including liquidated damages and recovery of advance payments. Outcome undetermined.
- Dahej Standby Jetty JV: ₹79.28 crore of other non-current financial assets and ₹11.10 crore of contract assets subject to Delhi High Court proceedings.
Taken together, well over ₹1,300 crore of recognised assets — roughly 24% of net worth — rests on favourable legal outcomes that management believes are recoverable but which the auditors explicitly describe as uncertain in duration and outcome.
Dividend Sustainability Analysis
Four-Test Sustainability Framework
| Test | Reading | Verdict |
|---|---|---|
| Cash Position | ₹885.89 Cr cash vs ₹73.56 Cr dividend — 12.04x coverage | Pass |
| Free Cash Flow | FCF of -₹491.42 Cr. Dividend not covered at all | Fail |
| Debt Position | Total debt up 58.25%, net debt up 81.10%, DSCR down to 1.69x | Fail |
| Earnings Trend | PAT down 48.49%, Q4 in loss, order inflow down 74.15% | Fail |
Classification: Moderately Sustainable
Afcons can pay this dividend. Whether it should is a different question, and whether it can keep paying it at this level is a third.
The case for sustainability: The absolute amount is small. ₹73.56 crore against ₹5,450.58 crore of equity and ₹885.89 crore of liquid resources is a 1.35% distribution of net worth. Earnings cover it 3.41 times. Even at halved profitability, the payout ratio of 29.34% is not aggressive. The company has an order book of ₹32,495.65 crore providing 2.72 years of revenue visibility.
The case against: Every dynamic factor is deteriorating. Two consecutive years of negative operating cash flow. Debt up 58%. Receivables up 23% on falling revenue. Order inflow down 74%. A loss-making fourth quarter. Management declining to give FY27 guidance. If FY27 repeats FY26, the dividend either gets cut again or gets funded entirely by fresh borrowing.
The classification is Moderately Sustainable rather than Sustainable precisely because the payment depends on the balance sheet rather than the business.
Peer Comparison
Indian EPC and Construction Peers
| Company | FY26 DPS | Dividend % | Approx. Yield |
|---|---|---|---|
| Afcons Infrastructure | ₹2.00 | 20% (FV ₹10) | 0.70% |
| KEC International | ₹5.50 | 275% (FV ₹2) | ~1.09% |
| NCC Limited | ₹2.20 | 110% (FV ₹2) | ~1.44% |
| Construction Sector Average | — | — | ~0.80% |
Peer dividend data: KEC International FY26 board recommendation of ₹5.50 per share (275% on ₹2 face value) reported 16 May 2026; NCC Limited FY26 dividend of ₹2.20 with record date 14 August 2026, reported via Groww. Yields are indicative and move with price. Sector average yield from Simply Wall St construction industry data.
Where Afcons Stands
- Yield: 0.70% — below sector average of 0.80%, below both KEC and NCC
- Payout ratio: 29.34% — higher than KEC's approximately 26%, but on much weaker earnings
- ROE: 4.68% — materially weak. Screener flags a three-year average ROE of 9.64%
- ROCE: 11.96%, down from 17.30%
- Direction: Afcons cut its dividend while KEC posted record FY26 revenue of ₹23,506 crore and its highest-ever order intake of ₹25,280 crore
Divergence Within the Sector
The most useful takeaway from peer comparison is that Afcons' problems are company-specific, not sector-wide. Indian infrastructure spending remained supportive through FY26. KEC delivered record revenue and record order intake. NCC reported ₹20,944 crore of revenue with 16% order backlog growth.
Afcons, in the same environment, saw order inflow fall 74.15% and revenue fall 4.78%. That points to execution, client concentration and overseas project issues rather than a weak end market. Marketsmojo peer ratings place Afcons in the "Below Average" band for capital structure alongside KEC.
Promoter Impact Analysis
Distribution Split
| Shareholder Category | Holding | Dividend Share |
|---|---|---|
| Promoter (Shapoorji Pallonji Group) | 50.17% | ₹36.90 Cr |
| Domestic Institutions (DII) | ~20.95% | ₹15.41 Cr |
| Foreign Institutions (FII) | ~12.18% | ₹8.96 Cr |
| Public and Retail | ~16.70% | ₹12.29 Cr |
Shareholding pattern as at March 2026 quarter, per Choice, Angel One, Bajaj Finserv and Kotak Neo data aggregation. Categories may not sum to exactly 100% owing to classification differences between providers.
The Pledge Question
This is the most important governance datapoint in the entire analysis, and it does not appear in the dividend filing at all.
Screener.in flags that promoters have pledged 100% of their holding. Separate market reports note Axis Trustee Services disclosed a pledge of 7.35 crore Afcons shares (20% of equity) in favour of debenture holders, with total encumbered shares at 9.2 crore, or 25.03% of the company.
When a promoter group has pledged its entire stake, dividend income becomes a source of servicing cash at the promoter level. This does not make the dividend improper — every shareholder receives the same ₹2 per share. But it does mean the promoter has a structural incentive favouring cash distribution over cash retention, which is worth knowing when a company pays a dividend out of borrowings.
Minority Shareholder View
A retail investor holding 100 shares receives a gross dividend of ₹200. After tax at a 30% slab, roughly ₹140 lands in the bank. Meanwhile the same 100 shares lost approximately ₹3,060 in market value between the announcement price of ₹316.90 and ₹286.30.
The dividend is distributed pro-rata and fairly — there is no structural disadvantage to minority holders. But its economic significance to a retail holder is negligible relative to price movement. For the promoter, ₹36.90 crore is a meaningful cash inflow. Same instrument, very different materiality.
Taxation Analysis
How Dividends Are Taxed in India
Since the Finance Act 2020 abolished Dividend Distribution Tax with effect from 1 April 2020, dividends are taxed in the hands of the shareholder, not the company. The key rules:
- Dividend income is added to your total income and taxed at your applicable income tax slab rate. There is no separate concessional rate.
- It is reported under "Income from Other Sources" in your income tax return.
- TDS under Section 194: the company deducts 10% at source if total dividend from that company exceeds ₹10,000 in a financial year for resident individuals. This threshold was raised from ₹5,000 with effect from 1 April 2025.
- If PAN is not furnished or is inoperative, TDS is deducted at 20% under Section 206AA.
- Resident individuals whose total income is below the taxable limit may file Form 15G (or Form 15H if aged 60 or above) to avoid TDS.
- For non-resident shareholders, TDS is generally 20% plus applicable surcharge and cess under Section 195, subject to relief under a Double Taxation Avoidance Agreement where the required documentation is submitted.
- TDS deducted is not a final tax. It is credited against your total liability and appears in Form 26AS and your Annual Information Statement.
- Interest expense incurred to earn dividend income is deductible up to 20% of the dividend under Section 57.
Afcons issued a shareholder communication on 14 July 2026 covering TDS and withholding tax on the FY 2025-26 dividend, with a document submission deadline of 16 July 2026.
Worked Example — 1,000 Shares at 30% Slab
| Step | Calculation | Amount |
|---|---|---|
| Shares held | — | 1,000 |
| Dividend per share | — | ₹2.00 |
| Gross dividend | 1,000 × ₹2.00 | ₹2,000 |
| TDS under Section 194 | Nil — gross dividend of ₹2,000 is below the ₹10,000 threshold | ₹0 |
| Amount credited to bank | ₹2,000 − ₹0 | ₹2,000 |
| Tax payable at 30% slab | ₹2,000 × 30% | ₹600 |
| Cess at 4% on tax | ₹600 × 4% | ₹24 |
| Net dividend after tax | ₹2,000 − ₹624 | ₹1,376 |
| Investment value at ₹286.30 | 1,000 × ₹286.30 | ₹2,86,300 |
| Gross yield | ₹2,000 ÷ ₹2,86,300 | 0.70% |
| Effective post-tax yield | ₹1,376 ÷ ₹2,86,300 | 0.48% |
The number to remember is 0.48%. That is what a top-slab investor actually earns from this dividend after tax. A savings account pays more. This is a growth-stage infrastructure stock, and the dividend should be treated as a token gesture rather than an income stream.
Surcharge would additionally apply for investors with total income above ₹50 lakh. Tax rules change; please consult a qualified tax adviser for your specific situation.
Key Risks
1. Order Inflow Collapse
Order inflow fell 74.15% to ₹4,125.00 crore. The order book is already down 11.86% to ₹32,495.65 crore. Without a sharp reversal in FY27 order wins, revenue decline compounds rather than stabilises. Book-to-bill has already slipped from 2.94x to 2.72x.
2. Working Capital and Collection Risk
Net working capital extended to 143 days from 113. Trade receivables rose 23.47% while revenue fell. Combined receivables and contract assets of ₹9,665.98 crore represent 81% of annual revenue. Expected credit loss provisioning already jumped 162% to ₹321.71 crore.
3. Rising Leverage and Interest Burden
Total debt up 58.25%, net debt up 81.10%, net debt to EBITDA doubled to 1.84x. Finance costs of ₹673.61 crore now absorb 46.8% of EBITDA. The company is additionally seeking approval to raise a further ₹250 crore via NCDs. Debt service coverage has fallen to 1.69x.
4. Litigation and Arbitration Concentration
Over ₹1,300 crore of recognised assets depend on favourable arbitration and court outcomes across Chennai Metro, Konkan Railway, Gabon and Dahej. The March 2026 ONGC arbitration award went against the Afcons Gunanusa JV, triggering a ₹124.12 crore doubtful debt provision. That is a live demonstration of the risk crystallising.
5. Overseas Execution and Counterparty Risk
Overseas revenue is 28.03% of the total, spread across 20 branches from Mauritania to Indonesia. The Gabon dispute involves bonds of approximately ₹193.82 crore invoked against the company, plus counterclaims from the client. Brokerage commentary in May 2026 cited overseas supply-chain disruption as a direct cause of the weak quarter.
6. Promoter Pledge Overhang
Public data indicates 100% of the promoter holding is pledged, with total encumbrance around 25.03% of equity. A pledged promoter stake in a falling stock creates the possibility of margin-related supply pressure and constrains the promoter's flexibility to support the company with fresh equity.
7. No Forward Guidance
Management declined to issue FY27 earnings guidance, with press reports noting no improvement visible into the first quarter of FY27. Elara Capital downgraded the stock to Sell; other brokerages trimmed targets. Absence of guidance in a deteriorating year is itself an information signal.
8. Structural Negative Operating Cash Flow
Two consecutive years of negative CFO — -₹127.49 crore in FY26 and -₹132.20 crore in FY25 — with CFO/EBITDA at -8.86%. If this persists into a third year, every rupee of dividend, capex and interest must be funded by borrowing or asset monetisation.
What To Monitor
- 1. Quarterly order inflow, starting with Q1 FY27. The single most important number. Watch whether monthly and quarterly order announcements aggregate towards a run-rate above ₹12,000 crore annually. Anything below ₹8,000 crore for FY27 signals a shrinking order book for a second consecutive year. The Croatia orders and the Vadhvan Port breakwater award are the swing items.
- 2. Operating cash flow turning positive. Check the CFO line in the Q2 and full-year FY27 cash flow statements. A third consecutive negative year would fundamentally change the sustainability assessment. Management has publicly targeted working capital reduction — this is where you verify it.
- 3. Net working capital days. Track the movement from the current 143 days. A return towards the 113-day level of FY25 would be the clearest evidence of a genuine turnaround. Further extension towards 160+ days would be a serious warning.
- 4. Net debt and the FY27 capex programme. Management has indicated FY27 capex of approximately ₹725 crore alongside a debt reduction target. Those two objectives conflict unless cash generation improves sharply. Watch net debt to EBITDA — currently 1.84x — and whether the ₹250 crore NCD approval is actually drawn.
- 5. Arbitration outcomes. Specifically: the Transtonnelstroy Afcons JV proceedings before the Madras High Court and Supreme Court (₹837.08 crore exposure), the ICC arbitration with SAG in Gabon (₹193.82 crore of invoked bonds plus counterclaims), and the AGJV appeal against the March 2026 ONGC award. Each resolution directly moves reported net worth.
- 6. Expected credit loss provisioning trend. ECL provisions rose from ₹122.53 crore to ₹321.71 crore. If FY27 provisioning stays elevated, it confirms the receivables build-up is a collectability problem rather than a timing problem.
- 7. EBITDA margin recovery. Margin fell to 11.68% from 12.76%, and Q4 operating margin collapsed to 0.26%. Watch whether quarterly margins return towards the 12–13% band. Employee cost as a percentage of revenue (now 12.15%) is a useful secondary indicator.
- 8. Promoter pledge levels. Monitor quarterly shareholding pattern filings and any pledge creation or release disclosures from Axis Trustee Services or other trustees. A reduction in encumbrance would remove a meaningful overhang.
- 9. FY27 dividend decision. The next board meeting on annual results, expected around May 2027, will show whether ₹2.00 was a floor or a step down. A further cut, or a suspension, would be the clearest possible management statement on cash conditions.
Capital Allocation Analysis
What Else Could ₹73.56 Crore Have Done?
Every rupee paid out is a rupee not deployed elsewhere. Here is what the alternatives look like, quantified:
- Debt reduction: ₹73.56 crore against total debt of ₹3,528.60 crore would cut borrowings by 2.08%. At the implied blended cost of debt from FY26 finance costs, it would save roughly ₹14 crore of annual interest — permanently. That saving alone would fund a fifth of a future dividend every year, forever.
- Additional capex: ₹73.56 crore is 10.15% of the guided FY27 capex programme of ₹725 crore. Gross block already stands at ₹5,802.62 crore, and gross block to revenue rose to 48.56% from 45.64% — the company is already less asset-efficient than last year, so more capex is not obviously the best answer.
- Share buyback: At ₹286.30 per share, ₹73.56 crore buys approximately 25.7 lakh shares, or 0.70% of equity. With the stock 40% off its high, a buyback would be accretive on paper. But funding a buyback with borrowings while net debt is already up 81% would be poor practice, and promoter pledge levels complicate the arithmetic.
- Cash retention: Simply retaining the ₹73.56 crore would lift cash and bank balances to ₹959.45 crore and improve net debt to ₹2,569.15 crore. Given negative free cash flow of ₹491.42 crore, this is arguably the most defensible option on pure financial logic.
The honest assessment: On a pure capital allocation framework, retaining the cash or reducing debt would have been the more rational choice in a year of negative free cash flow and 58% debt growth. The board chose distribution, likely weighing the signalling cost of a first-ever dividend suspension against ₹73.56 crore of cash. The 20% cut is the compromise. Whether that trade-off was correct depends on how much you value dividend continuity as a governance signal — a legitimate consideration, but one that costs real money.
Conclusion
Positives
- Dividend maintained rather than suspended — continuity preserved in a difficult year
- Comfortable liquidity: cash and bank of ₹885.89 crore covers the dividend 12.04 times
- Payout ratio of 29.34% remains conservative even on halved earnings
- Earnings cover the dividend 3.41 times
- Order book of ₹32,495.65 crore provides 2.72 years of revenue visibility
- Unmodified audit opinion from Deloitte Haskins & Sells and HDS & Associates
- The ₹76.51 crore Labour Codes charge is genuinely non-recurring
- Net worth grew to ₹5,312.14 crore from ₹5,136.65 crore
- Strong Shapoorji Pallonji Group parentage and a 65-year execution record across 22 countries
Negatives
- Dividend cut 20% from ₹2.50 to ₹2.00 in the first year it could have been raised
- Second consecutive year of negative operating cash flow (-₹127.49 crore)
- Free cash flow of -₹491.42 crore — the dividend is debt-funded in substance
- PAT down 48.49%; Q4 posted a loss of ₹88.55 crore
- Order inflow down 74.15%; order book down 11.86%
- Total debt up 58.25%; net debt up 81.10%
- Receivables up 23.47% on falling revenue; working capital out to 143 days
- ROE collapsed to 4.68% from 10.99%
- Over ₹1,300 crore of assets contingent on arbitration outcomes
- Yield of 0.70% is below the sector average and falls to 0.48% post-tax
- 100% of promoter holding reportedly pledged
- No FY27 guidance provided by management
The Bottom Line
The Afcons FY26 dividend is a small payment from a company in a difficult year. At ₹73.56 crore it is affordable in absolute terms but not earned in cash terms. The 20% cut is the more informative fact than the ₹2.00 itself — it tells you the board recognised the year for what it was.
Nobody should hold or buy this stock for a 0.70% gross yield that becomes 0.48% after tax. The investment case for Afcons, if there is one, rests entirely on whether order inflow recovers, working capital unwinds and operating cash flow turns positive. The dividend is a footnote to that story, not the story.
We present the numbers, the cash flow reality and the risks. The decision is yours.
Frequently Asked Questions
What dividend has Afcons Infrastructure announced for FY 2025-26?
What is the Afcons Infrastructure dividend yield?
What is the record date for the Afcons dividend?
What is the ex-date and what does it mean?
When will the Afcons dividend be paid?
Who is eligible to receive this dividend?
How is the Afcons dividend taxed in my hands?
Is the Afcons dividend sustainable?
Why did Afcons cut its dividend from ₹2.50 to ₹2.00?
What is the Afcons Infrastructure dividend history?
What should investors monitor going forward?
How much dividend will the promoter group receive?
Is the dividend being paid out of profits or borrowings?
What did the auditors say about the FY26 accounts?
How does the Afcons dividend compare with its peers?
Disclaimer
This article is published by ShareBazaar Online for informational and educational purposes only. It does not constitute investment advice, a recommendation, or an offer or solicitation to buy or sell any security. ShareBazaar Online is not a SEBI-registered investment adviser or research analyst.
All company-specific financial data in this article is sourced from Afcons Infrastructure Limited's audited financial results and Board meeting outcome filed with BSE Limited and the National Stock Exchange of India Limited on 18 May 2026. Market prices, shareholding patterns, peer comparisons and corporate action dates are sourced from publicly available third-party market data providers and are cited where used. Figures may be revised by the company or by data providers subsequently.
The dividend of ₹2.00 per equity share is a Board recommendation and remains subject to approval by shareholders at the Annual General Meeting. Record dates, ex-dates and payment dates are subject to change by the company or the exchanges. Please verify all dates directly with the company or the exchanges before acting.
Taxation commentary reflects our understanding of Indian income tax law as applicable at the time of writing and is general in nature. Tax treatment depends on individual circumstances and is subject to legislative change. Please consult a qualified chartered accountant or tax adviser.
Investments in securities are subject to market risks. Past performance is not indicative of future results. Readers should conduct their own due diligence and consult a SEBI-registered investment adviser before making any investment decision. ShareBazaar Online and its authors accept no liability for any loss arising from reliance on this content.
Explore More Investment Opportunities
Discover IPOs, unlisted shares, and broker comparison tools curated for smart investors.