
Dividend Snapshot
Oberoi Realty Limited has declared its first interim dividend of ₹2.00 per equity share for the financial year 2026-27. The board approved the payout at its meeting on 17 July 2026, which ran from 1:30 p.m. to 3:19 p.m. The dividend equals 20% of the ₹10 face value of each share.
This is the company's fourteenth consecutive quarterly-style payout since July 2022, and continues an unbroken run of ₹2 per share every quarter since November 2023. The headline number is small in yield terms — roughly 0.11% on the current market price — but the payout carries meaningful signalling value about the state of Oberoi's balance sheet, which we unpack in detail below.
Company Identity
Dividend Particulars
Computed Payout Economics
Share count derived from Q1 FY27 consolidated PAT of ₹543.51 crore and reported EPS of ₹14.95. Total outflow is not disclosed by the company in the filing.
Verdict Summary
Dividend Announcement Summary
What The Company Actually Filed
The disclosure was made under Regulation 30 read with Schedule III of the SEBI (Listing Obligations and Disclosure Requirements) Regulations, 2015 — the rule that requires listed companies to inform exchanges of price-sensitive board decisions without delay.
The filing itself is short and states four things: the dividend rate of ₹2 per equity share, the percentage of 20% on ₹10 face value, a record date of 23 July 2026, and payment starting on or before 31 July 2026. It was signed by Company Secretary Bhaskar Kshirsagar and digitally timestamped at 3:30 p.m. on 17 July 2026 — eleven minutes after the board meeting concluded.
Disclosed In The Filing
- Dividend rate: ₹2 per equity share
- Percentage: 20% of face value
- Face value: ₹10 per share
- Record date: 23 July 2026
- Payment: on or before 31 July 2026
- Board meeting duration: 1:30 p.m. to 3:19 p.m.
- Applicable year: FY2026-27
Not Disclosed In The Filing
- Total dividend outflow — Not Disclosed by Company
- Shares outstanding — Not Disclosed by Company
- Ex-date — Not Disclosed by Company (exchange-set; equals record date under T+1)
- Management commentary on the dividend — Not Disclosed by Company
- Dividend policy rationale — Not Disclosed by Company
- Board voting detail — Not Disclosed by Company
Context The Filing Leaves Out
The dividend letter is a standalone filing. On the same day, the board also approved Q1 FY27 results: consolidated revenue from operations of ₹1,300.89 crore (up 31.73% year-on-year) and consolidated net profit of ₹543.51 crore (up 29.02% year-on-year), per the company's results filing as reported by Business Standard on 17 July 2026. Reading the dividend note without the results note gives an incomplete picture — the dividend is only 13.4% of the quarter's profit.
Key Dates Timeline
| Event | Date | What It Means For You |
|---|---|---|
| Board Meeting & Announcement | 17-07-2026 | Board declared the dividend. Filing made to BSE and NSE the same afternoon. |
| Last Cum-Dividend Trading Day | 22-07-2026 | The final day to buy the share and still be eligible. Buy on this day or earlier. |
| Ex-Dividend Date | 23-07-2026 | From this day the share trades without dividend entitlement. Buying now means you do not get ₹2. |
| Record Date | 23-07-2026 | The company freezes the shareholder register. Whoever appears here gets paid. |
| Payment Date | On or before 31-07-2026 | Money credited to the bank account linked with your demat. Only the outer limit is stated. |
Why Ex-Date And Record Date Are The Same
India moved to a T+1 settlement cycle in January 2023. Under T+1, a share bought today is delivered to your demat account tomorrow. Because delivery is one day faster than the old T+2 system, the exchange no longer needs to set the ex-date one day before the record date. They now fall on the same calendar day. Every Oberoi Realty dividend since 2023 has followed this pattern.
The Turnaround Is Unusually Fast
From announcement to payment is a maximum of 14 calendar days. The Companies Act, 2013 allows up to 30 days from declaration to pay a dividend. Oberoi is targeting roughly half that. Its comparable FY26 tranches took 13 days (declared 21 July 2025, paid 7 August 2025) and 18 days (declared 21 January 2026 window). Fast payment cycles generally indicate the treasury has the cash already parked rather than needing to arrange it.
Dividend Yield Analysis
The Arithmetic
Dividend yield tells you what percentage of your invested money comes back as cash in a year. The formula is simple: dividend divided by share price, times 100. Here is what it produces for Oberoi Realty.
| Basis | Dividend | Price | Yield |
|---|---|---|---|
| Single tranche on announcement-day close | ₹2.00 | ₹1,890.00 | 0.11% |
| Single tranche on latest close | ₹2.00 | ₹1,880.40 | 0.11% |
| Trailing twelve months (four tranches) | ₹8.00 | ₹1,880.40 | 0.43% |
| Forward FY27 (if four ₹2 tranches repeat) | ₹8.00 est. | ₹1,880.40 | 0.43% est. |
Announcement-day close of ₹1,890.00 on NSE per Zee Business, 17 July 2026. Latest close of ₹1,880.40 on NSE, 20 July 2026, per NSE India. Forward figure is an estimate based on the company's four-tranche pattern since FY24, not company guidance.
Yield Reality Check — Why It Is This Low
A yield can be high or low for four different reasons, and they carry opposite meanings. Here is which one applies:
- Falling share price? No. The stock closed at ₹1,880.40 on 20 July 2026, near the upper end of its 52-week range of ₹1,391.20 to ₹1,986.10 (NSE data via Bajaj Broking).
- Weak business? No. FY26 consolidated PAT was ₹2,507 crore, an all-time high, up 12.7% on FY25.
- One-time special dividend? No. This is a routine recurring interim.
- Deliberate low payout? Yes — this is the real reason. Oberoi's dividend payout ratio has averaged roughly 13.3% of profits over the last three years (Screener.in). The company retains 87 paise of every rupee earned.
What A Retail Investor Actually Receives
The gap is roughly 15 times. Anyone buying Oberoi Realty for income is misreading the stock. The return case here rests entirely on capital appreciation and book value growth, not on cash distributions.
Historical Yield Trend
Oberoi's yield has been structurally low for a decade. The dividend payout ratio, which drives yield, has moved as follows (Screener.in, consolidated): 21% in FY15, 16% in FY16, 18% in FY17, 15% in FY18, 9% in FY19, 0% in FY20, 0% in FY21, 10% in FY22, 8% in FY23, 15% in FY24, 13% in FY25 and 12% in FY26.
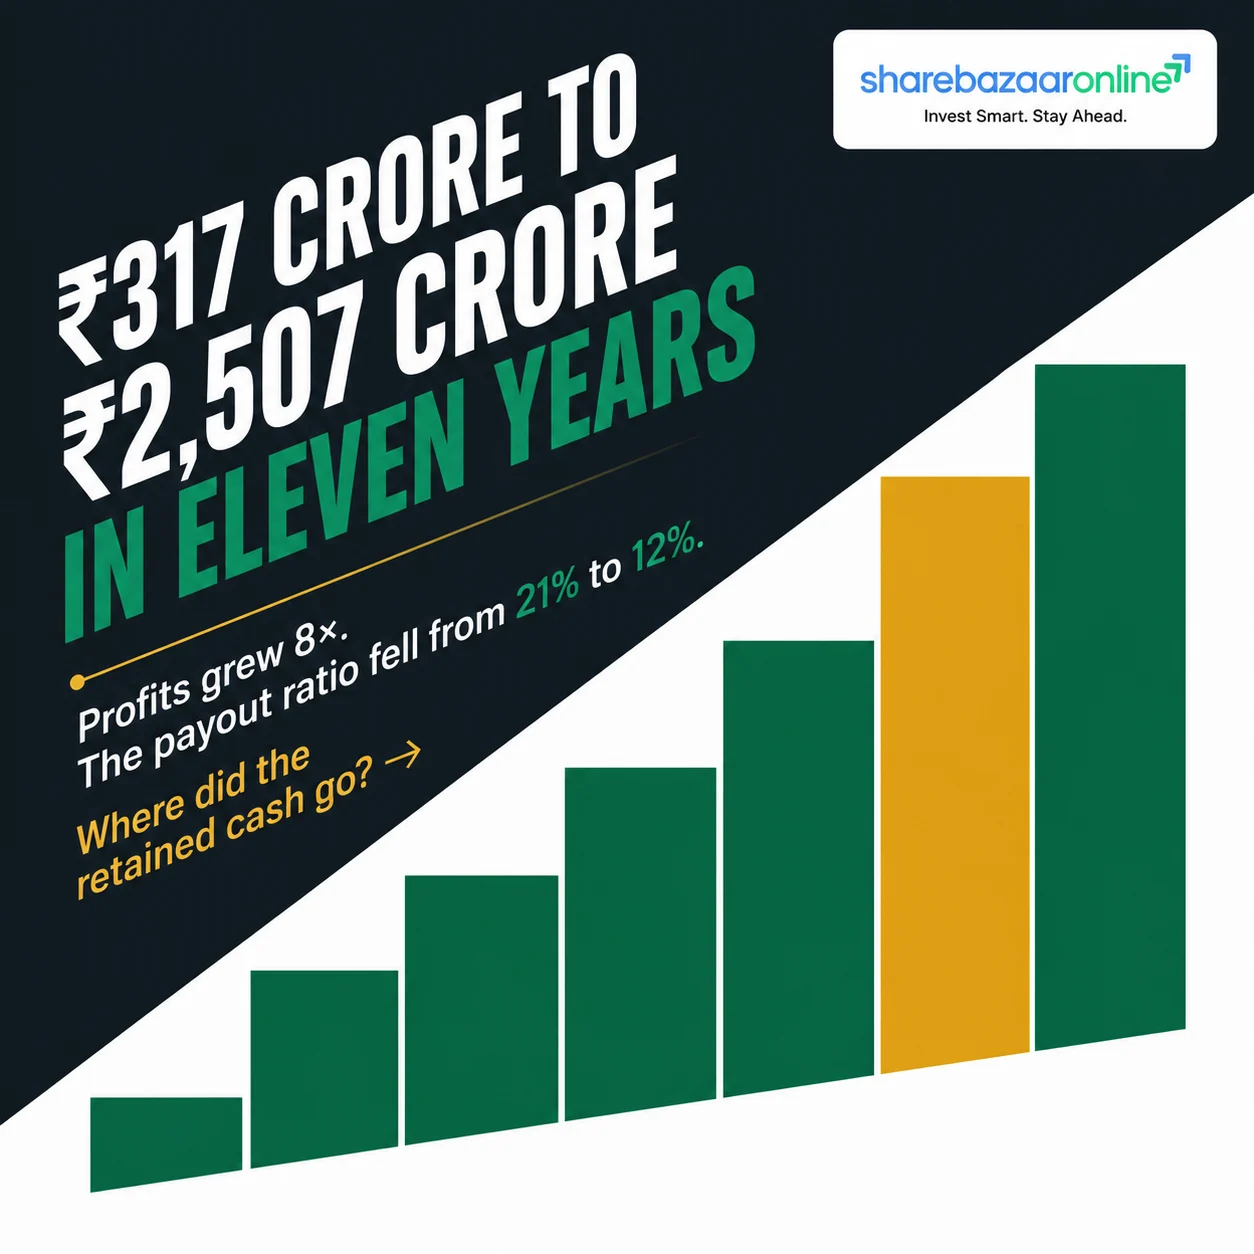
Notice the shape. Payout ratios were higher a decade ago when profits were small. As profits multiplied — from ₹317 crore in FY15 to ₹2,507 crore in FY26, a roughly eight-fold increase — the payout ratio fell. The absolute dividend rose, but nowhere near as fast as earnings. That is a deliberate capital allocation choice, examined in the Capital Allocation section below.
Dividend History Analysis
Ten-Year Dividend Record
| Financial Year | EPS (₹) | Payout Ratio | Implied DPS (₹) |
|---|---|---|---|
| FY2016-17 | 11.15 | 18% | ≈2.00 |
| FY2017-18 | 13.51 | 15% | ≈2.00 |
| FY2018-19 | 22.47 | 9% | ≈2.00 |
| FY2019-20 | 18.96 | 0% | NIL |
| FY2020-21 | 20.33 | 0% | NIL |
| FY2021-22 | 28.80 | 10% | ≈3.00 |
| FY2022-23 | 52.38 | 8% | ≈4.00 |
| FY2023-24 | 52.99 | 15% | ≈8.00 |
| FY2024-25 | 61.21 | 13% | ≈8.00 |
| FY2025-26 | 68.96 | 12% | ≈8.00 |
| FY2026-27 (Q1 only) | 14.95 | 13.4% | 2.00 so far |
EPS and payout ratios from Screener.in consolidated data. Implied DPS derived by ShareBazaar Online from payout ratio and EPS; exact per-share amounts for older years reconcile with exchange-recorded corporate actions.
Tranche-Level Record Since 2022
| Ex-Date | Payment Date | Amount (₹) | Type |
|---|---|---|---|
| 08-07-2022 | 14-08-2022 | 3.00 | Final |
| 21-06-2023 | 28-07-2023 | 4.00 | Final |
| 08-11-2023 | 26-11-2023 | 2.00 | Interim |
| 02-02-2024 | 21-02-2024 | 2.00 | Interim |
| 22-05-2024 | 29-05-2024 | 2.00 | Interim |
| 24-06-2024 | 28-07-2024 | 2.00 | Interim |
| 04-11-2024 | 17-11-2024 | 2.00 | Interim |
| 24-01-2025 | 10-02-2025 | 2.00 | Interim |
| 05-05-2025 | 26-05-2025 | 2.00 | Interim |
| 25-07-2025 | 07-08-2025 | 2.00 | Interim |
| Oct 2025 | Nov 2025 | 2.00 | Interim (2nd, FY26) |
| 23-01-2026 | Feb 2026 | 2.00 | Interim (3rd, FY26) |
| 14-05-2026 | Jun 2026 | 2.00 | Interim (4th, FY26) |
| 23-07-2026 | On or before 31-07-2026 | 2.00 | Interim (1st, FY27) |
Historical ex-dates and payment dates per TipRanks corporate action records and Choice India. Some FY26 dates are approximate where exchange records show only the month.
Classification: Consistent Payer — With A Caveat
- Consistency: Twelve consecutive tranches since November 2023 without a break. Strong.
- Growth trend: Annual DPS moved ₹3 → ₹4 → ₹8 → ₹8 → ₹8. Flat for three years running.
- Special dividends: None ever declared.
- Dividend cuts: None since resumption.
- Suspensions: Two full years — FY2019-20 and FY2020-21 — with zero dividend. This coincided with the COVID period and heavy capital work in progress, which peaked at ₹1,980 crore in FY21.
The Honest Read On "Consistency"
Oberoi's dividend record looks consistent because the observation window is short. Stretch it to ten years and you find a company that stopped paying entirely for two consecutive years when conditions turned. That is not a criticism — suspending a dividend to protect a balance sheet during a shock is defensible management. But it does mean the ₹8 annual run-rate should be treated as a policy that can be revised, not a floor. Oberoi has no publicly stated commitment to a minimum absolute payout.
The three-year flat line at ₹8 despite EPS rising from ₹52.99 to ₹68.96 is itself informative: the board is anchoring on a rupee amount, not a payout percentage.
Financial Performance Analysis
Q1 FY27 — Consolidated
| Metric | Q1 FY27 | Q1 FY26 | YoY | Q4 FY26 |
|---|---|---|---|---|
| Revenue from Operations | ₹1,300.89 Cr | ₹987.55 Cr | +31.73% | ₹1,749.83 Cr |
| Total Income | ₹1,361.69 Cr | ₹1,073.98 Cr | +26.79% | ₹1,823.6 Cr |
| EBITDA (ex-other income) | ₹734.14 Cr | ₹520.30 Cr | +40.06% | ₹960.3 Cr |
| EBITDA Margin | 56.43% | 52.69% | +374 bps | 54.88% |
| Profit Before Tax | ₹711.64 Cr | ₹506.96 Cr | +40.4% | ₹963 Cr |
| Profit After Tax | ₹543.51 Cr | ₹421.25 Cr | +29.02% | ₹703.28 Cr |
| EPS | ₹14.95 | ₹11.59 | +28.99% | ₹19.34 |
Q1 FY27 figures per company results filing dated 17 July 2026, as reported by Business Standard, EquityBulls and Sahi. Q4 FY26 comparatives per Screener.in.
Operating Leverage — Why PBT Grew 40% But PAT Only 29%
This is the single most important line-item story in the quarter and most reports skipped it entirely.
- Revenue grew 31.73%.
- EBITDA grew faster at 40.06% — genuine operating leverage. Margins expanded 374 basis points to 56.43%.
- Finance costs fell 30.0%, from ₹74.95 crore to ₹52.43 crore, adding further to PBT.
- PBT therefore grew 40.4%.
- Then tax intervened. Total tax provision was ₹168.13 crore (₹153.61 crore current plus ₹14.52 crore deferred) — an effective rate of roughly 23.6%, versus about 17% in Q1 FY26.
- That 660 basis point jump in the effective tax rate is what compressed 40.4% PBT growth into 29.02% PAT growth.
Translation for investors: the business performed better than the headline profit number suggests, and the prior-year comparison was flattered by an unusually low tax rate.
Cost Structure Movements
Expenses grew 14.01% against revenue growth of 31.73% — the textbook definition of positive operating leverage. Employee cost rose to 3.17% of revenue from 2.03% in Q4 FY26, reflecting hiring ahead of the NCR and Thane pipeline. Land and construction cost growth of over 50% is the item to watch: it front-runs revenue recognition, so it signals build-out rather than margin erosion, at least for now.
FY2025-26 Full Year — Consolidated
| Metric | FY26 | FY25 | FY24 | FY26 Growth |
|---|---|---|---|---|
| Sales | ₹6,009 Cr | ₹5,286 Cr | ₹4,496 Cr | +13.7% |
| Operating Profit | ₹3,358 Cr | ₹3,103 Cr | ₹2,430 Cr | +8.2% |
| Operating Margin | 56% | 59% | 54% | −300 bps |
| Net Profit | ₹2,507 Cr | ₹2,226 Cr | ₹1,927 Cr | +12.7% |
| EPS | ₹68.96 | ₹61.21 | ₹52.99 | +12.7% |
| Dividend Payout | 12% | 13% | 15% | Declining |
Note the margin direction. Revenue grew 13.7% but operating profit grew only 8.2%, meaning FY26 operating margin contracted 300 basis points to 56% from 59%. Expenses grew 21.4%, from ₹2,183 crore to ₹2,651 crore — outpacing revenue. Q1 FY27's 374 bps margin expansion is a reversal of that FY26 trend, and one quarter does not confirm a turn.
Source: Screener.in consolidated financials, FY26 annual data.
Five-Year Growth Record
The deceleration between the five-year and three-year windows is real. Profit CAGR fell from 28% over five years to 10% over three years. The five-year figure is flattered by a depressed FY21 base. The three-year figure is the more honest picture of recent momentum, and it is materially slower.
Cash Flow Analysis
Profits Are An Opinion. Cash Is A Fact.
Real estate accounting allows revenue to be recognised as construction progresses, long before the last rupee is collected. That makes operating cash flow — the actual money that entered the business — the more reliable measure. Here is where Oberoi Realty's story gets more complicated than the profit line suggests.
Six-Year Cash Flow Record (₹ Crore)
| Year | Net Profit | Operating Cash Flow | Free Cash Flow | OCF as % of Operating Profit |
|---|---|---|---|---|
| FY21 | 739 | 696 | −628 | 90% |
| FY22 | 1,047 | 1,069 | −137 | 115% |
| FY23 | 1,905 | −2,383 | −2,985 | −90% |
| FY24 | 1,927 | 2,816 | 2,140 | 135% |
| FY25 | 2,226 | 2,163 | 1,472 | 91% |
| FY26 | 2,507 | 1,380 | 746 | 65% |
Source: Screener.in consolidated cash flow statements.
Highlighted Finding: The FY26 Cash Divergence
This deserves prominence because no dividend report we reviewed mentioned it.
- FY26 net profit rose 12.7% to ₹2,507 crore.
- FY26 operating cash flow fell 36.2%, from ₹2,163 crore to ₹1,380 crore.
- FY26 free cash flow fell 49.3%, from ₹1,472 crore to ₹746 crore.
- Cash conversion — OCF as a share of operating profit — dropped from 91% to 65%.
Profits went one way and cash went the other. That is a divergence worth understanding, not ignoring.
Receivables Versus Revenue
One diagnostic is debtor days — how long the company waits to be paid. Oberoi's debtor days moved from 8 days in FY25 to 20 days in FY26 (Screener.in). That is a 150% increase, though the absolute level remains low by any standard. Working capital days rose from 596 to 682.
The larger driver, though, is inventory build-up. Q1 FY27 alone carried an inventory accumulation adjustment of roughly ₹473.57 crore. In a developer, cash tied up in under-construction inventory is the normal cost of growth — but it is still cash that is not available for dividends. This is a growth-investment drag, not a collections problem.
How Is This Dividend Actually Funded?
Four possible sources: current earnings, cash reserves, asset sales, or borrowings. Here is the evidence.
Current Earnings — YES, PRIMARY SOURCE
The tranche costs ₹72.71 crore against Q1 FY27 PAT of ₹543.51 crore. It consumes 13.4% of one quarter's profit. Earnings alone comfortably fund it.
Free Cash Flow — YES, COVERED
FY26 FCF of ₹746 crore covers this tranche 10.3 times. A full-year ₹8 payout (≈₹290.84 crore) is covered 2.6 times. Even after the FY26 halving of FCF, coverage holds.
Asset Sales — NO
FY26 investing cash flow was negative ₹463 crore, meaning the company was a net buyer of assets, not a seller. No evidence of divestment funding.
Borrowings — NO
Borrowings fell from ₹3,300 crore to ₹2,825 crore in FY26, a reduction of ₹475 crore. Debt is going down while dividends are being paid. This is the healthy configuration.
Conclusion: the dividend is funded out of current operating earnings, with debt simultaneously being reduced. There is no sign of a borrowed or asset-sale-funded distribution.
Balance Sheet Strength
Key Balance Sheet Items (₹ Crore)
Source: Screener.in consolidated balance sheet, March 2026.
Leverage & Returns
D/E ratios per Oberoi Realty Q1 FY27 investor presentation as reported by EquityBulls and Investing.com. ROE/ROCE per Screener.in.
Dividend Coverage By Balance Sheet
Oberoi is effectively net-debt-free at 0.04× net D/E. Motilal Oswal projects the company will move into a net cash position of roughly ₹480 crore in FY27 and ₹1,440 crore in FY28. A ₹290 crore annual dividend against a ₹17,922 crore net worth represents 1.6% of book value — immaterial to solvency by any measure.
Dividend Sustainability Analysis
Classification: SUSTAINABLE
We assess sustainability on four tests: can the company afford it from cash, is it covered by free cash flow, is debt rising to pay for it, and are earnings growing or shrinking. Oberoi Realty passes all four.
Test 1 — Cash Position
PASS. Investments on the March 2026 balance sheet stood at ₹1,737 crore against a tranche cost of ₹72.71 crore — coverage of 23.9×. Current assets of roughly ₹17,250 crore provide further liquidity. Separately disclosed cash and bank balances are Not Disclosed by Company in the quarterly filing.
Test 2 — Free Cash Flow Coverage
PASS, WITH A WATCH FLAG. FY26 FCF of ₹746 crore covers a full-year ₹8 payout 2.6 times. However, FCF has halved from ₹1,472 crore in FY25. If FCF halves again in FY27, coverage drops to about 1.3× — thin, though still positive. This is the single metric most worth tracking.
Test 3 — Debt Direction
PASS. Borrowings declined ₹475 crore in FY26 to ₹2,825 crore. Finance costs in Q1 FY27 fell 30% year-on-year. The classic red flag — a company borrowing to sustain a dividend — is absent here. Gross D/E improved to 0.15× from 0.19×.
Test 4 — Earnings Trend
PASS, DECELERATING. PAT has risen every year since FY21: ₹739 Cr → ₹1,047 Cr → ₹1,905 Cr → ₹1,927 Cr → ₹2,226 Cr → ₹2,507 Cr. But three-year profit CAGR is 10% against a five-year figure of 28%. Growth is real but slowing.
Coverage Ratios At A Glance
The honest framing: the dividend is sustainable not because Oberoi is a great dividend company, but because the payout is so small relative to the business that almost nothing could break it. A 12% payout ratio means profits would need to fall roughly 88% before the dividend became unaffordable from earnings. That is safety by design, but it is also the reason the yield is 0.43%.
Peer Comparison
Indian Listed Developers — Dividend Metrics
| Company | Latest Annual DPS | Face Value | Approx Yield | Payout Ratio |
|---|---|---|---|---|
| Oberoi Realty | ₹8.00 (4 × ₹2) | ₹10 | 0.43% | 12% (FY26) |
| DLF Ltd | ₹8.00 (final, FY26) | ₹2 | ≈1.19% | Materially higher |
| Godrej Properties | ₹10.00 (FY26) | ₹5 | ≈0.5% | Not Disclosed by Company |
| Macrotech / Lodha | ₹4.25 (FY26) | ₹10 | 0.36% | 14.34% |
| Phoenix Mills | ₹2.50 | ₹2 | 0.16% | 9.02% |
DLF ₹8 final dividend for FY26 per Reuters/TradingView, 13 May 2026; yield computed on ₹672.45 close of 21 July 2026 per Ventura Securities. Godrej ₹10 dividend per company filing, record date 28 July 2026. Lodha and Phoenix yields and payout ratios per TipRanks dividend data. Payout ratios computed on different bases by different providers and are indicative.
Profitability Versus Peers
Peer ROE/ROCE per Samco research notes. Comparisons drawn from different reporting dates.
What The Comparison Actually Shows
Three findings stand out:
- Oberoi is mid-pack on yield, not a leader. DLF yields roughly 2.8 times more. Oberoi sits between Lodha (0.36%) and Godrej (≈0.5%).
- Oberoi leads on profitability. Its 15.0% ROE and 56.43% EBITDA margin are the best in this group. Godrej's ROCE of 7.56% is less than half Oberoi's.
- The entire Indian developer sector is a low-yield sector. Every peer here yields under 1.2%. TipRanks pegs the broader global real estate sector average near 3.3% — a figure inflated by REITs, which are legally required to distribute most income. Indian developers are growth companies, not distribution vehicles. Judging Oberoi against 3.3% is the wrong benchmark.
Promoter Impact Analysis
Who Receives The ₹72.71 Crore
| Shareholder Category | Holding (Mar 2026) | Dividend Received (₹ Cr) | Annualised at ₹8 (₹ Cr) |
|---|---|---|---|
| Promoters | 67.71% | ₹49.23 | ₹196.92 |
| Foreign Institutional Investors | 15.42% | ₹11.21 | ₹44.85 |
| Domestic Institutional Investors | 14.58% | ₹10.60 | ₹42.41 |
| Public / Retail | 2.28% | ₹1.66 | ₹6.63 |
Shareholding pattern per Screener.in, March 2026 quarter. Rupee amounts computed by ShareBazaar Online on an estimated 36.36 crore shares outstanding.
Distribution Impact — Read It Carefully
Just over two-thirds of every dividend rupee — ₹49.23 crore of ₹72.71 crore — goes to the promoter group, chaired by Vikas Oberoi. Retail and public shareholders collectively receive ₹1.66 crore, or roughly 2.3% of the distribution.
This is arithmetic, not accusation. A promoter holding 67.71% is entitled to 67.71% of any dividend. But it is worth stating plainly, because a high promoter stake changes the incentive calculus: promoters at a company like this can convert retained profits into personal cash through dividends without diluting control.
The Counter-Evidence Matters More
The behaviour here argues against dividend extraction:
- The payout ratio is 12%, not 60%. A promoter maximising personal cash extraction would push this far higher.
- The payout ratio has fallen from 15% in FY24 to 12% in FY26 even as profits rose.
- Promoter holding has been frozen at 67.71% since 2019 — no creeping acquisition, no stake sale.
- Retained cash is visibly going into the business: CWIP of ₹1,752 crore and fixed assets of ₹4,700 crore at March 2026.
The promoter is taking the smallest slice the structure permits, not the largest.
Institutional Ownership Shift — A Separate Signal
FII holding has fallen from 19.96% in March 2025 to 15.42% in March 2026 — a decline of 454 basis points in twelve months. DII holding rose over the same period from 10.19% to 14.58%, an increase of 439 basis points. Domestic institutions absorbed almost exactly what foreign institutions sold.
The number of shareholders also fell from 1,07,035 in March 2025 to 93,923 in March 2026 — roughly 13,100 fewer retail holders. This has no direct bearing on the dividend, but investors reading a dividend announcement as a bullish signal should note that sophisticated foreign money has been reducing exposure through the same period.
Taxation Analysis
How Dividends Are Taxed In India Today
Until 2020, companies paid Dividend Distribution Tax (DDT) before handing dividends to shareholders, and dividends arrived largely tax-free in your hands. That system was abolished by the Finance Act, 2020. Since 1 April 2020, the burden sits entirely with the investor.
- Head of income: Dividends are taxed under "Income from Other Sources".
- Rate: Added to your total income and taxed at your applicable slab rate. There is no separate concessional rate and no exemption threshold — every rupee is taxable.
- TDS under Section 194: The company deducts 10% at source if total dividends from that single company exceed ₹10,000 in a financial year. This threshold was raised from ₹5,000 by the Union Budget 2025, effective 1 April 2025.
- No PAN: TDS rises to 20%.
- Threshold is per company: ₹9,000 each from three different companies means no TDS anywhere, even though total dividend income is ₹27,000. You still owe slab-rate tax on all of it.
- Form 15G / 15H: Individuals below the taxable limit (15G) and senior citizens (15H) can file these to avoid TDS entirely.
- TDS is not final tax. It is an advance credit. If your slab is 30%, you owe the balance at return-filing time. If your slab is nil, you claim a refund.
Worked Example A — Standard Illustration
Investor holds 1,000 shares. Dividend ₹10 per share. Tax slab 30%.
Note the trap: because ₹10,000 does not exceed ₹10,000, no TDS is deducted. The investor receives the full amount and must remember to pay ₹3,120 at filing time. One extra share would have triggered TDS.
Worked Example B — Actual Oberoi Realty Case
Investor holds 1,000 shares. Dividend ₹2 per share. Tax slab 30%. Investment ≈₹18.80 lakh.
For a 30%-slab investor, the real cash return is 0.29% per year. On ₹18.80 lakh invested, that is ₹5,504 after tax — less than ₹460 a month.
Post-Tax Yield By Tax Slab
| Slab | Effective Rate with Cess | Net on ₹8 Annual | Post-Tax Yield |
|---|---|---|---|
| Nil / below exemption | 0% | ₹8.00 | 0.43% |
| 5% | 5.20% | ₹7.58 | 0.40% |
| 20% | 20.80% | ₹6.34 | 0.34% |
| 30% | 31.20% | ₹5.50 | 0.29% |
Computed by ShareBazaar Online on the latest close of ₹1,880.40 and an assumed ₹8 annual dividend. Surcharge, applicable to higher income brackets, is excluded. TDS threshold per Section 194 as amended by the Finance Act, 2025.
The Point Most Investors Miss
A low payout ratio is not automatically bad for a taxpaying investor. Cash retained inside Oberoi Realty compounds at the company's 15% ROE with no tax event. Cash distributed is taxed at up to 31.2% before it can be reinvested. For an investor in the highest slab, a company earning 15% on retained capital creates more after-tax wealth by keeping the money than by paying it out — provided it genuinely reinvests it well. That last condition is what the Cash Flow and Capital Allocation sections exist to test.
Key Risks
1. Pre-Sales Fell 36% Year-On-Year In Q1 FY27
Reported revenue rose 31.73%, but that reflects past bookings converting into recognised revenue. The forward indicator moved the other way. Q1 FY27 bookings were 2,28,510 sq ft across 161 units with a gross booking value of ₹1,049.88 crore. Motilal Oswal noted pre-sales declined 36% year-on-year. Collections fell 8% to roughly ₹920 crore. Today's bookings are tomorrow's revenue — this is the leading indicator, and it weakened.
2. Free Cash Flow Halved In FY26
FCF fell from ₹1,472 crore to ₹746 crore, a decline of 49.3%, while operating cash flow dropped 36.2%. Cash conversion fell from 91% to 65% of operating profit. The FY23 precedent is instructive: operating cash flow went to negative ₹2,383 crore in a single year despite ₹1,905 crore of reported profit. This business can consume cash violently when the working capital cycle turns.
3. Geographic And Segment Concentration
Real estate accounted for over 96% of Q1 FY27 revenue, and the portfolio is heavily weighted to the Mumbai Metropolitan Region — Goregaon, Borivali, Thane, Worli and Mulund. A localised shock to Mumbai luxury housing — a stamp duty change, an MMRDA approval freeze, or a regional demand slump — hits nearly the entire revenue base at once. The Gurugram and NCR expansion reduces this over time but is nascent.
4. Earnings Lumpiness Distorts Every Quarter
Quarterly PAT over the last two years has swung between ₹421 crore and ₹760 crore. Q1 FY27 PAT fell 22.72% sequentially from Q4 FY26. Revenue recognition depends on project completion milestones, not on underlying demand. Any single quarter — including a strong one — is a poor guide to run-rate earnings, which makes forward dividend coverage genuinely hard to forecast.
5. Interest Rate And Affordability Sensitivity
Premium residential demand is financed by home loans. A rate cycle turn raises EMIs, extends buyer decision timelines and slows the booking-to-collection conversion that funds construction. Oberoi's own finance costs, though falling now to ₹52.43 crore in Q1 FY27, sit on ₹2,825 crore of borrowings that would reprice on rate moves.
6. FII Selling And Valuation Premium
FII holding declined 454 basis points over twelve months to 15.42%. Separately, Motilal Oswal has noted that Oberoi Realty trades at a premium to the sector and expressed preference for other developers. The stock trades at a P/E in the low-to-mid 20s to mid-30s depending on the earnings basis used. A dividend announcement does nothing to address valuation risk.
7. No Committed Dividend Floor — And A Precedent For Suspension
Oberoi Realty paid zero dividend in FY2019-20 and FY2020-21. The ₹8 annual run-rate has been in place for only three years and is not a stated policy commitment. Interim dividends require no shareholder approval, which means the board can raise, cut or stop them at will. Investors treating ₹8 as a guaranteed floor are extrapolating from a short and favourable window.
What To Monitor
These are forward-looking business metrics. Each has a specific number attached so you can measure it yourself when the next quarterly filing arrives.
1. Three Sixty North Conversion, Gurugram
Oberoi recorded gross bookings of approximately ₹8,109 crore at Three Sixty North in Gurugram in early July 2026 — its first luxury project in the NCR. For context, that single project's booking value exceeds Oberoi's entire FY26 bookings of ₹5,447 crore. Watch: how much converts into collections in Q2 and Q3 FY27, and whether cancellation rates stay low. This is the single largest swing factor for FY27-28 revenue and cash flow.
2. Cash Conversion Ratio Recovery
Operating cash flow as a share of operating profit fell to 65% in FY26 from 91% in FY25 and 135% in FY24. Watch: whether FY27 recovers toward 90%+. If it stays at or below 65%, free cash flow will remain compressed and the ₹8 run-rate becomes harder to defend from internal accruals.
3. Quarterly Pre-Sales Booking Value
Q1 FY27 gross booking value was ₹1,049.88 crore, down from ₹1,639 crore in Q1 FY26 — a decline of 36%. Watch: whether Q2 FY27 recovers above ₹1,600 crore. Pre-sales lead revenue by roughly six to twelve quarters in this business, so this is the earliest reliable warning system.
4. Unsold Inventory Absorption
Project-till-date, Oberoi has developed 1.14 crore sq ft of carpet area, of which 82.50 lakh sq ft is booked, leaving 31.45 lakh sq ft unsold — roughly 27.6% of the portfolio. Watch: whether this inventory number falls quarter-on-quarter. Rising unsold inventory alongside rising CWIP would signal supply outrunning demand.
5. Net Debt Trajectory Toward Net Cash
Net debt-to-equity stood at 0.04× in Q1 FY27. Motilal Oswal projects Oberoi turns net cash positive at roughly ₹480 crore in FY27 and ₹1,440 crore in FY28. Watch: whether the crossover into net cash actually happens. If borrowings rise instead, the funding quality of future dividends changes materially.
6. Effective Tax Rate Normalisation
The effective tax rate jumped from roughly 17% in Q1 FY26 to 23.6% in Q1 FY27, converting 40.4% PBT growth into 29.02% PAT growth. Screener data shows annual tax rates ranging from 14% to 27% over recent years. Watch: where FY27 settles. Every 100 basis points on the tax rate costs roughly ₹33 crore of annual PAT at current profit levels.
7. Annuity Income From Commercial And Retail
Oberoi's investment property portfolio — Commerz III, Oberoi Mall, Sky City Mall Borivali — generates recurring rental income that is far more predictable than lumpy residential recognition. Fixed assets grew from ₹3,053 crore in FY24 to ₹4,700 crore in FY26. Watch: whether annuity income as a share of total revenue rises above the current sub-4% level. Higher annuity share would materially improve dividend predictability.
8. Payout Ratio Direction
The payout ratio has fallen three years running: 15% → 13% → 12%. The dividend has been flat at ₹8 while EPS climbed from ₹52.99 to ₹68.96. Watch: whether the board raises the quarterly rate above ₹2 at any point in FY27. A raise would signal the capex cycle is peaking; continued flatness signals reinvestment remains the priority.
Capital Allocation Analysis
The ₹72.71 Crore Question — What Else Could It Have Done?
Every rupee paid as dividend is a rupee not used elsewhere. Here is what Oberoi gave up, quantified.
Option A — Reduce Debt Further
Borrowings stood at ₹2,825 crore. An annual ₹290.84 crore payout redirected to repayment would cut debt by roughly 10.3% per year. At an implied blended cost of about 7.4% (₹241 crore FY26 interest on average borrowings), that saves roughly ₹21.5 crore of annual interest. Verdict: marginal. At 0.04× net D/E, further deleveraging adds little.
Option B — Increase Capex
CWIP was ₹1,752 crore at March 2026. The full annual dividend would fund a 16.6% increase in work-in-progress. Verdict: Oberoi is already deploying aggressively — the ₹5,400 crore Bandra East land acquisition from the rail authority, ₹459.5 crore into HHPL and ₹268.5 crore into CRPL in Q1 FY27 alone. These commitments dwarf the dividend. Capital is not being starved.
Option C — Conduct A Buyback
₹290.84 crore at ₹1,880.40 would retire roughly 15.5 lakh shares, or 0.43% of equity. Verdict: unattractive here. With promoter holding already at 67.71%, a buyback pushes it toward the 75% SEBI maximum public shareholding ceiling. It also would not help the promoter unless they tender. Buybacks make sense for cash-rich, low-growth companies — Oberoi is neither.
Option D — Retain All Cash
Retaining ₹290.84 crore annually and compounding at Oberoi's 15% ROE would generate roughly ₹43.6 crore of incremental annual earnings. Compared with paying it out and having a 30%-slab investor keep ₹200 crore after tax, retention arguably creates more value. Verdict: defensible economically — but the token dividend provides a discipline signal and keeps dividend-mandate institutional funds eligible to hold the stock.
Our Assessment
The 12% payout ratio is the correct answer for a company at this point in its cycle — but not for the reason usually given. It is correct because Oberoi has genuinely high-return reinvestment opportunities open to it right now: an ₹8,109 crore NCR booking event, a ₹5,400 crore Bandra East land bank, and a build-out pipeline of 31.45 lakh sq ft of unsold inventory. A company with a 17.8% ROCE and a live pipeline should retain.
The test comes later. If the ROCE falls toward the cost of capital, or if the pipeline empties, and the payout ratio still sits at 12%, the argument flips from prudent reinvestment to inefficient hoarding. That is the moment to reassess — not today.
Conclusion
Oberoi Realty's ₹2 interim dividend is a small, well-covered payout from a company that is choosing to reinvest almost everything it earns. Understanding that sentence is the whole analysis. The dividend is safe — it consumes 13.4% of one quarter's profit and is covered 10.3 times by last year's free cash flow. It is also, at 0.11% per tranche and 0.43% annualised, financially close to irrelevant as an income stream.
Positives
- Twelve consecutive tranches since November 2023 without interruption.
- Q1 FY27 revenue up 31.73% and EBITDA up 40.06% with 374 bps of margin expansion.
- Borrowings reduced ₹475 crore in FY26; net D/E at 0.04×, effectively net-debt-free.
- FY26 PAT of ₹2,507 crore was an all-time high; ROE 15.0%, ROCE 17.8% — best in its peer set.
- Finance costs down 30% year-on-year in Q1 FY27.
- Payment cycle of just 14 days from declaration, half the statutory allowance.
- Roughly ₹8,109 crore of Gurugram bookings recorded in July 2026 — a genuine growth catalyst.
Negatives
- FY26 operating cash flow fell 36.2% and free cash flow fell 49.3% while profits rose.
- Q1 FY27 pre-sales declined 36% year-on-year; collections down 8%.
- Payout ratio has fallen three years running: 15% → 13% → 12%; DPS flat at ₹8 for three years.
- Post-tax yield for a 30%-slab investor is 0.29% — roughly one-twentieth of a fixed deposit.
- ₹49.23 crore of the ₹72.71 crore goes to the promoter group; retail receives ₹1.66 crore.
- FII holding fell 454 basis points to 15.42% over twelve months.
- Precedent of complete dividend suspension in FY2019-20 and FY2020-21.
- FY26 operating margin contracted 300 basis points to 56% as expenses grew 21.4% against 13.7% revenue growth.
How To Read This Announcement
The dividend itself is not the news. The news is what accompanies it: a quarter with 40% EBITDA growth but 36% lower pre-sales, a balance sheet approaching net cash, and a cash conversion ratio that has weakened for two consecutive years. A ₹2 dividend from a company generating ₹543 crore of quarterly profit tells you the board is comfortable — it does not tell you the business is accelerating.
Investors buying before 23 July 2026 to capture ₹2 per share should understand they are capturing 0.11% — an amount typically smaller than the day's normal price movement. The decision to own Oberoi Realty should rest on the pipeline, the margin trajectory and the cash conversion recovery. Not on this dividend.
Frequently Asked Questions
What dividend has Oberoi Realty announced in July 2026?
What is the dividend yield on this Oberoi Realty dividend?
What is the record date for the Oberoi Realty interim dividend?
What is the ex-dividend date, and why is it the same as the record date?
When will the Oberoi Realty dividend be credited to my account?
Who is eligible to receive this dividend?
How is this dividend taxed in India?
How much tax will I pay if I hold 1,000 Oberoi Realty shares?
Is the Oberoi Realty dividend sustainable?
What is Oberoi Realty's dividend history?
What should investors monitor after this dividend?
Why is Oberoi Realty's dividend yield so much lower than a fixed deposit?
Does this interim dividend need AGM approval?
How much of this dividend goes to the promoters?
Should I buy Oberoi Realty shares just to capture this dividend?
Disclaimer
This article is published by ShareBazaar Online for informational and educational purposes only. It does not constitute investment advice, a research report under SEBI (Research Analysts) Regulations, 2014, or a recommendation to buy, sell or hold any security. ShareBazaar Online is not a SEBI-registered investment adviser or research analyst.
Dividend particulars — rate, percentage, face value, record date and payment window — are taken directly from Oberoi Realty Limited's filing to BSE Limited and the National Stock Exchange of India Limited dated 17 July 2026. All other figures, including share prices, financial results, cash flow data, balance sheet items, shareholding patterns and peer comparisons, are sourced from publicly available third-party sources including NSE India, Screener.in, Business Standard, EquityBulls, TipRanks, Motilal Oswal research commentary and company investor presentations, and are cited within the relevant sections.
Derived figures — including total dividend outflow, shares outstanding, promoter dividend income, coverage ratios and post-tax yields — are computed by ShareBazaar Online from publicly disclosed data and are clearly labelled as such. Where the company has not disclosed an item, we state "Not Disclosed by Company". Derived figures may differ from company-reported figures due to rounding, differing share counts or differing accounting bases.
Taxation commentary reflects Indian income tax provisions as understood at the date of publication, including amendments to Section 194 effective 1 April 2025. Tax treatment depends on individual circumstances, residential status and applicable surcharge, and is subject to change. Consult a qualified chartered accountant or tax adviser before acting on any tax information here. Nothing in this article should be treated as tax advice.
Securities markets are subject to market risks. Past dividend payments do not guarantee future dividends, and boards may revise or discontinue interim dividends without shareholder approval. Read all scheme and offer documents carefully before investing. ShareBazaar Online, its editors and its contributors accept no liability for any loss arising from reliance on this content. Readers should verify all dates and figures independently with the company's official filings and their broker before acting.