
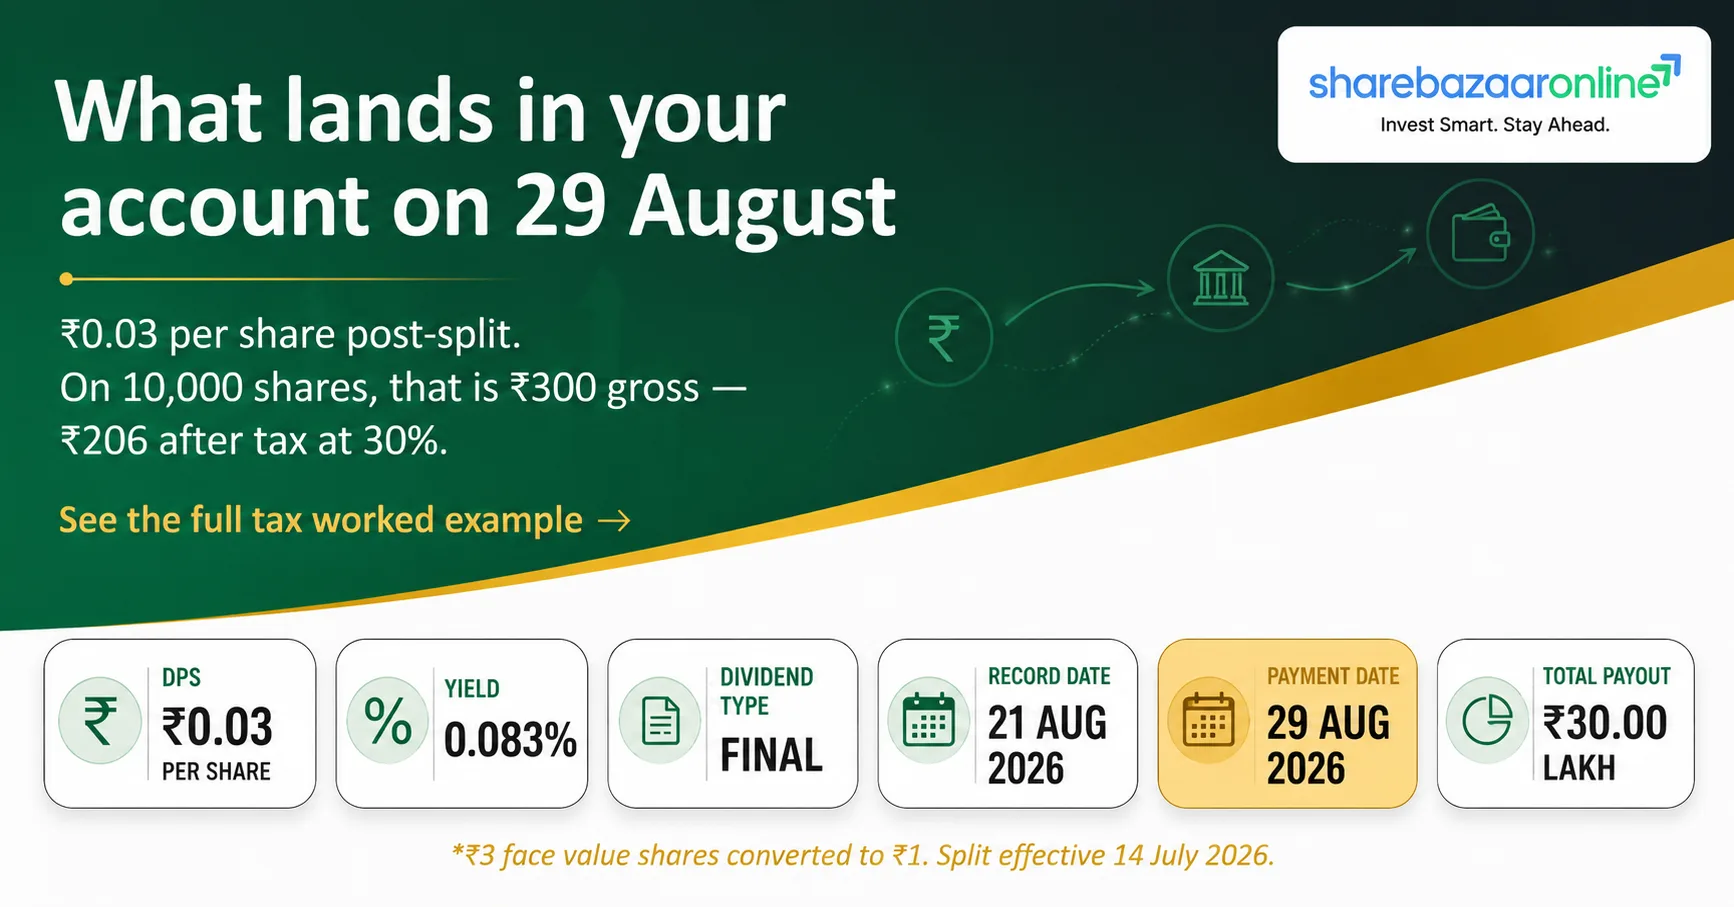
Dividend Snapshot
Mangalam Worldwide Limited (NSE: MWL | BSE: 544764), an Ahmedabad-based fully integrated stainless steel manufacturer, has recommended a Final Dividend of ₹0.30 per equity share of face value ₹10 (i.e. 3% of face value) for the financial year ended 31 March 2026.
There is one detail every shareholder must understand before doing any yield maths. The company completed a 1:10 stock split on 10 July 2026 — one share of ₹10 became ten shares of ₹1. The dividend record date is 17 July 2026, which falls after the split. The company has confirmed that the dividend will be paid on the sub-divided shares in proportion. In plain language: you now receive ₹0.03 per share on ten times as many shares. Your rupee entitlement is unchanged. Anyone dividing ₹0.30 by today's post-split price of about ₹36 will calculate a yield roughly ten times higher than reality.
Dividend Particulars
| Company | Mangalam Worldwide Limited |
| NSE Symbol | MWL |
| BSE Scrip Code | 544764 |
| ISIN (pre-split) | INE0JYY01011 |
| ISIN (post-split, w.e.f. 10-07-2026) | INE0JYY01029 |
| Dividend Type | Final Dividend |
| Dividend Per Share (as declared) | ₹0.30 (FV ₹10) |
| Split-Adjusted Per Share | ₹0.03 (FV ₹1) |
| Dividend % | 3% of face value |
| Financial Year | FY 2025-26 |
| AGM Approval Required | Yes — 30th AGM, 30-07-2026 |
Computed Dividend Economics
| Shares Outstanding (pre-split) | 2,97,00,674 |
| Shares Outstanding (post-split) | 29,70,06,740 |
| Paid-up Equity Share Capital | ₹29.70 Crore |
| Total Dividend Outflow | ₹0.89 Crore |
| Dividend Payout Ratio | 1.78% of PAT |
| Dividend Coverage (EPS ÷ DPS) | 56.2 times |
| Yield on Announcement-Date Price | 0.09% |
| Yield at Current Market Price | 0.08% |
| Promoter Share of Dividend | ₹59.25 Lakh |
| Public Shareholders' Share | ₹29.84 Lakh |
Computed by ShareBazaar Online. Share count per BSE listing intimation dated 27-05-2026 (2,97,00,674 shares of ₹10 each). PAT and EPS per company's FY26 audited results.
The One-Line Summary
A company that earned ₹50.14 crore in FY26 is returning ₹0.89 crore to shareholders — about 1.78 paise of every rupee earned. This is a token, symbolic dividend, not an income proposition. The genuinely interesting questions are why the payout is this small, where the retained cash is going, and whether the reported profit is actually turning into cash. We address all three below.
Dividend Announcement Summary
What the Board Actually Approved on 29 April 2026
The Board of Directors met on Wednesday, 29 April 2026, from 3:30 p.m. to 8:30 p.m. The dividend was item three on a seven-item agenda. The full list matters, because several of the other items tell you more about capital allocation than the dividend does:
- Standalone Audited Financial Results for Q4 and FY26 approved, with an Unmodified (clean) audit opinion.
- Consolidated Audited Financial Results for Q4 and FY26 approved, also with an Unmodified audit opinion.
- Final Dividend of ₹0.30 per equity share (3% of ₹10 face value) recommended for FY26, subject to member approval at the ensuing AGM.
- M/s. S S Rawat & Co., Chartered Accountants, Surat (FRN 147356W) appointed Internal Auditor for FY 2026-27.
- M/s. V. M. Patel & Associates, Cost Accountants (FRN 101519) appointed Cost Auditor for FY 2026-27.
- Proposal approved for direct listing on the Main Board of BSE Limited, subject to BSE approval. (This was subsequently completed — the shares were admitted to BSE dealings effective 27 May 2026 under scrip code 544764.)
- Mr. Chanakya Prakash Mangal (DIN: 06714256) re-designated from Managing Director to Non-Executive Non-Independent Director with effect from 29 April 2026, on the recommendation of the Nomination and Remuneration Committee.
A Governance Change Worth Noting
Mr. Chanakya Prakash Mangal, aged 30, had been appointed Managing Director for the term 01-03-2025 to 01-03-2028. That term was cut short roughly fourteen months in. He remains a promoter and a director, holds 44,25,500 shares (pre-split), and is the son of Chairman & Managing Director Mr. Vipin Prakash Mangal and elder brother of Managing Director Mr. Chandragupt Prakash Mangal. He also sits on the board of the group's listed entity, Mangalam Global Enterprise Limited.
The filing does not state a reason for the early re-designation beyond the NRC recommendation. Where an executive term is truncated mid-tenure at a promoter-controlled company, the explanation is something investors are entitled to ask about at the AGM. We record it as an open question, not as a red flag.
What the Filing Did Not Disclose
The 29 April 2026 board outcome deliberately left the calendar open. It stated the company would inform exchanges "in due course" of the AGM date, the record date, and the payment date. Those blanks were filled at a subsequent board meeting on 26 June 2026.
Also Not Disclosed by Company in the dividend intimation: total dividend outflow in rupees, dividend payout ratio, promoter dividend entitlement, and any management commentary on why the payout ratio is being held below 2%. All outflow figures in this report are ShareBazaar Online computations from the disclosed per-share amount and the disclosed share count.
Key Dates Timeline
Full Corporate Action Calendar
| Event | Date | What It Means For You |
|---|---|---|
| Board Announcement | 29-04-2026 | Board recommended ₹0.30 per share. A recommendation is not yet a declaration. |
| Stock Split Record Date | 10-07-2026 | ₹10 face value sub-divided into ten shares of ₹1. New ISIN INE0JYY01029 effective. |
| Dividend Ex-Date | 17-07-2026 | Under T+1 settlement the ex-date and record date coincide. To be eligible you had to buy on or before 16-07-2026. |
| Dividend Record Date | 17-07-2026 | The register of members on this date determines who gets paid. |
| E-Voting Cut-off | 23-07-2026 | Shareholders on this date may vote on AGM resolutions. |
| Remote E-Voting Window | 27-07-2026 to 29-07-2026 | 9:00 a.m. on 27 July to 5:00 p.m. on 29 July. |
| 30th AGM | 30-07-2026 | 2:00 p.m. IST via video conferencing. Members formally declare the dividend here. |
| Payment Date | On or before 29-08-2026 | Statutory limit is 30 days from declaration. The company has committed to this outer date rather than naming a specific day. |
Record date, AGM date and payment schedule per the company's intimation following the board meeting of 26 June 2026. Split record date and ISIN change per NSE and BSE circulars dated 07-07-2026.
Reading the Sequence Correctly
The gap between announcement (29 April) and record date (17 July) is 79 days, and between record date and outer payment date (29 August) is a further 43 days. From announcement to cash in hand is therefore up to four months. For a dividend worth three paise per post-split share, the time value of that wait is essentially the whole story — this is a compliance and signalling exercise, not a cash-return event.
The split falling one week before the dividend record date is the trap. Anyone who bought after 10 July saw a share price near ₹36 and a headline dividend of ₹0.30 and may have assumed a yield close to 0.8%. The correct entitlement is ₹0.03 per share, and the correct yield is roughly 0.08%.
Dividend Yield Analysis
Yield Calculations, Shown Fully
Yield on announcement-date price
₹0.30 ÷ ₹350.80 × 100 = 0.0855%, rounded to 0.09%
₹350.80 was the NSE closing level on 30 April 2026, the first full session after the board meeting concluded at 8:30 p.m. on 29 April (source: Trendlyne).
Yield at current market price
₹0.03 ÷ ₹36.00 × 100 = 0.0833%, rounded to 0.08%
₹36.00 is the post-split traded price on 22 July 2026 (source: ScanX / Dhan). This is equivalent to ₹360 on the old ₹10 face value.
What ₹1,00,000 invested earns
₹1,00,000 ÷ ₹36 = 2,777 shares × ₹0.03 = ₹83 gross dividend per year, before tax.
Yield Reality Check — Why the Yield Is This Low
A low yield can come from a small dividend, a high share price, or both. Here it is both, and the price effect is the larger of the two.
- The payout is deliberately small. At 1.78% of profit, this is close to the smallest meaningful dividend a board can declare while still declaring one.
- The share price has re-rated hard. The stock is up roughly 133% over the trailing twelve months and market capitalisation has risen about 134% in the same period (source: Screener.in / Bajaj Finserv data as at July 2026). A dividend that grew 50% against a price that grew 133% produces a falling yield.
- There is no special dividend and no one-off element. Nothing is inflating the headline.
- Weak business performance is not the cause. FY26 profit grew 70%. This is a re-rating and retention story, not a distress story.
Conclusion: anyone buying MWL for income is buying the wrong instrument. At 0.08%, a savings account pays roughly forty times more.
Historical Yield Context
MWL listed on the NSE SME platform on 11 July 2022 and migrated to the NSE Main Board in September 2025, so a genuine ten-year yield history does not exist. Across the four years for which a dividend has been declared, the yield has compressed steadily: from roughly 0.6% in the early SME years, to 0.06% on the FY25 dividend, to 0.08% now. The direction is unambiguous. Historical yield data beyond the listing date is Not Disclosed by Company and does not exist in the public record.
Dividend History Analysis
Five-Year Dividend Record
| Financial Year | Type | DPS (FV ₹10) | EPS | Payout Ratio | Ex / Record Date |
|---|---|---|---|---|---|
| FY 2021-22 | Final | ₹1.00 | ₹6.88 | 15% | Not separately verified |
| FY 2022-23 | Final | ₹1.00 | ₹7.03 | 14% | Not separately verified |
| FY 2023-24 | Final | ₹1.00 | ₹8.40 | 12% | 02-08-2024 |
| FY 2024-25 | Final | ₹0.20 | ₹9.93 | 2% | 18-07-2025 |
| FY 2025-26 | Final | ₹0.30 | ₹16.87 | 1.78% | 17-07-2026 |
FY24 and FY25 per-share amounts and dates verified from exchange corporate action records. FY22 and FY23 per-share amounts are ShareBazaar Online estimates derived from the disclosed dividend payout percentage and reported EPS; the underlying per-share declarations for those SME-listing years are Not Disclosed by Company in a separately verifiable exchange record.
The Finding Most Coverage Missed
MWL paid a steady ₹1.00 per share for three consecutive years (FY22, FY23, FY24). Then in FY25 the dividend was cut to ₹0.20 — an 80% reduction — in a year when EPS actually rose from ₹8.40 to ₹9.93.
FY26's ₹0.30 is a 50% increase over FY25 but still 70% below the FY24 level. Meanwhile EPS has doubled from ₹8.40 to ₹16.87. So over two years, earnings per share are up roughly 101% and dividend per share is down 70%.
The payout ratio tells the same story more starkly: 15% → 14% → 12% → 2% → 1.78%. This is a structural change in distribution policy, not a bad year.
Classification: Irregular Payer
On the standard three-way test, MWL is classified as an Irregular Payer, not a Consistent Payer.
- Consistency: Dividends declared in four of the last five years. No suspension. Positive.
- Growth trend: Negative. DPS is 70% below its FY24 peak while EPS has doubled.
- Special dividends: None ever declared.
- Dividend cuts: One severe cut — 80% in FY25 — during a year of rising profits.
- Suspensions: None recorded since listing.
A company that cuts its dividend 80% in a profitable year has told you where it sits on the growth-versus-distribution spectrum. That is not a criticism — it is information.
Financial Performance Analysis
FY26 Consolidated Results at a Glance
| Metric (₹ Crore) | FY26 | FY25 | FY24 | FY26 Growth |
|---|---|---|---|---|
| Total Income | 1,214.98 | 1,066.03 | — | +13.97% |
| Revenue from Operations | 1,207.98 | 1,060.71 | 818.00 | +13.88% |
| EBITDA | 97.84 | 60.05 | 20.92 | +62.93% |
| EBITDA Margin | 8.05% | 5.63% | — | +242 bps |
| Profit After Tax | 50.14 | 29.53 | 17.58 | +69.79% |
| PAT Margin | 4.13% | 2.77% | — | +136 bps |
| Diluted EPS (₹, FV ₹10) | 16.87 | 10.29 | 8.45 | +63.95% |
Source: Company FY26 audited results and investor communication dated 30 April 2026. Consolidated basis.
Operating Leverage Analysis — The Good Half
This is a textbook positive operating leverage year at the full-year level:
- Revenue growth: +13.88%
- EBITDA growth: +62.93%
- PAT growth: +69.79%
EBITDA grew 4.5 times faster than revenue. Margin expanded 242 basis points. In an integrated stainless steel business, that pattern normally means a favourable mix shift toward value-added products (bright bars, seamless pipes and tubes) rather than volume-driven commodity sales — consistent with the company's Kapadvanj bright bar unit ramping and the Mangalam Tubicore seamless pipe line maturing.
Interest cost is the drag: it rose from roughly ₹24 crore in FY25 toward ₹33 crore on a trailing basis, which is why PAT margin at 4.13% remains thin despite an 8.05% EBITDA margin.
Operating Leverage Analysis — The Half Nobody Reported
Look at the fourth quarter in isolation and the picture inverts:
- Q4 FY26 Total Income: ₹266.51 crore vs Q4 FY25 ₹324.56 crore — a decline of 17.89%
- Q4 FY26 PAT: ₹15.37 crore vs ₹8.48 crore — a rise of 81%
- Q4 FY26 EBITDA: ₹15.65 crore
Revenue fell almost 18% year-on-year in the final quarter, while profit rose 81%. Total expenses in the quarter fell to roughly ₹250 crore from ₹318 crore. Some of that is genuine margin discipline. But note that Q4 PAT of ₹15.37 crore is almost identical to Q4 EBITDA of ₹15.65 crore — after interest of roughly ₹10 crore per quarter and depreciation of roughly ₹3 crore. That arithmetic only works if the tax line is contributing rather than subtracting.
The tax rate is the item to interrogate. Screener.in's automated checklist flags "Tax rate seems low" for this company, and reported quarterly effective tax rates have been negative in several recent quarters. Low or negative tax charges — whether from deferred tax reversals, MAT credit recognition, or unit-level exemptions — flatter reported PAT growth without adding a rupee of operating strength. A meaningful share of the 70% PAT growth is below the operating line. Retail investors reading the "PAT up 70%" headline are not being told this.
Multi-Year Revenue and Earnings Trajectory
Revenue has compounded from ₹302 crore in FY21 to ₹1,208 crore in FY26 — roughly 4x in five years, a three-year compounded sales growth of about 27%. PAT over the same window went from about ₹3 crore to ₹50.14 crore. This is genuine, rapid scale-up, helped by the demerger of H.M. Industrial's steel division into the company and the merger of Mangalam Saarloh Private Limited.
The caveat: growth of this speed at a 4% net margin consumes working capital aggressively. That is exactly what the cash flow statement shows, and it is the single most important section of this report.
Cash Flow Analysis
Reported Profits Are Opinions. Cash Is Fact.
This is where MWL's story gets genuinely uncomfortable, and it is the section that separates analysis from reporting. Here is the consolidated cash flow record:
| ₹ Crore | FY21 | FY22 | FY23 | FY24 | FY25 |
|---|---|---|---|---|---|
| Net Profit | 3 | 12 | 18 | 23 | 30 |
| Cash from Operations | +6 | +2 | -61 | -10 | -87 |
| Cash from Investing | -1 | -40 | -38 | -20 | -7 |
| Cash from Financing | -4 | +43 | +98 | +26 | +94 |
| Free Cash Flow | +4 | -49 | -101 | -21 | -91 |
| CFO ÷ Operating Profit | 111% | 14% | -324% | -26% | -158% |
Source: Screener.in consolidated cash flow data for Mangalam Worldwide Limited. FY26 cash flow statement is Not Disclosed by Company as of this writing — it will appear in the FY26 Annual Report ahead of the 30 July 2026 AGM.
Operating Cash Flow vs Net Profit
MWL has reported positive net profit in every one of the last five years and negative operating cash flow in three of them. In FY25 the company reported PAT of ₹30 crore while operating activities consumed ₹87 crore of cash. The CFO-to-operating-profit conversion was minus 158%.
This is not fraud and it is not unusual for a fast-growing steel processor. It is the signature of a business funding rapid revenue expansion through inventory and receivables. But it does mean that the accounting profit has not, so far, become spendable cash.
The FY26 cash flow statement is the single most important document shareholders should read before the AGM. If FY26 operating cash flow turns positive, the growth story strengthens considerably. If it is negative for a fourth year in five, the ₹50 crore profit figure needs re-reading.
Receivables and Inventory vs Revenue
The working capital cycle explains almost all of the cash absorption:
- Debtor days: 12 → 11 → 30 → 44 → 58 (FY21 to FY25)
- Inventory days: 42 → 31 → 46 → 84 → 123
- Cash conversion cycle: 27 → 26 → 67 → 100 → 131 days
- Working capital days: reported to have risen further from 54.9 to 77.9 days in the most recent update
Inventory days have tripled since FY22 while revenue has roughly doubled. Inventory is growing faster than sales. For a stainless steel manufacturer that carries scrap, billets, bars and finished tubes, some build is unavoidable when capacity expands — but a 131-day cash conversion cycle means every rupee of sales growth locks up cash for over four months before it comes back.
How Is This Dividend Actually Being Funded?
Working through the four possibilities honestly:
- Current earnings? Accounting-wise, yes — ₹0.89 crore out of ₹50.14 crore of reported profit is comfortably covered on paper.
- Free cash flow? On the last available full-year data, no. FY25 free cash flow was minus ₹91 crore. A company with negative FCF does not have surplus cash; it distributes from the financing pool.
- Asset sales? No evidence of any. Investing outflows have been capex-related.
- Borrowings? Functionally, this is the honest answer. Financing activities brought in ₹98 crore in FY23 and ₹94 crore in FY25. In April 2026 the company allotted a further ₹50 crore of secured non-convertible debentures maturing April 2029. When operations consume cash and financing supplies it, any distribution is being made out of borrowed and raised funds in substance, whatever the accounting entry says.
The saving grace is scale. ₹0.89 crore against a ₹50 crore profit and a ₹235-crore-plus borrowing book is a rounding error. It does not endanger the balance sheet. But investors should be clear that this dividend is not coming from surplus operating cash, because there has not been any.
Balance Sheet Strength
Key Balance Sheet Metrics
| Net Worth (FY26) | ₹305.48 Crore |
| Book Value Per Share (FV ₹10) | ₹100.91 |
| Book Value Per Share (FV ₹1) | ₹10.09 |
| Debt-to-Equity (FY26) | 0.77 times |
| Implied Borrowings (FY26) | ≈ ₹235 Crore |
| Borrowings FY24 → FY25 | ₹103 Cr → ₹192 Cr |
| NCDs issued April 2026 | ₹50 Crore |
| ROE (FY26) | 17.68% |
| ROCE (FY26) | 15.35% |
| Credit Rating | Upgraded to "A" in FY26 |
| Cash & Cash Equivalents (FY26) | Not Disclosed by Company |
| Net Debt (FY26) | Not Disclosed by Company |
Reading the Balance Sheet Honestly
Genuinely improved: Net worth more than doubled to ₹305.48 crore. ROE improved from 13.40% to 17.68% and ROCE from 11.83% to 15.35%. A credit rating upgrade to "A" is an independent third-party validation that matters more than most investor-presentation slides.
Watch carefully: Total borrowings have gone from ₹103 crore (FY24) to ₹192 crore (FY25) to roughly ₹223 crore by September 2025, with a further ₹50 crore NCD in April 2026. Debt-to-equity edged up from 0.73x to 0.77x even as equity doubled — meaning debt grew at least as fast as the equity base. Interest expense is running near ₹33 crore annually against EBITDA of ₹97.84 crore, so roughly one in three rupees of operating profit goes to lenders.
The company has not published a cash and cash equivalents figure in its results release, so cash coverage of the dividend cannot be computed. We record this as Not Disclosed rather than estimating it.
Coverage Ratios — What We Can and Cannot Compute
| Ratio | Formula | Result |
|---|---|---|
| Dividend Coverage | EPS ₹16.87 ÷ DPS ₹0.30 | 56.2 times |
| Payout Ratio | ₹0.89 Cr ÷ ₹50.14 Cr | 1.78% |
| EBITDA Coverage of Dividend | ₹97.84 Cr ÷ ₹0.89 Cr | 110 times |
| Cash Coverage | Cash & Investments ÷ Outflow | Not Disclosed by Company |
| FCF Coverage | FY26 FCF ÷ Outflow | Not Disclosed by Company (FY25 FCF was negative ₹91 Cr) |
Dividend Sustainability Analysis
The Four Tests
1. Cash position — can the company afford it?
Yes, trivially. ₹0.89 crore is 0.9% of FY26 EBITDA. Even a company consuming operating cash can write this cheque without strain.
2. Is the dividend covered by free cash flow?
On the last published data, no. FY25 FCF was negative ₹91 crore. FY26 FCF is Not Disclosed by Company. On a strict FCF test, this dividend fails.
3. Is debt increasing while dividends are paid?
Yes. Borrowings nearly doubled from ₹103 crore to ₹192 crore between FY24 and FY25, rose to about ₹223 crore by September 2025, and a further ₹50 crore of NCDs was allotted in April 2026 — the same month the dividend was recommended. That said, the ₹0.89 crore outflow is 1.8% of the new NCD issue alone. The debt is funding capacity and working capital, not the dividend.
4. Earnings trend — growing or declining?
Clearly growing. PAT has compounded from ₹17.58 crore (FY24) to ₹50.14 crore (FY26). Three-year compounded profit growth is approximately 70%.
Classification: Sustainable — But Only Because It Is Tiny
ShareBazaar Online classifies this dividend as Sustainable, with an important qualification.
It is sustainable because at 1.78% of profit and 56x earnings coverage, virtually nothing could happen to MWL's business that would make ₹0.89 crore unaffordable. Profit would have to collapse by more than 98% before coverage became an issue.
But sustainability at this level is not a compliment. The dividend is sustainable in the way a ₹100 monthly SIP is sustainable — the amount is too small to be at risk. What is not established is whether MWL can sustain a meaningful dividend. On current cash flow evidence, it cannot, and the board's own behaviour — cutting the payout from 12% to 2% of profit in FY25 — indicates management reached the same conclusion.
Investors should expect token dividends to continue and should not model any material payout increase until operating cash flow turns durably positive.
Peer Comparison
MWL vs Venus Pipes & Tubes — Near-Identical Revenue, Very Different Businesses
| Metric (FY26) | Mangalam Worldwide | Venus Pipes & Tubes |
|---|---|---|
| Revenue (₹ Cr) | 1,207.98 | 1,166.85 |
| PAT (₹ Cr) | 50.14 | 101.96 |
| PAT Margin | 4.13% | 8.74% |
| Final Dividend Per Share | ₹0.30 (3% of FV ₹10) | ₹0.50 (5% of FV ₹10) |
| Dividend Yield | 0.08% | ≈ 0.07% |
| Return on Equity | 17.68% | ≈ 19.25% |
| Debt-to-Equity | 0.77 times | ≈ 0.28 times |
| Promoter Holding | 66.50% | ≈ 48.2% |
Venus Pipes figures compiled from public market data sources (Tickertape, MarketsMojo, Screener) as at July 2026 and are indicative. FY26 dividend for Venus Pipes recommended at its board meeting of 26 May 2026.
What the Comparison Reveals
These two companies sold almost the same rupee value of stainless steel in FY26 — within ₹41 crore of each other. Venus converted it into roughly twice the profit on roughly one-third the leverage.
The structural reason is mix. Venus is a focused pipes-and-tubes specialist operating at a blended EBITDA margin above 16%. MWL is a fully integrated player running from scrap melting upward, which means a large share of revenue sits in lower-margin upstream billets and trading. Integration buys supply security; it costs margin.
The dividend implication is direct: the peer with double the margin and one-third the debt still only pays a 0.07% yield. This is a sector that reinvests, across the board. Neither company is an income stock.
Sector Yield Benchmark
Small and mid-cap Indian stainless steel processors — Venus Pipes, Ratnaveer Precision Engineering, Hi-Tech Pipes, Vibhor Steel Tubes and similar — cluster in the 0.0% to 0.3% dividend yield band, well below the broader Indian materials sector average. Verified FY26 per-company dividend, ROE and cash figures for the remaining peers were not independently confirmed at the time of writing and are therefore not tabulated here rather than being estimated.
Against this backdrop, MWL's 0.08% is unremarkable rather than deficient. It is roughly at peer median. Anyone comparing it to a Coal India or a Vedanta is comparing a growth-phase capital goods supplier to a mature cash-cow — the wrong benchmark entirely.
Promoter Impact Analysis
Who Gets the ₹0.89 Crore
| Promoter & Promoter Group | 66.50% | ₹59.25 Lakh |
| Public Shareholders | 33.49% | ₹29.84 Lakh |
| FII | 0.01% | ≈ ₹89 |
| DII | 0.00% | Nil |
Shareholding pattern as at 31 March 2026 (Screener.in / exchange filings). Amounts computed by ShareBazaar Online.
Distribution Impact
Roughly two-thirds of every dividend rupee flows to the promoter family. For a promoter group taxed at the top slab, ₹59.25 lakh gross becomes roughly ₹41 lakh after tax at 30% plus cess. That is not a meaningful sum relative to a promoter holding worth over ₹700 crore at current prices.
This matters analytically. When a controlling family holds 66.5% and is taxed at slab rates on dividends, the family has a rational incentive to minimise dividends and let value compound inside the company. MWL's payout collapse from 12% to under 2% of profit is entirely consistent with that incentive. It is not evidence of wrongdoing — retaining cash in a capital-hungry business is defensible — but minority shareholders should understand that the person setting the payout policy is also the person who would pay the most tax on a larger payout.
Institutional Absence
FII holding is 0.01% and DII holding is 0.00% as at March 2026. Domestic institutions briefly appeared at 0.36% in December 2025 and exited. The shareholder count has grown from 761 (April 2023) to 1,683 (March 2026) — this is still a predominantly retail and promoter-owned float. The BSE main board listing in May 2026 and the 1:10 split in July 2026 are both clearly aimed at changing that. Investors should watch the September 2026 shareholding pattern to see whether institutional money actually arrives.
Taxation Analysis
How Dividends Are Taxed in India
Since the Finance Act 2020 abolished Dividend Distribution Tax, dividends are taxed entirely in the hands of the shareholder. The company no longer pays tax on your behalf.
- Head of income: Dividend is taxed as "Income from Other Sources".
- Rate: Your applicable slab rate, plus surcharge if applicable, plus 4% Health & Education Cess. A 30% slab taxpayer pays an effective 31.2%.
- TDS under Section 194: The company deducts 10% TDS if total dividend paid to you by that company in a financial year exceeds ₹10,000. (This threshold was raised from ₹5,000 with effect from FY 2025-26.)
- No PAN: TDS jumps to 20%.
- Forms 15G / 15H: Resident individuals with income below the taxable limit can file Form 15G (under 60) or Form 15H (60 and above) with the registrar to avoid TDS.
- TDS is not final tax. It is a credit. You still declare the gross dividend in your return and pay any balance at your slab rate — or claim a refund if over-deducted.
- Deduction allowed: Interest expense incurred to earn the dividend is deductible, capped at 20% of the dividend income. No other expenses are allowed.
- NRIs: TDS at 20% plus applicable surcharge and cess, subject to relief under the applicable Double Taxation Avoidance Agreement.
Worked Example A — Standard Illustration
Investor holds 1,000 shares. Dividend ₹10 per share. Tax slab 30%.
| Gross Dividend (1,000 × ₹10) | ₹10,000 |
| TDS under Sec 194 @10% | ₹0 |
| Tax at slab (30% + 4% cess = 31.2%) | ₹3,120 |
| Net Dividend in Hand | ₹6,880 |
| Effective Yield if bought at ₹300/share | Gross 3.33% / Net 2.29% |
TDS is nil here because ₹10,000 does not exceed the ₹10,000 threshold. At ₹10,001, TDS of ₹1,000 would apply as a credit against the ₹3,120 liability.
Worked Example B — Actual MWL Numbers
Investor holds 10,000 post-split shares (equal to 1,000 pre-split shares). Dividend ₹0.03 per share. Tax slab 30%.
| Investment at ₹36 per share | ₹3,60,000 |
| Gross Dividend (10,000 × ₹0.03) | ₹300 |
| TDS under Sec 194 | ₹0 (below ₹10,000) |
| Tax at 31.2% | ₹93.60 |
| Net Dividend in Hand | ₹206.40 |
| Gross Effective Yield | 0.083% |
| Net Effective Yield | 0.057% |
A ₹3.6 lakh position generates ₹206 of after-tax dividend income per year. To breach the ₹10,000 TDS threshold on this dividend, a shareholder would need over 3.3 lakh post-split shares, worth roughly ₹1.2 crore.
The Practical Tax Point
For virtually every retail shareholder of MWL, no TDS will be deducted on this dividend — but the amount is still taxable and must be reported in the income tax return under Income from Other Sources. Small dividends going undeclared is one of the most common causes of tax notices arising from Annual Information Statement mismatches. Check your AIS. ShareBazaar Online is not a tax adviser; consult a qualified chartered accountant for your specific situation.
Key Risks
1. Persistent Negative Operating Cash Flow
Operating cash flow was negative in three of the last five years, including minus ₹87 crore in FY25 against reported profit of ₹30 crore. Until this reverses, reported profit is a claim on future cash, not present cash. A company that cannot self-fund working capital must keep returning to lenders — and lenders reprice risk.
2. Rising Leverage and Interest Burden
Borrowings have moved from ₹103 crore to roughly ₹235 crore in two years, with a further ₹50 crore NCD at a coupon near 9.75%–10% issued in April 2026. Annual interest of roughly ₹33 crore consumes about a third of EBITDA. In a downcycle, that fixed charge does not shrink with volumes.
3. Working Capital Cycle Lengthening
Inventory days rose from 31 (FY22) to 123 (FY25); debtor days from 11 to 58; cash conversion cycle from 26 to 131 days. Working capital days are reported to have risen further to 77.9. Longer cycles increase exposure to nickel and stainless scrap price swings — inventory bought at high prices and sold into a falling market destroys margin directly.
4. Low Effective Tax Rate Flattering Reported PAT
Effective tax rates have been near zero or negative in multiple recent periods, a point flagged by automated screening tools. If FY27 sees a normalised tax charge of 25%, the same pre-tax profit would deliver materially lower PAT. The 70% PAT growth headline is not fully replicable if the tax line normalises.
5. Q4 Revenue Contraction
Q4 FY26 total income fell 17.89% year-on-year to ₹266.51 crore. One weak quarter is not a trend, but it sits awkwardly beside a 14% full-year growth narrative and needs to be watched in Q1 FY27. A demand air-pocket in stainless long products would show up here first.
6. Commodity and Export Concentration Risk
MWL exports to over 20 countries including the EU, Russia, Brazil and the USA. This exposes it to EU carbon border adjustment mechanisms, anti-dumping actions on Indian stainless products, US tariff policy and currency volatility — none of which the company controls. Nickel price volatility directly moves stainless steel input costs.
7. Thin Institutional Ownership and Liquidity
With 0.01% FII and 0.00% DII holding and roughly 1,683 shareholders, the free float is thin and retail-dominated. Prices in such stocks move sharply on modest volumes in both directions. The stock has risen roughly 133% in twelve months on this thin base.
8. Governance and Key-Person Concentration
A managing director's term was truncated mid-tenure without a stated reason. All three named promoter-directors are from one family. Promoter holding is 66.50%. The statutory auditor is also being replaced at the 30th AGM, with M/s. N. K. Aswani & Co. proposed to succeed M/s. Keyur Shah & Co. Each item is individually routine; together they warrant attention.
What To Monitor
1. FY26 Operating Cash Flow — The Single Most Important Number
Published in the FY26 Annual Report ahead of the 30 July 2026 AGM. Watch whether CFO turns positive after FY25's minus ₹87 crore, and what the CFO-to-EBITDA conversion is. Anything above 50% conversion would be a genuine inflection.
2. Q1 FY27 Revenue — Does the Q4 Decline Continue?
Q4 FY26 revenue fell 17.89% year-on-year. Q1 FY27 results, due around August 2026, will show whether this was a one-off shipment timing issue or the start of a demand slowdown. Compare against the ₹276 crore recorded in Q1 FY26.
3. Effective Tax Rate Normalisation
Track the tax line in each FY27 quarter. A move toward a normalised 25%–26% charge would compress PAT growth sharply even with flat operations. This is the largest single risk to the earnings trajectory that the market appears to be extrapolating.
4. Inventory and Debtor Days
Inventory days at 123 and debtor days at 58 are the mechanical cause of the cash drain. Any reduction of 15–20 days across the cycle would release substantial cash and change the dividend capacity conversation entirely. Watch the FY26 ratio disclosures.
5. Solar Capex Commissioning and Power Cost Impact
A 10.42 MW ground-mounted solar plant at Handod, Vadodara is under implementation on a 25-year lease, taking total captive solar capacity to about 11.6 MW alongside the 1.2 MW Kapadvanj rooftop system. Electricity is a major cost line in induction melting. Watch for a measurable power-cost reduction in EBITDA margin once commissioned.
6. Conversion of Vendor Approvals into Orders
MWL has secured empanelment from QatarEnergy, SABIC, BHEL, EIL and GSFC. Approvals are not orders. Watch for disclosed order wins, and for the share of revenue from value-added products (seamless pipes, bright bars) rising in investor presentations. That mix shift is the credible route to a higher EBITDA margin.
7. Institutional Entry Post-Split and Post-BSE Listing
The BSE main board listing (May 2026) and 1:10 split (July 2026) were both designed to broaden ownership. The September 2026 shareholding pattern is the scorecard. Sustained FII or mutual fund entry would materially change the liquidity profile.
8. AGM Resolution on Debt-to-Equity Conversion
The 30th AGM agenda includes an enabling resolution to convert outstanding loans or debt into equity shares, plus substitution of secured assets for existing listed NCDs. Enabling resolutions are often precautionary, but any actual conversion would dilute existing shareholders. Read the AGM notice in full before voting.
Conclusion
Positives
- PAT up 69.79% to ₹50.14 crore; EBITDA up 62.93% against revenue growth of 13.88% — real operating leverage at the full-year level.
- EBITDA margin expanded 242 basis points to 8.05%, the best in the company's listed history.
- ROE improved to 17.68% and ROCE to 15.35%, both up meaningfully year-on-year.
- Net worth more than doubled to ₹305.48 crore; book value per share up to ₹100.91 (₹10.09 post-split).
- Credit rating upgraded to "A" — independent external validation.
- Clean audit opinions on both standalone and consolidated FY26 results.
- Dual listing achieved (NSE Main Board Sept 2025, BSE Main Board May 2026) plus a 1:10 split — genuine steps toward broadening ownership.
- Dividend coverage of 56.2 times means this specific payout carries essentially zero risk of being missed.
Negatives
- Negative operating cash flow in three of five years, including minus ₹87 crore in FY25 on ₹30 crore of reported profit.
- Free cash flow negative ₹91 crore in FY25; FY26 figure not yet disclosed.
- Dividend payout collapsed from 12% to 1.78% of profit across two years while EPS doubled — a structural policy change, not a one-off.
- Dividend per share is 70% below its FY24 level of ₹1.00.
- Q4 FY26 revenue fell 17.89% year-on-year even as PAT rose 81%.
- Near-zero effective tax rates flatter reported profit growth in a way that is unlikely to persist.
- Borrowings more than doubled to roughly ₹235 crore; interest absorbs about a third of EBITDA.
- Cash conversion cycle at 131 days, up from 26 days in FY22.
- Yield of 0.08% makes this irrelevant as an income holding.
- Cash balances, net debt and FY26 free cash flow are all Not Disclosed by Company in the results release.
The Balanced View
Mangalam Worldwide's FY26 dividend is best understood as a governance signal rather than a cash return. The board has kept the habit of paying alive at the smallest amount that keeps it alive — ₹0.89 crore, or 1.78 paise in every rupee of profit.
The underlying business genuinely improved in FY26: margins expanded, returns on capital rose, the credit rating was upgraded and the company achieved dual main-board listing. Those are not cosmetic achievements. But the improvement has not yet reached the cash flow statement, and the tax line has done real work in producing the headline profit growth. Both facts belong in any honest assessment.
For shareholders, the practical conclusions are narrow and clear. Do not hold this stock for dividend income — ₹3.6 lakh invested returns ₹206 after tax. Do not confuse the ₹0.30 headline with your actual entitlement — post-split, it is ₹0.03 per share. And read the FY26 cash flow statement before the AGM, because that single page will tell you more about whether the FY26 profit was real than every press release combined.
ShareBazaar Online does not issue buy, sell or hold recommendations. The evidence above is presented so you can reach your own conclusion.
Frequently Asked Questions
What dividend has Mangalam Worldwide announced for FY26?
What is the dividend yield on Mangalam Worldwide shares?
What is the record date for the Mangalam Worldwide dividend?
What is the ex-date, and when did I need to buy to qualify?
When will the dividend actually be paid?
Who is eligible to receive this dividend?
How will this dividend be taxed in my hands?
Is this dividend sustainable?
What is Mangalam Worldwide's dividend history?
Why did the dividend get cut so sharply in FY25?
How did the 1:10 stock split affect my dividend entitlement?
How much of the dividend goes to the promoters?
What were Mangalam Worldwide's FY26 financial results?
What else was approved at the 29 April 2026 board meeting?
What should investors monitor from here?
Disclaimer
This article is published by ShareBazaar Online for informational and educational purposes only. It does not constitute investment advice, a research report under SEBI (Research Analysts) Regulations, 2014, or any recommendation to buy, sell or hold any security. ShareBazaar Online does not issue buy, sell or hold ratings.
Figures marked as disclosed are drawn from Mangalam Worldwide Limited's exchange filings dated 29 April 2026 and 26 June 2026 and from its FY26 audited financial results. Market prices, shareholding patterns, cash flow history, peer data and ratio history are sourced from publicly available third-party platforms including NSE, BSE, Screener.in, Trendlyne, ScanX and Tickertape, and were current at the time of writing. All computed figures — dividend outflow, payout ratio, coverage ratios, yields and promoter dividend income — are ShareBazaar Online calculations from those inputs and are clearly labelled as such. Where information was unavailable, we have stated "Not Disclosed by Company" rather than estimating.
Dividend recommendations remain subject to shareholder approval at the Annual General Meeting and may be modified or withdrawn. Market prices, record dates and payment schedules can change. Readers must independently verify all dates and amounts with the company's official exchange filings before acting. Taxation commentary reflects our understanding of Indian income tax law as applicable to FY 2026-27 and is general in nature; consult a qualified chartered accountant regarding your own position.
Investments in securities are subject to market risks. Past performance is not indicative of future results. ShareBazaar Online and its authors accept no liability for any loss arising from reliance on this content. Please read all scheme and offer documents carefully and consult a SEBI-registered investment adviser before making any investment decision.