
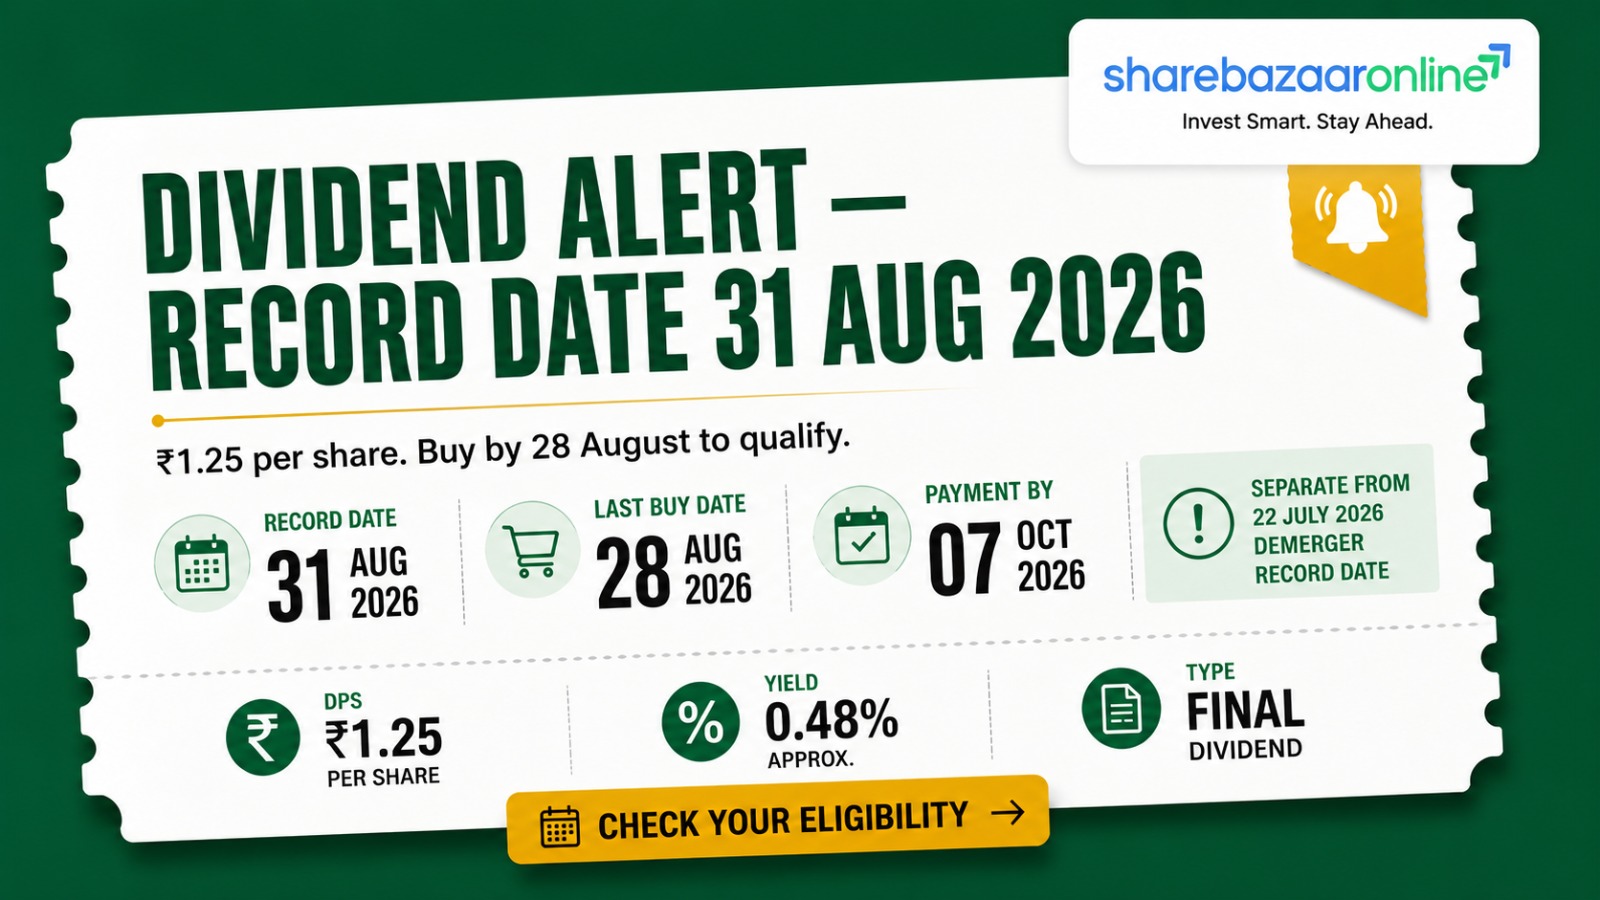
Dividend Snapshot
The Board of Triveni Engineering & Industries Limited (NSE: TRIVENI | BSE: 532356) recommended a final dividend of 125%, that is ₹1.25 per equity share of face value ₹1 each, for the financial year ended 31 March 2026. The recommendation was made at the Board meeting held on 29 May 2026 and is subject to shareholder approval at the 90th Annual General Meeting.
This final dividend comes on top of an interim dividend of 150% (₹1.50 per share) already paid during FY26. That takes the total FY26 dividend to ₹2.75 per share.
Dividend Particulars
| Company | Triveni Engineering & Industries Ltd |
| NSE Symbol | TRIVENI |
| BSE Code | 532356 |
| ISIN | Not Disclosed by Company |
| CIN | L15421UP1932PLC022174 |
| Dividend Type | Final Dividend |
| Dividend Per Share | ₹1.25 |
| Dividend Percentage | 125% |
| Face Value | ₹1 |
| Financial Year | FY 2025-26 |
| AGM Approval | Required (90th AGM) |
Computed Metrics
| Shares Outstanding | 21.89 crore |
| Paid-up Share Capital | ₹21.89 crore |
| Final Dividend Outflow | ₹27.36 crore |
| Full-Year FY26 Outflow | ₹60.20 crore |
| Yield on Announcement Price | 0.33% |
| Yield on Latest CMP | 0.43% |
| FY26 Payout Ratio | 22.40% |
| Dividend Coverage (EPS) | 4.43x |
| Consolidated FY26 PAT | ₹268.71 crore |
| Consolidated FY26 EPS | ₹12.19 |
Headline Finding Investors Should Not Miss
At the standalone level — which is the entity that actually writes the dividend cheque — Triveni generated ₹175.49 crore of operating cash flow in FY26 and spent ₹182.89 crore on capital expenditure. Free cash flow was therefore negative ₹7.40 crore. In the same year the company paid out ₹87.56 crore in dividends and increased net borrowings by roughly ₹179 crore. The dividend is comfortably covered by reported profit, but it was not covered by cash the business generated after capex.
Dividend Announcement Summary
What The Board Actually Approved
The Board of Directors met on 29 May 2026 from 12:00 noon to 3:40 p.m. Four items were decided: audited standalone and consolidated results for Q4 and FY26, the final dividend, the convening of the AGM, and the appointment of a cost auditor for the sugar business.
On the dividend, the exact language used is that the Board recommended a dividend of 125%, i.e. ₹1.25 per fully paid-up equity share of ₹1 face value, for FY ended 31 March 2026, subject to shareholder approval at the ensuing AGM. "Recommended" is not "declared." A final dividend only becomes a legal obligation once shareholders approve it. Until 7 September 2026, this remains a proposal.
FY26 Dividend Build-Up
| Component | ₹/Share | Outflow |
|---|---|---|
| Interim (paid Feb 2026) | ₹1.50 | ₹32.84 cr |
| Final (proposed) | ₹1.25 | ₹27.36 cr |
| Total FY26 | ₹2.75 | ₹60.20 cr |
Outflow computed on 21.89 crore shares (paid-up capital ₹21.89 crore ÷ ₹1 face value). Note that 14,65,048 fresh shares were allotted to erstwhile Sir Shadi Lal Enterprises shareholders and received in-principle listing approval on 24 June 2026, which would lift the final dividend outflow to roughly ₹27.55 crore if those shares are on the register by the record date. Source: exchange filings reported by Groww / ScanX.
Other Board Decisions Same Day
- Audited FY26 results approved with an unmodified audit opinion from S.S. Kothari Mehta & Co. LLP — no qualifications, no adverse remarks.
- An Emphasis of Matter was recorded regarding the amalgamation of Sir Shadi Lal Enterprises Limited. An Emphasis of Matter draws attention to a disclosure; it does not modify the opinion.
- 90th AGM convened for Monday, 7 September 2026 via video conferencing.
- Mr Rishi Mohan Bansal appointed Cost Auditor for the sugar business (including cogeneration and distillery) for FY 2026-27.
Comparability Warning From The Company Itself
Note 3 of the results states plainly that because of the SSEL amalgamation restatement, FY26 figures are not comparable with FY25 on a standalone basis, and on a consolidated basis FY25 includes SSEL only from 21 June 2024. Any growth percentage you read for Triveni's FY26 — including the ones in this article — carries that caveat. Treat single-year growth rates with care.
Key Dates Timeline
| Event | Date | Status |
|---|---|---|
| Board Meeting / Announcement | 29-05-2026 (Friday) | Completed |
| Record Date | 31-08-2026 (Monday) | Fixed by Board |
| Ex-Dividend Date | 31-08-2026 (expected) | Not Disclosed by Company |
| Annual General Meeting | 07-09-2026 (Monday) | Approval event |
| Payment Date | On or before 07-10-2026 | Not Disclosed by Company |
How To Read The Ex-Date
The company has fixed the record date but has not separately notified an ex-date in this filing. Under India's current T+1 settlement cycle, the ex-dividend date normally falls on the same day as the record date. In practice that means you must buy on or before Friday, 28 August 2026 for the trade to settle by Monday 31 August and for your name to appear on the register.
The exchanges publish the confirmed ex-date closer to the event. Always verify on the NSE or BSE corporate actions page before acting.
Why Payment Date Is Not Fixed
The filing states the dividend, if declared at the AGM, shall be paid within thirty days from the date of the AGM, subject to deduction of tax at source. With the AGM on 7 September 2026, the statutory outer limit is 7 October 2026. This matches the company's own history — the FY25 dividend had a 1 September 2025 record date and was paid on 8 October 2025.
Payment history sourced from TipRanks dividend records.
A Separate Corporate Action Sits Between Now And The Record Date
Triveni fixed 22 July 2026 as the record date for the demerger of its Power Transmission Business into Triveni Power Transmission Limited (TPTL), at a ratio of 1 TPTL share (₹2 face value) for every 3 Triveni shares (₹1 face value). The scheme became effective 19 May 2026 with an appointed date of 1 April 2026. This means the Triveni share price you see today is not the same share price that existed when the dividend was announced — the transmission business has been carved out. Every yield calculation below is presented on both bases so you can see the distortion.
Source: company exchange filing dated 11 July 2026, as reported by ChiniMandi, EquityBulls and Business Upturn.
Dividend Yield Analysis
Dividend yield is simply the dividend divided by the share price. It tells you what cash return you earn from holding the stock, ignoring price movement. Because Triveni's share price has moved sharply around a demerger, the honest answer requires three different yield numbers, not one.
Yield Calculations
| Basis | Price | Final ₹1.25 | FY26 ₹2.75 |
|---|---|---|---|
| Announcement close (29-05-2026) | ₹375.80 | 0.33% | 0.73% |
| Cum-demerger close (21-07-2026) | ₹471.50 | 0.27% | 0.58% |
| Ex-demerger CMP (22-07-2026) | ₹289.95 | 0.43% | 0.95% |
Announcement-day close of ₹375.80 (down 1.56% on the day) sourced from MarketsMojo. Cum-demerger previous close ₹471.50 and ex-demerger price ₹289.95 (NSE) / ₹291.20 (BSE) sourced from Kotak Neo, 22 July 2026.
Yield Reality Check
A high or rising yield can come from four very different causes. Here is which one applies:
- Strong dividend growth? Partly. FY26 total of ₹2.75 is up 10% from FY25's ₹2.50 — but still 21% below the ₹3.50 paid across FY24.
- Falling share price? Yes — mechanically. The apparent jump in yield from 0.27% to 0.43% is almost entirely the demerger price adjustment, not the company becoming more generous. Shareholders received TPTL shares in exchange; no value was lost, but the yield optics improved artificially.
- One-time special dividend? No. Both components are ordinary interim and final dividends.
- Weak business? Not on the reported numbers — consolidated PAT rose 12.8% in FY26 — but cash generation is weak relative to profit, which is covered in detail below.
Data Quality Flag
Price feeds for Triveni are currently inconsistent across data providers because of the demerger adjustment. On 13-14 July 2026, several platforms showed ₹471-477. Post-record-date, ₹289.95 is the adjusted figure. If a screener quotes you a dividend yield for Triveni today, check which price base it used. Some sites are quoting a trailing yield above 4%, which is not achievable on the actual ₹2.75 declared for FY26.
Dividend History Analysis
Ten-Year Dividend Record (by Record Date)
| Record Date | Type | ₹/Share | Payment Date |
|---|---|---|---|
| 31-08-2026 | Final (proposed) | 1.25 | By 07-10-2026 |
| 06-02-2026 | Interim | 1.50 | Feb 2026 |
| 01-09-2025 | Final | 2.50 | 08-10-2025 |
| 06-09-2024 | Final | 1.25 | 13-10-2024 |
| 09-02-2024 | Interim | 2.25 | 21-02-2024 |
| 01-09-2023 | Final | 3.25 | 08-10-2023 |
| 17-08-2022 | Final | 2.00 | 23-09-2022 |
| 10-11-2021 | Interim | 1.25 | 25-11-2021 |
| 10-09-2021 | Final | 1.75 | 08-10-2021 |
| FY2021 (Mar-2020 to Feb-2021): no dividend record found | |||
| 20-02-2020 | Final | 1.10 | 11-03-2020 |
| 26-02-2019 | Final | 0.70 | 15-03-2019 |
| FY2018-19 interim period: no dividend record found | |||
| 23-08-2017 | Final | 0.25 | 09-09-2017 |
Historical dividend data compiled from TipRanks dividend records and Choice India; FY26 interim record date cross-checked with Choice India. Face value has been ₹1 throughout the period shown.
Financial-Year Totals
| FY26 | ₹2.75 | +10.0% |
| FY25 | ₹2.50 | −28.6% |
| FY24 | ₹3.50 | +7.7% |
| FY23 | ₹3.25 | +8.3% |
| FY22 | ₹3.00 | +172.7% |
| FY21 | ₹1.10 | +57.1% |
| FY19 | ₹0.70 | — |
| FY17 | ₹0.25 | — |
Totals grouped by the financial year to which the dividend relates. Gaps reflect years where no dividend record was found in the sources consulted.
Classification: Cyclical Payer
Triveni is not a consistent dividend payer in the way an FMCG or IT company is. The record shows:
- Gaps in payment around FY18 and FY21 — the dividend was not maintained through the downcycle.
- A real cut in FY25: from ₹3.50 to ₹2.50, a 28.6% reduction. FY26's ₹2.75 has still not recovered the FY24 level, two years later.
- Strong growth phase FY21-FY24 coinciding with the ethanol blending boom and firm sugar realisations.
- No special dividends declared in the period reviewed.
The pattern maps directly onto the sugar cycle. This is a payout that follows earnings rather than one that is protected through the cycle. Income-focused investors should assume the dividend is variable, not fixed.
Financial Performance Analysis
Consolidated FY26 vs FY25 (₹ Crore)
| Line Item | FY26 | FY25 | Change |
|---|---|---|---|
| Revenue from operations (gross) | 7,620.85 | 6,807.94 | +11.94% |
| Revenue net of excise duty | 6,290.49 | 5,689.24 | +10.57% |
| Other income | 76.18 | 57.64 | +32.16% |
| Employee benefits expense | 475.37 | 438.52 | +8.40% |
| Other expenses | 685.08 | 642.00 | +6.71% |
| Depreciation & amortisation | 144.16 | 126.16 | +14.27% |
| Finance costs | 100.20 | 83.45 | +20.07% |
| Estimated EBITDA | 546.38 | 476.20 | +14.74% |
| PBT before exceptional | 378.20 | 324.23 | +16.65% |
| Exceptional item (Labour Codes) | (14.06) | — | New |
| PAT | 268.71 | 238.26 | +12.78% |
| EPS (₹) | 12.19 | 10.88 | +12.04% |
EBITDA estimated as PBT before exceptional items plus finance costs plus depreciation, less other income. Percentages must be read alongside the company's own comparability caveat in Note 3.
Operating Leverage: Revenue Grew, But Not Everything Followed
Comparing the three growth rates that matter:
- Revenue (net of excise) +10.57%
- EBITDA +14.74%
- PAT +12.78%
EBITDA growing faster than revenue means positive operating leverage — costs did not rise in line with sales. Employee costs grew only 8.4% and other expenses 6.7%, both below revenue growth. That is genuinely good cost control.
But PAT grew slower than EBITDA. Two items ate the difference: finance costs up 20.07% and depreciation up 14.27%, both far ahead of the 10.57% revenue line. The company is paying more to service a larger balance sheet.
Note also that PAT attributable to owners rose only +10.49% (₹268.71 cr vs ₹243.19 cr), because FY25 included a ₹4.93 crore loss attributable to non-controlling interests that no longer exists post-amalgamation.
Segment Performance FY26 (₹ Crore)
| Segment | Revenue | Rev Δ | PBIT | Margin |
|---|---|---|---|---|
| Sugar | 4,476.60 | +12.85% | 271.96 | 6.07% |
| Distillery | 2,882.79 | +11.21% | 119.34 | 4.14% |
| Power Transmission | 339.94 | −8.09% | 120.43 | 35.43% |
| Water | 268.51 | +14.63% | 30.99 | 11.54% |
The distillery is what saved FY26. Its PBIT tripled from ₹39.67 crore to ₹119.34 crore, with margin moving from 1.53% to 4.14%. Sugar, by contrast, grew revenue 12.85% but PBIT only 2.05% — margin compressed from 6.72% to 6.07%. That is classic sugar-cycle margin squeeze: volumes and realisations up, cane cost up faster.
The uncomfortable part: Power Transmission, the segment being demerged away, earned a 35.4% PBIT margin and contributed 22.5% of total segment profit on just 4.2% of revenue. Water margin also fell from 13.99% to 11.54%. The company that remains after the demerger is more concentrated in the lower-margin, more cyclical sugar and ethanol businesses.
Cash Flow Analysis
Reported profit is an accounting opinion. Cash is a fact. This is where a dividend announcement either holds up or falls apart, and it is the section most dividend articles skip entirely.
Consolidated Cash Flow (₹ Crore)
| Item | FY26 | FY25 |
|---|---|---|
| Profit before tax | 364.14 | 324.23 |
| Cash from operations (pre-tax) | 228.69 | (23.71) |
| Income tax paid | (40.77) | (82.66) |
| Net Operating Cash Flow | 187.92 | (106.37) |
| Capex (PPE + intangibles) | (182.89) | (299.57) |
| Free Cash Flow | 5.03 | (405.94) |
| Dividend paid | (87.56) | (27.37) |
| Net short-term borrowings | +212.67 | +416.04 |
| Net long-term borrowings | (34.40) | +95.40 |
Cash Quality Ratios
| OCF ÷ PAT (consolidated) | 0.70x |
| OCF ÷ PAT (standalone) | 0.68x |
| FCF ÷ FY26 dividend paid (consol.) | 0.06x |
| FCF ÷ FY26 dividend paid (standalone) | Negative |
| FCF ÷ final dividend only (₹27.36 cr) | 0.18x |
| Cash + bank ÷ final dividend | 2.57x |
| Cash + bank ÷ total FY26 dividend | 1.17x |
An OCF-to-PAT ratio of 0.70x means the company converted only about 70 paise of every rupee of reported profit into actual operating cash. For a business with heavy seasonal inventory this is not alarming on its own, but it is below the 1.0x benchmark investors normally want to see.
How Is This Dividend Actually Funded?
Working through the four possible sources:
- Current earnings? Yes on an accounting basis. ₹268.71 crore PAT easily covers ₹60.20 crore of declared FY26 dividend.
- Free cash flow? No. Consolidated FCF was ₹5.03 crore against ₹87.56 crore paid. Standalone FCF was negative ₹7.40 crore. The gap is roughly ₹95 crore at the standalone level.
- Cash reserves? Only partially. Consolidated cash and bank balances totalled just ₹70.34 crore at year end — barely more than the ₹87.56 crore paid out during the year.
- Borrowings? Effectively yes. Net borrowings rose approximately ₹179 crore in FY26 (short-term up ₹212.67 crore, long-term down ₹34.40 crore). Consolidated gross debt including leases moved from ₹1,980.04 crore to ₹2,161.01 crore.
The honest characterisation: money is fungible, so no one can say a specific rupee of dividend came from a specific loan. But arithmetically, a company that generates ₹5 crore of free cash, pays ₹88 crore of dividend, and increases net debt by ₹179 crore in the same twelve months is funding shareholder distributions from the balance sheet, not from the cash the operations threw off.
Where The Operating Cash Went
The working capital drags in FY26 (consolidated):
- Inventories absorbed ₹249.45 crore of cash
- Trade payables shrank, absorbing another ₹107.09 crore
- Trade receivables absorbed ₹33.28 crore
Inventory build is intrinsic to sugar — cane is crushed October to April and sugar is sold across twelve months, so closing stock at 31 March is always large. Closing inventory of ₹2,985.99 crore represents 47.5% more than the entire year's PBT-plus-depreciation. The company itself flags in Note 2 that quarterly results vary because of this seasonality.
Receivables vs Revenue — A Positive Signal
When receivables grow faster than revenue, it usually means the company is booking sales it has not been paid for. That is not happening here.
| Revenue growth | +11.94% |
| Current trade receivables growth | +7.63% |
| Total receivables growth (incl. non-current) | +4.27% |
Receivables grew at roughly a third of the rate of revenue. Debtor turnover on a consolidated basis was 11.14x in FY26 versus 11.58x in FY25 — a marginal slippage but broadly stable. Revenue quality is not the problem here. Inventory and capex intensity are.
Balance Sheet Strength
Consolidated Position (₹ Crore)
| Item | FY26 | FY25 |
|---|---|---|
| Total assets | 6,521.19 | 6,242.17 |
| Total equity | 3,342.83 | 3,159.62 |
| Net worth (company-stated) | 3,258.11 | 3,121.14 |
| Non-current borrowings | 321.30 | 397.27 |
| Current borrowings | 1,826.11 | 1,571.76 |
| Lease liabilities | 13.60 | 11.01 |
| Total debt | 2,161.01 | 1,980.04 |
| Cash + bank balances | 70.34 | 54.73 |
| Net debt | 2,090.67 | 1,925.31 |
| Inventories | 2,985.99 | 2,737.81 |
Ratios (Company-Disclosed, Consolidated)
| Ratio | FY26 | FY25 |
|---|---|---|
| Debt-equity ratio | 0.65 | 0.63 |
| Debt service coverage | 2.40 | 1.99 |
| Interest service coverage | 5.12 | 5.37 |
| Current ratio | 1.49 | 1.46 |
| Total debt to total assets | 0.33 | 0.32 |
| Operating margin | 6% | 6% |
| Net profit margin | 4% | 4% |
Returns (ShareBazaar-Computed)
| ROE (on average equity) | 8.26% |
| ROCE (on average capital employed) | 8.73% |
ROE = PAT ÷ average total equity. ROCE = (PBT + finance costs) ÷ average (equity + total debt). Company does not disclose ROE/ROCE in the results filing.
What The Balance Sheet Says About This Dividend
Total debt rose ₹180.97 crore in FY26 while ₹87.56 crore left as dividend. Debt-equity edged up from 0.63 to 0.65, and interest service coverage deteriorated from 5.37x to 5.12x — the only headline ratio moving the wrong way. Finance costs of ₹100.20 crore now consume 21.6% of estimated EBITDA.
Two mitigating points in fairness. First, ₹1,826.11 crore of the borrowing is current, and sugar companies routinely fund seasonal cane payments with short-term working-capital lines that unwind through the year — this is normal industry practice, not distress. Second, debt service coverage improved from 1.99 to 2.40 and the current ratio strengthened to 1.49. Returns of roughly 8-9% on equity and capital employed are modest but not out of line for a capital-intensive agri-processor at this point in the cycle.
Dividend Sustainability Analysis
Four-Factor Test
| Factor | Evidence | Verdict |
|---|---|---|
| Cash position | ₹70.34 cr cash and bank vs ₹27.36 cr final dividend = 2.57x. Thin in absolute terms. | Adequate |
| Free cash flow | Consolidated FCF ₹5.03 cr; standalone FCF negative ₹7.40 cr, vs ₹87.56 cr paid. | Fails |
| Debt position | Total debt +₹180.97 cr; D/E 0.63 → 0.65; interest coverage 5.37x → 5.12x. | Deteriorating |
| Earnings trend | PAT +12.78%, EBITDA +14.74%, distillery PBIT tripled. | Improving |
Coverage Metrics
| Payout ratio — final only | 10.18% |
| Payout ratio — full FY26 | 22.40% |
| Earnings cover — final only | 9.75x |
| Earnings cover — full FY26 | 4.43x |
| Cash cover — final only | 2.57x |
| FCF cover — full FY26 | 0.06x |
This is the tension in one table. On earnings, the dividend is covered nearly ten times over and the payout ratio is a conservative 22%. On cash, it is barely covered at all. Both statements are true simultaneously, and which one matters depends entirely on whether the company's working capital cycle normalises.
Classification: Moderately Sustainable
Triveni's FY26 dividend is classified as Moderately Sustainable — not Sustainable, not Unsustainable.
Why not "Sustainable": a dividend that is 94% uncovered by free cash flow, paid in a year when net debt rose ₹179 crore, in a business with a documented history of cutting payouts (FY25) and skipping them entirely (FY18, FY21), cannot be called secure. The absolute cash balance of ₹70 crore leaves very little cushion.
Why not "Unsustainable": the payout ratio is genuinely low at 22.4%, earnings cover is 4.43x, the distillery segment is inflecting sharply upward, FY25's negative operating cash flow reversed to positive ₹187.92 crore in FY26, and capex has already fallen 39% from ₹299.57 crore to ₹182.89 crore. If capex stays at FY26 levels and the inventory build normalises, FY27 free cash flow could comfortably fund a dividend of this size.
The single variable that decides it: does operating cash flow keep improving, or was FY26 just the swing back from an unusually bad FY25?
Peer Comparison
Sugar & Ethanol Peer Set
| Company | FY26 DPS | Yield | FY26 PAT | P/E |
|---|---|---|---|---|
| Triveni Engineering | ₹2.75 | 0.95% | ₹268.71 cr | 30.97 |
| Balrampur Chini Mills | ₹3.50 (interim) | 0.54% | EPS ₹18.74 | Not stated |
| Dalmia Bharat Sugar | ₹1.50 (final) | Not Disclosed | ₹235.66 cr | 6.90 |
| EID Parry | Not Disclosed | Not Disclosed | Not Disclosed | 11.97 |
| Bannari Amman Sugars | Not Disclosed | Not Disclosed | Not Disclosed | 30.34 |
| Triveni Turbine (group) | ₹2.00 | 0.78% | Not Disclosed | Not stated |
Peer P/E and valuation grades sourced from MarketsMojo (June 2026). Balrampur Chini FY26 revenue ₹6,271 cr, EBITDA ₹741 cr, interim dividend ₹3.50 with total payout ~₹70.68 cr, per Whalesbook. Dalmia Bharat Sugar FY26 consolidated PAT ₹235.66 cr on revenue ₹3,711.76 cr with ₹1.50 final dividend recommended, per Whalesbook. Triveni Turbine dividend data from TipRanks. Yields computed on prices at differing dates and are indicative only.
Return Ratios vs Peer
| Metric | Triveni | Balrampur |
|---|---|---|
| ROE | 8.26% | 9.15% |
| ROCE | 8.73% | 7.72% |
| Dividend yield | 0.95% | 0.54% |
| Payout ratio | 22.40% | Not Disclosed |
Balrampur ROCE 7.72% and ROE 9.15% per MarketsMojo, June 2026.
What The Comparison Shows
- Triveni's 0.95% FY26 yield is the highest in the visible peer set — but remember roughly a third of that apparent advantage comes from the demerger price adjustment, not from a larger dividend.
- Sector yields are uniformly low. Sugar is a capital-hungry, cyclical industry. Nobody in this group is a high-yield income stock. If you are hunting yield, this sector is not where you will find it.
- Triveni's ROE of 8.26% sits marginally below Balrampur's 9.15%, while its ROCE of 8.73% is marginally above Balrampur's 7.72%. The two are broadly comparable operators.
- Triveni trades at a P/E of 30.97 against Dalmia Bharat Sugar's 6.90 and EID Parry's 11.97. That is a very wide gap. Part of it reflected the engineering and transmission businesses inside Triveni — businesses that have now been partly demerged away.
Promoter Impact Analysis
Shareholding Pattern
| Promoter & Promoter Group | 60.98% |
| Domestic Institutions (DII) | 8.20% |
| Foreign Institutions (FII/FPI) | 7.43% |
| Public / Retail & Others | 23.36% |
| Promoter shares pledged | 0% |
Shareholding as reported by Bajaj Finserv and Angel One, July 2026. Zero promoter pledge is a meaningful positive — pledged promoter stock is a common stress signal in mid-cap India.
Dividend Distribution (₹ Crore)
| Recipient | Final ₹1.25 | FY26 ₹2.75 |
|---|---|---|
| Promoter group (60.98%) | 16.68 | 36.71 |
| DII (8.20%) | 2.24 | 4.94 |
| FII (7.43%) | 2.03 | 4.47 |
| Public & retail (23.36%) | 6.39 | 14.06 |
| Total | 27.36 | 60.20 |
Reading The Distribution Honestly
The promoter family will receive approximately ₹16.68 crore from the final dividend and roughly ₹36.71 crore from the full FY26 payout. Minority shareholders — retail, DII and FII combined at 39.02% — share about ₹10.68 crore of the final dividend.
There is nothing improper here. Every shareholder receives the identical ₹1.25 per share, and a 61% promoter receiving 61% of the dividend is arithmetic, not favouritism. But the concentration is worth stating plainly, because it changes the incentive structure. When promoters hold a controlling majority, cash distribution is one of the few routes by which they realise returns without selling stock. The relevant question is not whether promoters benefit — they obviously do — but whether the payout ratio of 22.4% is disciplined. At that level it is. A payout ratio of 60-70% funded by borrowing would be a different conversation.
It also means the swing factor for retail investors is small in absolute terms. A shareholder with 1,000 shares receives ₹1,250 gross from this final dividend. For most retail portfolios, the demerger entitlement and the underlying business trajectory matter far more than the dividend cheque.
Taxation Analysis
How Dividends Are Taxed In India
Since the Finance Act 2020 abolished Dividend Distribution Tax, dividends are taxed in the hands of the shareholder, not the company. The mechanics:
- Slab-rate taxation. Dividend income is added to your total income under "Income from Other Sources" and taxed at your applicable slab rate, plus applicable surcharge and 4% health & education cess.
- TDS under Section 194. The company deducts tax at source at 10% where aggregate dividend from that company in a financial year exceeds the prescribed threshold (raised to ₹10,000 per company per year with effect from FY 2025-26). Below the threshold, no TDS is deducted — but the income remains fully taxable.
- No PAN means higher TDS. If PAN is not furnished or is inoperative, TDS is deducted at 20%.
- Forms 15G / 15H. Resident individuals with no taxable income can file Form 15G (under 60) or Form 15H (60 and above) to avoid TDS.
- Interest deduction. Interest on money borrowed to invest in shares is deductible against dividend income, capped at 20% of the dividend received. No other expense is allowed.
- TDS is not final tax. The 10% deducted is only an advance. You still pay the balance up to your slab rate when filing your return, and you claim the TDS as credit.
- NRIs are subject to TDS at 20% plus surcharge and cess under Section 195, subject to relief under any applicable Double Taxation Avoidance Agreement.
The Triveni filing itself confirms the dividend "shall be paid to the shareholders, subject to deduction of tax at source."
Worked Example — Standard Illustration
Investor holds 1,000 shares, dividend ₹10 per share, tax slab 30%.
| Gross dividend | ₹10,000 |
| TDS @10% (threshold met) | ₹1,000 |
| Credited to bank | ₹9,000 |
| Total tax @30% + 4% cess = 31.2% | ₹3,120 |
| Balance payable at filing | ₹2,120 |
| Net dividend in hand | ₹6,880 |
If the share price were ₹289.95, the ₹10,000 investment base would be 1,000 shares × ₹289.95 = ₹2,89,950. Gross yield 3.45%, effective post-tax yield 2.37%. Tax consumes 31.2% of the yield.
Applied To Triveni's Actual Final Dividend
Investor holds 1,000 shares, dividend ₹1.25 per share, tax slab 30%.
| Gross dividend | ₹1,250 |
| TDS (below ₹10,000 threshold) | ₹0 |
| Credited to bank | ₹1,250 |
| Tax at 31.2% payable at filing | ₹390 |
| Net dividend after tax | ₹860 |
Investment at ₹289.95 = ₹2,89,950. Gross yield 0.43%, effective post-tax yield 0.30%.
Practical takeaway: no TDS will be deducted for the overwhelming majority of retail holders, because you would need to own more than 8,000 shares for the ₹1.25 final dividend alone to cross ₹10,000. But the income is still taxable and must be declared. A holder in the 30% bracket ends up with roughly ₹0.86 per share in real terms.
Note: tax rules change with each Finance Act and individual circumstances vary considerably. ShareBazaar Online is not a tax advisor. Please confirm your position with a qualified chartered accountant before acting.
Key Risks
1. Free Cash Flow Does Not Cover The Dividend
Standalone FCF was negative ₹7.40 crore in FY26 against ₹87.56 crore of dividend paid. If capex re-accelerates toward the FY25 level of ₹299.57 crore while working capital stays heavy, the company faces a straightforward choice between borrowing more or cutting the payout. It has cut before.
2. Sugar Cycle And Regulatory Pricing Risk
Sugar is the largest segment at ₹4,476.60 crore of revenue, and its PBIT margin already compressed from 6.72% to 6.07% in FY26. Cane prices are set administratively via the Fair and Remunerative Price, while sugar selling prices are influenced by government release mechanisms and export policy. The company controls neither its largest input cost nor its output price. A government ban on sugar exports was reported effective 13 May 2026, which directly constrains inventory offtake for the whole industry.
Export ban reference from Whalesbook coverage of Balrampur Chini, June 2026.
3. Ethanol Price Stagnation Against Rising Cane Costs
The distillery segment carried FY26, tripling PBIT to ₹119.34 crore. But ethanol procurement prices for certain routes have reportedly been unchanged for three years while cane FRP has continued to rise. The margin recovery that made FY26 work is therefore squeezed from both ends if the government does not revise ethanol pricing. This is the single largest threat to the FY27 earnings picture.
4. Rising Leverage And Interest Burden
Total debt rose to ₹2,161.01 crore, finance costs jumped 20.07% to ₹100.20 crore — double the revenue growth rate — and interest service coverage fell from 5.37x to 5.12x. Of the debt, ₹1,826.11 crore is current, which means it is repriced or rolled over frequently. Any tightening in credit conditions flows straight to the P&L.
5. Loss Of The Highest-Margin Segment To Demerger
Power Transmission earned a 35.43% PBIT margin and delivered ₹120.43 crore — 22.5% of all segment profit — on only 4.2% of revenue. From FY27 that profit stream sits in TPTL, not Triveni. The remaining company is materially more exposed to sugar and ethanol cyclicality, and its blended margin profile will be lower. The company's own Note 3 confirms the accounting impact lands in FY 2026-27.
6. Labour Codes Liability May Grow
The four New Labour Codes notified 21 November 2025 forced a ₹14.06 crore exceptional charge for past-service employee benefit obligations. Critically, the company states it "continues to monitor the developments in this respect including further clarifications from the State/Central Government and will account for such developments, as required." This liability is not final. A labour-intensive sugar business across multiple states could see further charges.
7. Deferred Tax Swing Distorting The Tax Line
FY26 consolidated tax of ₹95.43 crore comprised only ₹42.87 crore current tax but ₹52.56 crore deferred tax — and deferred tax assets on the balance sheet collapsed from ₹33.29 crore to ₹0.40 crore. In Q4 alone, deferred tax was ₹60.90 crore against current tax of just ₹0.99 crore. Deferred tax reversals are non-cash but they signal that the shelter reducing near-term cash taxes is largely exhausted. Cash tax outflow is likely to rise in FY27.
8. Inventory Concentration And Seasonality
Inventories of ₹2,985.99 crore represent 45.8% of the entire consolidated balance sheet and consumed ₹249.45 crore of cash in FY26. Inventory turnover was just 2.20x. A sharp fall in sugar realisations would force inventory write-downs directly against profit. The company's own Note 2 warns that seasonality makes quarterly results vary.
What To Monitor
1. Quarterly Operating Cash Flow Conversion
The number that decides everything. Watch whether OCF-to-PAT moves above 1.0x from FY26's 0.70x, and whether the H1 FY27 inventory unwind releases cash the way the seasonal cycle should. If FY27 OCF cannot clear roughly ₹270 crore (capex plus dividend), the FY26 pattern repeats.
2. FY27 Capex Guidance
Capex fell 39% from ₹299.57 crore to ₹182.89 crore. Whether that is a deliberate moderation or a pause before the next distillery expansion cycle determines free cash flow entirely. Capital work-in-progress dropped from ₹31.60 crore to ₹13.99 crore, suggesting the current project pipeline is largely complete — but management commentary at the Q1 FY27 call is the place to confirm.
3. Distillery Segment Margin Sustainability
Distillery PBIT margin went from 1.53% to 4.14%. Track whether that holds in Q1 and Q2 FY27. Watch specifically for any government notification revising ethanol procurement prices for the C-heavy, B-heavy and juice routes, and any change in the blending mandate timeline.
4. Sugar Segment Margin Direction
Sugar PBIT margin compressed from 6.72% to 6.07% despite 12.85% revenue growth. Two things to track: the FRP announcement for the 2026-27 crushing season, and whether the export restriction imposed in May 2026 is relaxed. Both feed straight into that margin line.
5. Short-Term Borrowing Levels Through The Season
Current borrowings of ₹1,826.11 crore should compress meaningfully by Q2 FY27 as inventory converts to cash. If they do not — if the debt is structural rather than seasonal — then debt-equity keeps climbing past 0.65 and interest coverage keeps falling. This is the cleanest single test of whether the leverage is benign.
6. TPTL Listing And Residual Triveni Re-rating
TPTL listing is expected by August 2026, with a reported order book of ₹467 crore as at 31 March 2026. Once both entities trade separately, the market will price the residual sugar-and-ethanol Triveni on its own merits. That may not support a P/E near 31. Watch the first month of separate trading closely.
TPTL order book and listing timeline per Sahi.com, July 2026.
7. Cash Tax Rate In FY27
With deferred tax assets down to ₹0.40 crore from ₹33.29 crore, the effective cash tax rate should rise. Actual income tax paid in FY26 was ₹40.77 crore against a P&L charge of ₹95.43 crore. As that gap narrows, cash available for dividends shrinks even if reported PAT holds.
8. Further Labour Code Provisioning
The company has explicitly reserved the right to account for further developments. Watch the Q1 and Q2 FY27 exceptional items line for any top-up beyond the initial ₹14.06 crore, and watch for state-level notifications clarifying the wage definition, which is the main driver of gratuity and provident fund recalculation.
Conclusion
Positives
- Consolidated PAT up 12.78% to ₹268.71 crore; EPS up to ₹12.19.
- Payout ratio a conservative 22.40%; earnings cover 4.43x.
- Operating cash flow swung from negative ₹106.37 crore to positive ₹187.92 crore.
- Distillery PBIT tripled to ₹119.34 crore; margin 1.53% → 4.14%.
- Capex reduced 39% to ₹182.89 crore, easing the cash burden.
- Positive operating leverage: EBITDA +14.74% on revenue +10.57%.
- Receivables grew slower than revenue — clean revenue quality.
- Unmodified audit opinion; zero promoter pledge.
- Debt service coverage improved 1.99 → 2.40; current ratio 1.46 → 1.49.
Negatives
- Standalone free cash flow negative ₹7.40 crore against ₹87.56 crore dividend paid.
- Net debt up roughly ₹179 crore in the same year.
- Interest service coverage fell 5.37x → 5.12x; finance costs +20.07%.
- Sugar PBIT margin compressed 6.72% → 6.07% despite revenue growth.
- Water segment margin fell 13.99% → 11.54%.
- Highest-margin segment (35.43% PBIT) demerged out from FY27.
- OCF-to-PAT conversion only 0.70x.
- Deferred tax assets nearly exhausted — cash taxes likely to rise.
- Dividend history shows a 28.6% cut in FY25 and gaps in FY18 and FY21.
- FY26 total of ₹2.75 remains 21% below FY24's ₹3.50.
The Balanced View
Triveni's FY26 final dividend of ₹1.25 is small, safe on an earnings basis, and largely irrelevant to the investment case in absolute rupee terms. A 1,000-share holder receives ₹1,250 before tax. Meanwhile the same holder is receiving 333 shares of a newly listed transmission company. The demerger, not the dividend, is the story this quarter.
Where the dividend does tell you something is about capital discipline. A company producing barely positive free cash flow, increasing borrowings, and simultaneously distributing ₹87.56 crore is making a deliberate choice to prioritise shareholder distribution over deleveraging. At a 22% payout ratio that choice is defensible. It would stop being defensible if the sugar cycle turns and the payout ratio is maintained regardless.
For income-focused investors, a 0.43% yield on the final dividend — 0.30% after tax at the highest slab — does not compete with a fixed deposit, a debt fund, or almost any dividend-yield strategy. For investors already holding Triveni for its business, this is a modest bonus and a reasonable signal of board confidence, nothing more.
The evidence is laid out above. The decision is yours.
Capital Allocation — What Else Could The Board Have Done?
The ₹27.36 crore final dividend is a real choice among alternatives. Quantifying each:
- Debt reduction: ₹27.36 crore against ₹2,161.01 crore of total debt would cut leverage by 1.27% and save roughly ₹2.3 crore a year in interest at the implied ~8.5% cost of borrowing. Meaningful but not transformative. Applying the full ₹60.20 crore FY26 payout would save ~₹5.1 crore annually.
- Additional capex: ₹60.20 crore would represent a 32.9% increase on FY26's ₹182.89 crore capital spend. In a distillery segment whose PBIT tripled, redeploying into capacity has an arguable case.
- Buyback: at ₹289.95, ₹60.20 crore would retire roughly 20.8 lakh shares, under 1% of equity. With promoter holding already at 60.98%, a buyback would push it closer to regulatory ceilings. Not a practical route here.
- Retaining cash: arguably the strongest case. Consolidated cash of ₹70.34 crore against ₹2,161.01 crore of debt is a thin buffer for a company whose input costs are administratively set.
The board chose distribution. At 22.4% payout that is a defensible middle path — it maintains a dividend record while retaining more than three-quarters of earnings. Readers can judge whether they would have preferred the balance sheet strengthened instead.
Frequently Asked Questions
What dividend has Triveni Engineering announced for FY26?
What is the dividend yield on Triveni Engineering?
What is the record date for the Triveni dividend?
What is the ex-dividend date and by when must I buy?
When will the Triveni dividend be credited to my account?
Who is eligible to receive this dividend?
How is this dividend taxed and will TDS be deducted?
Is the Triveni dividend sustainable?
What is Triveni Engineering's dividend history?
What should investors monitor from here?
How much will the total dividend cost the company?
Does the power transmission demerger affect my dividend entitlement?
Why did Triveni's profit rise but its cash flow stay weak?
What was the ₹14.06 crore exceptional item?
How does Triveni's dividend compare with sugar sector peers?
Disclaimer
This article is published by ShareBazaar Online for informational and educational purposes only. It does not constitute investment advice, a research report under SEBI (Research Analysts) Regulations, 2014, or a recommendation to buy, sell or hold any security. ShareBazaar Online is not a SEBI-registered investment advisor or research analyst.
Figures relating to the dividend, financial results, balance sheet, cash flows, segment performance and corporate actions are taken from Triveni Engineering & Industries Limited's own filings with BSE Limited and the National Stock Exchange of India Limited dated 29 May 2026 and 11 July 2026. Market prices, shareholding data, historical dividend records and peer figures are sourced from third-party financial data providers as cited inline; these have not been independently verified and may contain errors or be out of date. Share prices around the demerger record date are subject to adjustment and providers may report them inconsistently.
Ratios described as ShareBazaar-computed have been calculated by us from the company's reported figures using the formulae stated. Different methodologies will produce different results. Where information was unavailable, we have stated "Not Disclosed by Company" rather than estimating.
The final dividend is a recommendation only and is subject to shareholder approval at the Annual General Meeting scheduled for 7 September 2026. It may be modified or not approved. Record dates, ex-dates and payment dates are subject to change by the company or the exchanges.
Investments in securities markets are subject to market risks. Past dividend payments are not indicative of future dividends, and past performance does not guarantee future results. Tax treatment depends on individual circumstances and prevailing law, both of which may change. Readers should consult a SEBI-registered investment advisor and a qualified chartered accountant before making any investment or tax decision.
ShareBazaar Online and its authors accept no liability for any loss arising from the use of this information.