
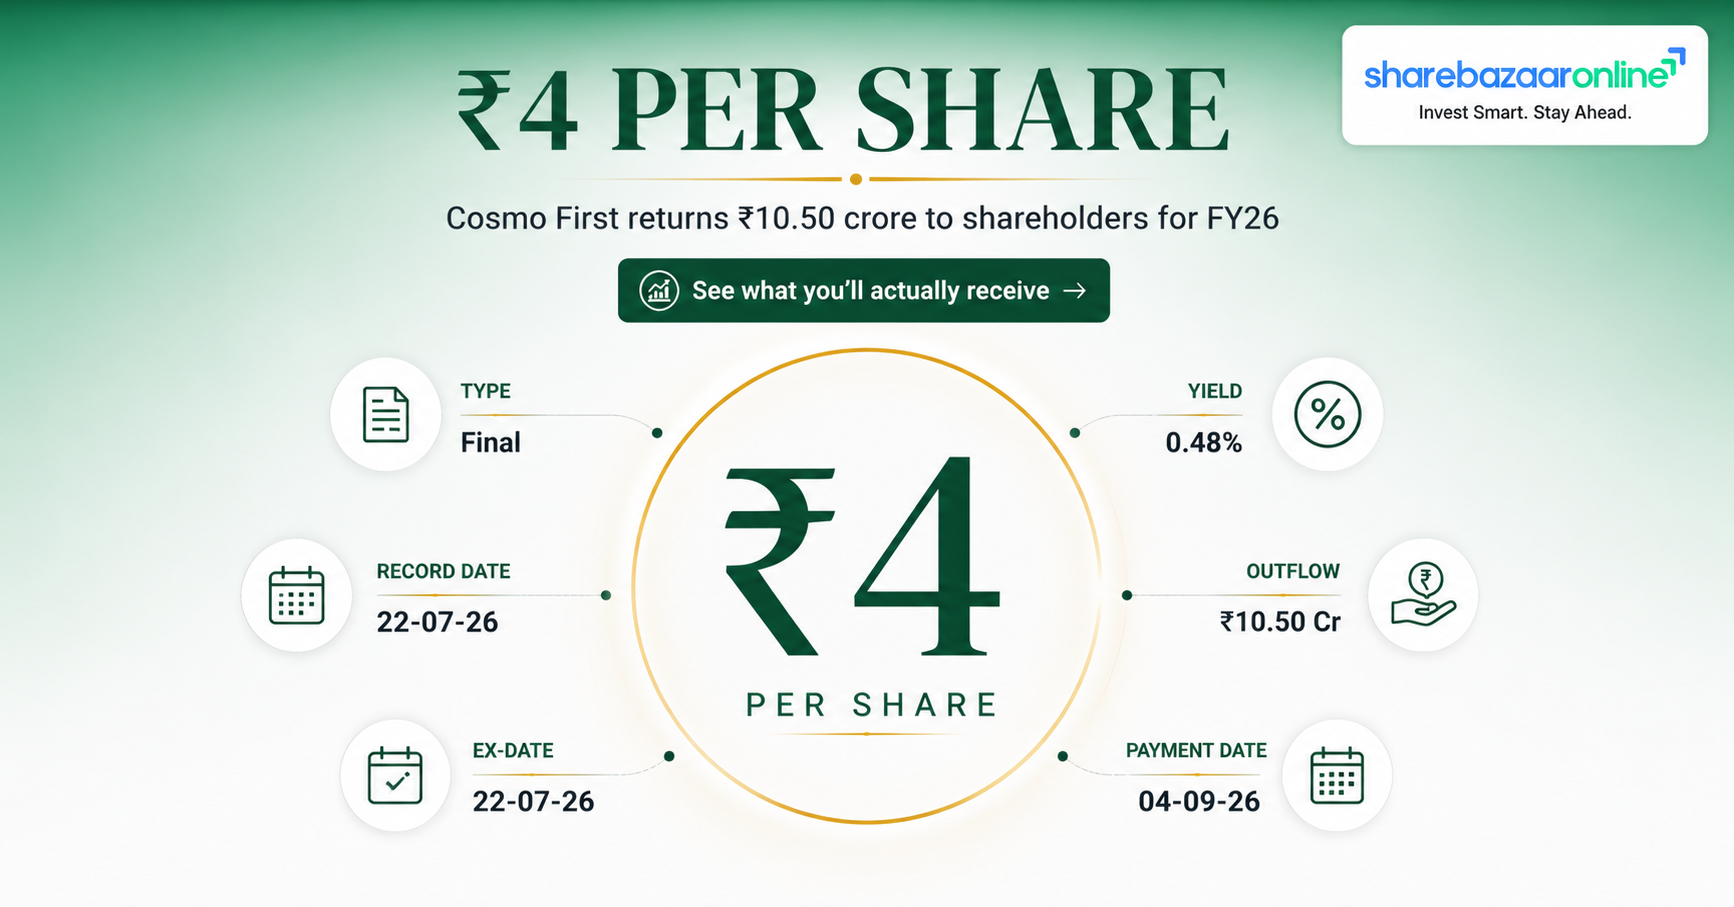
Dividend Snapshot
Cosmo First Limited has recommended a final dividend of ₹4 per equity share for FY 2025-26. On a face value of ₹10, that works out to a dividend rate of 40%. The Board approved it on 20 May 2026, and the company has fixed 22 July 2026 as the record date. Actual payment happens only after shareholders approve it at the 49th AGM.
Company & Security Details
| Company Name | Cosmo First Limited |
| NSE Symbol | COSMOFIRST |
| BSE Code | 508814 |
| ISIN | INE757A01017 |
| CIN | L92114DL1976PLC008355 |
| Face Value | ₹10 |
| Chairman | Ashok Jaipuria |
Dividend Details
| Dividend Type | Final Dividend |
| Dividend Per Share | ₹4.00 |
| Dividend Rate | 40% |
| Financial Year | FY 2025-26 |
| Total Outflow (computed) | ₹10.50 Crore |
| Shares Outstanding (computed) | 2.625 Crore |
| AGM Approval Required | Yes |
The Three Numbers That Matter
- Dividend yield of roughly 0.48% — among the lowest in the packaging films peer set.
- Payout ratio of just 6.73% of consolidated profit. Over 93 paise of every profit rupee stays inside the company.
- Free cash flow for FY26 was negative ₹15.35 Crore. The dividend is not being funded by surplus cash generation — it is being funded from the balance sheet.
What Was Not Disclosed
The 20 May 2026 board outcome filing did not state the record date, ex-date or payment date. Those were confirmed in a later company intimation. Total dividend outflow, dividend yield and payout ratio were also Not Disclosed by Company — every such figure in this report has been computed by ShareBazaar Online from the audited results.
Dividend Announcement Summary
The Board of Directors of Cosmo First met on 20 May 2026 from 2:30 PM to 5:45 PM. Three items were approved. First, the audited financial results for the quarter and year ended 31 March 2026. Second, the recommendation of a final dividend of 40%, or ₹4 per equity share, for FY 2025-26. Third, the reappointment of Mr. Arjun Singh as a Non-Executive Independent Director for a second five-year term from 27 October 2026.
The filing states plainly that the dividend "shall be paid within 30 days from the conclusion of the ensuing Annual General Meeting." The statutory auditors, S N Dhawan & CO LLP, issued an unmodified opinion on both standalone and consolidated results — meaning no qualifications, no reservations, no emphasis of matter. That is a clean audit.
Board Recommendation — Exact Wording
The Board "recommended" the dividend. It did not "declare" it. This distinction is legally meaningful. A final dividend recommended by the Board is only a proposal until members approve it by ordinary resolution at the AGM. Until 5 August 2026, no shareholder has an enforceable claim to this ₹4.
Management Commentary
The board outcome letter carries no management commentary on the rationale for the dividend, no capital allocation statement, and no forward dividend policy guidance. On this specific announcement, management rationale is Not Disclosed by Company.
What Retail Investors Should Read Into This
A 40% dividend sounds large. It is not. "40%" is calculated on the ₹10 face value, not on the market price. At a market price near ₹829, that ₹4 is worth less than half a percent of what you pay for the share. Face-value percentages are one of the most commonly misread numbers in Indian corporate announcements, and headlines built around them are misleading almost by construction.
Key Dates Timeline
| Event | Date | What It Means |
|---|---|---|
| Board Meeting / Announcement | 20-05-2026 | Dividend recommended by the Board |
| Record Date | 22-07-2026 | Registers checked; holders on this date are eligible |
| Ex-Dividend Date | 22-07-2026 | Buy on or after this day and you do not get the dividend |
| Last Cum-Dividend Trading Day | 21-07-2026 | Last day to buy and still qualify |
| Tax Document Deadline | 24-07-2026 | Last date to submit PAN, TRC, Form 15G/15H to the RTA |
| 49th AGM | 05-08-2026 | Shareholders approve the dividend (held via video conferencing) |
| Payment Date | On or before 04-09-2026 | Credit to bank accounts |
Why Ex-Date and Record Date Are the Same Day
Indian exchanges settle trades on a T+1 basis. A share bought on Monday lands in your demat account on Tuesday. So to appear on the register on the record date of 22 July, your purchase must be executed by 21 July 2026. Under T+1, the ex-date and record date coincide. Under the older T+2 system they were one day apart — a lot of stale internet guidance still assumes the old gap.
The Gap Nobody Talks About
There are roughly 107 days between the announcement on 20 May and the outer payment limit of 4 September. Your ₹4 sits with the company for over three months before it reaches you. On ₹10.50 Crore of total outflow, that float has real value to the company and none to you. This is standard for Indian final dividends, but it is worth understanding rather than ignoring.
Dividend Yield Analysis
Yield on Announcement Date
Cosmo First traded around ₹798 on 20 May 2026, the announcement day (source: market data aggregators; NSE closing print may vary marginally).
₹4 ÷ ₹798 × 100 = 0.50%
Yield at Latest Market Price
The most recent verified price is ₹829.40 as on 10 July 2026, at a market capitalisation of ₹2,181.70 Crore (source: Bajaj Broking market data).
₹4 ÷ ₹829.40 × 100 = 0.48%
Yield Reality Check — Why Is It This Low?
A dividend yield can look high or low for four very different reasons. It is worth naming which one applies here, because they carry opposite investment meanings.
- Is it a strong dividend? No. ₹4 per share is unchanged from FY25 despite consolidated profit rising 16.95% to ₹155.98 Crore. Profits grew; the dividend did not.
- Is it a falling share price inflating yield? No — the opposite. The stock is roughly 36% below its 52-week high of ₹1,307.20, which would normally raise yield. It has not, because the payout is simply too small for price moves to matter much.
- Is it a one-time special dividend? No. This is a routine annual final dividend, the fourth consecutive one at the ₹3-₹5 range.
- Is it weak business performance? Not on the top line. Revenue rose 25.68%. The low yield is a deliberate capital allocation choice: Cosmo First is in a heavy capital expenditure phase and is retaining cash to fund it.
The honest conclusion: the yield is low because management has chosen growth capex and debt servicing over shareholder distribution. That is a defensible choice. It also means this stock does not function as an income instrument in any practical sense.
Yield in Perspective
| Cosmo First dividend yield | ≈ 0.48% |
| Indian market bottom-quartile yield | ≈ 0.31% |
| Indian market top-quartile yield | ≈ 1.50% |
| Chemicals industry average yield | ≈ 0.80% |
Market and industry yield benchmarks sourced from Simply Wall St screening data. Cosmo First sits closer to the bottom quartile of Indian dividend payers than to the market average.
Dividend History Analysis
Ten-Year Dividend Record
| Ex-Date | Dividend Per Share | Context |
|---|---|---|
| 22-Jul-2026 | ₹4.00 | Current announcement |
| 28-Jul-2025 | ₹4.00 | Flat year-on-year |
| 26-Jul-2024 | ₹3.00 | Cycle trough |
| 28-Jul-2023 | ₹5.00 | Post-boom normalisation |
| 02-Feb-2022 | ₹6.67* | BOPP super-cycle interim |
| 27-Sep-2021 | ₹16.67* | BOPP super-cycle peak |
| 05-Feb-2021 | ₹16.67* | BOPP super-cycle peak |
| 20-Feb-2020 | ₹10.00* | Interim, semi-annual pattern |
| 18-Jul-2019 | ₹4.00* | Pre-boom baseline |
| 26-Jul-2018 | ₹4.00* | Pre-boom baseline |
| 27-Jul-2017 | ₹6.67* | Pre-boom baseline |
*Historical dividend data sourced from TipRanks. Figures marked with an asterisk appear to be adjusted for the company's subsequent bonus issue (share count moved from approximately 1.75 crore to 2.625 crore). Readers reconciling these against the company's own annual reports should expect the pre-bonus reported figures to be roughly 1.5 times higher. ShareBazaar Online recommends verifying pre-FY2023 figures directly against the relevant annual report.
Classification: Cyclical Payer
Cosmo First is not a consistent payer and it is not an irregular payer. It is a textbook cyclical payer. Dividends have never been suspended in the last decade — that is genuinely to the company's credit. But the amount tracks the BOPP film pricing cycle almost mechanically. During the 2020-22 super-cycle, when BOPP spreads exploded, payouts spiked to bonus-adjusted levels of ₹16.67. When spreads normalised, the dividend fell to ₹3.
The Cut That Already Happened
There has been no suspension, but there has been a very large de facto cut. From a bonus-adjusted FY22 total of roughly ₹23.34 across two interims, the payout fell to ₹3.00 in FY24 — a decline of about 87% in two years. Anyone who bought Cosmo First in 2021 on the strength of its then-yield learned an expensive lesson about commodity-linked dividends.
Growth Trend: Flat, Not Growing
Set aside the super-cycle years and look at the base rate. FY18: ₹4. FY19: ₹4. FY25: ₹4. FY26: ₹4. Across eight years the baseline dividend has not moved at all in nominal terms — and after inflation, ₹4 in 2026 buys substantially less than ₹4 did in 2018. Meanwhile consolidated revenue grew from a fraction of today's ₹3,638.72 Crore. Shareholders have not participated in the company's growth through the dividend line. Whether they have participated through the share price is a separate question, and the stock's 36% drawdown from its 52-week high suggests the answer is currently unflattering.
Financial Performance Analysis
Consolidated FY26 vs FY25 (₹ Crore)
| Particulars | FY26 | FY25 | Change |
|---|---|---|---|
| Revenue from Operations | 3,638.72 | 2,895.10 | +25.68% |
| Other Income | 102.28 | 74.47 | +37.34% |
| EBITDA (computed, pre-exceptional) | 383.55 | 287.88 | +33.23% |
| Depreciation & Amortisation | 137.11 | 99.70 | +37.52% |
| Finance Costs | 141.00 | 99.51 | +41.69% |
| Profit Before Exceptional & Tax | 207.72 | 163.14 | +27.33% |
| Exceptional Item | (7.20) | — | New |
| Profit Before Tax | 200.52 | 163.14 | +22.91% |
| Net Profit | 155.98 | 133.37 | +16.95% |
| Basic EPS (₹) | 60.31 | 51.46 | +17.20% |
Operating Leverage Analysis — The Growth Ladder Is Upside Down
In a healthy operating-leverage story, each line down the income statement grows faster than the one above it. At Cosmo First, the opposite happens after the EBITDA line:
- Revenue: +25.68%
- EBITDA: +33.23% — genuinely good, margin expanded from 9.94% to 10.54%
- PBT (pre-exceptional): +27.33% — leverage starts leaking
- PAT: +16.95% — leverage fully reversed
Where the ₹16 percentage points went. Two lines explain almost all of it. Finance costs rose 41.69% to ₹141.00 Crore, and depreciation rose 37.52% to ₹137.11 Crore. Together these two lines consumed an additional ₹78.90 Crore in FY26 versus FY25 — that is more than the entire ₹22.61 Crore increase in net profit. Cosmo First's operations improved considerably; the cost of the capital used to fund that improvement improved faster.
This is the signature of a company mid-way through a large capacity build. New plants get depreciated and their funding gets interest-charged from day one, but they take time to run at design utilisation. The depreciation and interest arrive before the full profit does.
Margin Trajectory
| EBITDA Margin FY26 | 10.54% |
| EBITDA Margin FY25 | 9.94% |
| Net Profit Margin FY26 | 4.29% |
| Net Profit Margin FY25 | 4.61% |
Operating margin improved by 60 basis points. Net margin contracted by 32 basis points. Both statements are true simultaneously, and which one a headline chooses tells you a lot about the headline.
Cost Line Breakdown (FY26 vs FY25)
| Cost of Materials | +26.63% |
| Employee Benefits | +29.91% |
| Other Expenses | +19.27% |
| Finance Costs | +41.69% |
| Depreciation | +37.52% |
Raw material cost grew almost exactly in line with revenue — no meaningful input inflation squeeze. Other expenses grew slower than revenue, which is genuine cost discipline. The pressure is purely below the operating line.
Two Items That Distort the Comparison
1. The Netherlands fraud provision — ₹7.20 Crore. The company disclosed an exceptional item representing the ultimate loss, net of insurance and legal recovery, from fraudulent transfers out of its Netherlands subsidiary's bank account in 2023. This is a governance and internal-controls event that has now taken three years to fully crystallise into the P&L.
2. New Labour Codes — ₹4.04 Crore. Employee benefits expense includes a one-time increase in past-period employee benefit liability under the New Labour Codes effective 21 November 2025. Management explicitly states rules are still being notified and further impact "will be further evaluated." This is an open-ended future liability that has not been fully quantified.
Segment Performance — Where the Money Actually Comes From
| Segment | FY26 Revenue (₹ Cr) | FY26 Result (₹ Cr) |
|---|---|---|
| Packaging Films | 3,439.21 | 417.83 |
| Speciality Chemicals | 204.14 | 50.72 |
| Petcare | 54.75 | (42.18) |
| Others | 115.02 | (32.30) |
This table deserves careful reading. Packaging Films and Speciality Chemicals together produced ₹468.55 Crore of segment profit. Petcare and Others burned ₹74.48 Crore — wiping out 15.9% of the profitable segments' contribution. Petcare alone lost ₹42.18 Crore on ₹54.75 Crore of revenue, a loss ratio of 77 paise per rupee of sales, and its loss widened from ₹34.67 Crore in FY25.
Put differently: the FY26 losses in Petcare and Others were roughly seven times the entire ₹10.50 Crore dividend outflow. Shareholders funding this diversification are receiving a 0.48% yield while the diversification consumes multiples of it annually.
Cash Flow Analysis
Reported profit is an accounting judgement. Cash is not. This section is where most dividend reports stop and where the actual answer lives.
Consolidated Cash Flow Summary (₹ Crore)
| Particulars | FY26 | FY25 |
|---|---|---|
| Profit Before Tax | 200.52 | 163.14 |
| Operating profit before working capital changes | 380.34 | 280.37 |
| Net Cash from Operating Activities | 396.73 | 166.37 |
| Capital Expenditure | (412.08) | (502.03) |
| Free Cash Flow (computed) | (15.35) | (335.66) |
| Net Cash used in Investing | (360.81) | (419.64) |
| Net Cash from/(used in) Financing | (3.14) | 247.44 |
| Interest Paid | (137.06) | (90.98) |
| Dividend Paid | (10.33) | (7.77) |
Finding 1: Free Cash Flow Is Negative
Operating cash flow of ₹396.73 Crore is impressive on its face — it more than doubled from ₹166.37 Crore, and comfortably exceeds net profit of ₹155.98 Crore. But capital expenditure was ₹412.08 Crore. After capex, free cash flow was negative ₹15.35 Crore.
This is the single most important number in this report. FCF coverage of the dividend is negative. There is no ratio to quote because there is no positive free cash flow to divide by. The ₹10.50 Crore dividend is not funded by cash the business generated after reinvestment — it is funded from existing cash balances and, at the margin, from borrowings.
Context matters here and cuts both ways. FY25 FCF was negative ₹335.66 Crore — dramatically worse. The trajectory is sharply positive. Cosmo First is close to crossing into free-cash-positive territory, and one more year of similar operating improvement without a fresh capex wave should get it there.
Finding 2: The Operating Cash Flow Has a Payables Problem
The jump in operating cash flow from ₹166.37 Crore to ₹396.73 Crore deserves scrutiny, because a very large share of it came from one working capital line. Trade payables contributed an inflow of ₹204.48 Crore in FY26, against just ₹32.96 Crore in FY25.
Strip that single line out and operating cash flow falls to roughly ₹192 Crore — still an improvement on FY25, but a far less dramatic one. Consolidated trade payables on the balance sheet rose from ₹718.89 Crore to ₹905.42 Crore, up 25.95%, essentially in line with the 25.68% revenue growth. So this is not obviously abusive supplier stretching. But it does mean roughly half of the operating cash flow improvement is supplier financing rather than operational cash generation, and supplier financing cannot be repeated indefinitely.
Finding 3: ₹57.20 Crore of Profit Never Touched the Bank
Look at the non-cash adjustments the company itself makes when reconciling profit to cash. The largest is unrealised sales tax incentives of ₹57.20 Crore, added back because it is income recognised in the P&L that has not yet been received in cash. That is roughly 37% of the entire ₹155.98 Crore consolidated net profit.
Add the other non-cash income items — gain on investments at fair value ₹27.11 Crore, grant income on export promotion capital goods ₹5.02 Crore, unrealised exchange gain ₹4.61 Crore, liabilities written back ₹1.98 Crore, unrealised claims recoverable ₹2.64 Crore — and roughly ₹98.56 Crore of pre-tax profit is non-cash or non-operating in character.
Highlighting this prominently, as promised: the headline PAT growth of 16.95% is real under accounting standards, but a substantial part of the profit base is accrual-driven. Sales tax incentives are typically state-government industrial promotion entitlements that convert to cash over long horizons. They are legitimate. They are also not money you can pay a dividend with today.
Finding 4: Receivables Growth vs Revenue Growth
| Revenue growth (consolidated) | +25.68% |
| Trade receivables growth (₹312.95 Cr → ₹397.77 Cr) | +27.11% |
| Inventory growth (₹604.07 Cr → ₹710.38 Cr) | +17.60% |
| Net impairment losses on receivables | ₹5.60 Cr (from ₹2.73 Cr) |
Implication: receivables grew only 143 basis points faster than revenue. That is a broadly clean result and does not suggest channel stuffing or aggressive revenue recognition. Days sales outstanding stayed roughly flat at around 40 days. Inventory grew notably slower than revenue, which is a positive signal on demand absorption. The one caution flag is that impairment losses on receivables more than doubled to ₹5.60 Crore — small in absolute terms, but worth watching for a second consecutive increase.
So How Is This Dividend Actually Being Funded?
Working through the four possibilities:
- Current earnings? Partially. Accounting earnings of ₹155.98 Crore cover ₹10.50 Crore fifteen times over. But a third of those earnings are non-cash.
- Cash reserves? Yes, primarily. Consolidated cash, bank balances and current investments total ₹426.86 Crore, and cash and cash equivalents alone rose from ₹18.92 Crore to ₹51.70 Crore over the year.
- Asset sales? Marginally. Proceeds from disposal of property, plant and equipment were only ₹7.56 Crore.
- Borrowings? Indirectly, yes. With FCF negative, gross borrowings rose from ₹1,357.35 Crore to ₹1,586.03 Crore. When a company is cash-flow negative after capex and simultaneously increasing debt, any distribution is being made possible by that borrowing at the margin.
Honest verdict: the dividend is funded from a strong liquidity buffer, not from surplus operating cash. At ₹10.50 Crore against ₹426.86 Crore of liquid resources, this is a rounding error the company can trivially afford. The point is not that the dividend is at risk. The point is that it is small enough not to matter — and that is precisely why it is affordable.
Balance Sheet Strength
Liquidity Position (Consolidated, ₹ Crore)
| Cash & Cash Equivalents | 51.70 |
| Other Bank Balances | 7.13 |
| Current Investments | 368.03 |
| Total Liquid Resources | 426.86 |
| Non-Current Investments | 26.04 |
Debt Position (Consolidated, ₹ Crore)
| Non-Current Borrowings | 1,185.55 |
| Current Borrowings | 400.48 |
| Gross Debt | 1,586.03 |
| Lease Liabilities | 94.35 |
| Net Debt (computed) | 1,159.17 |
| Total Equity | 1,616.62 |
Debt Is Rising While Dividends Are Being Paid
This is a specific test worth applying to any dividend announcement. Here are the numbers:
| Metric | FY26 | FY25 | Change |
|---|---|---|---|
| Gross Debt (₹ Cr) | 1,586.03 | 1,357.35 | +16.85% |
| Net Debt (₹ Cr) | 1,159.17 | 966.50 | +19.93% |
| Debt / Equity | 0.98x | 0.93x | Worse |
| Net Debt / EBITDA (computed) | 3.02x | 3.36x | Better |
| Interest Coverage (EBIT/Interest) | 2.47x | 2.64x | Worse |
Reading it fairly: absolute debt rose by ₹228.68 Crore. Debt-to-equity crossed above 1:1 on a gross basis. Interest coverage at 2.47 times is adequate but not comfortable — a meaningful earnings shock would compress it quickly. Against that, Net Debt to EBITDA improved from 3.36x to 3.02x, because EBITDA grew faster than debt. The leverage is being outgrown, slowly.
The uncomfortable arithmetic: Cosmo First paid ₹137.06 Crore in interest and ₹10.33 Crore in dividends during FY26. Lenders received 13.3 times what shareholders received. That is the honest hierarchy of claims on this business today.
Return Ratios (Computed, Consolidated)
| ROE (PAT / average equity) | 10.12% |
| ROCE (EBIT / average capital employed) | ≈ 11.01% |
| Asset Turnover | 0.78x |
| Price / Book | ≈ 1.35x |
ROCE of roughly 11% against a cost of debt implied by ₹137.06 Crore interest on average borrowings of about ₹1,471 Crore (≈9.3%) leaves a spread of under 200 basis points. The company is earning above its borrowing cost, but not by much.
Balance Sheet Expansion
| Total Assets FY26 | ₹4,694.97 Cr |
| Total Assets FY25 | ₹4,124.78 Cr |
| PPE FY26 | ₹2,361.10 Cr |
| PPE FY25 | ₹1,718.21 Cr |
| Capital Work-in-Progress | ₹187.70 Cr (from ₹584.41 Cr) |
A genuinely encouraging signal: capital work-in-progress collapsed from ₹584.41 Crore to ₹187.70 Crore while PPE jumped ₹642.89 Crore. Projects moved from "under construction" to "operational." The heavy capex cycle appears to be ending, which is exactly what would need to happen for free cash flow to turn positive.
Dividend Sustainability Analysis
The Coverage Numbers
| Metric | Value | Formula |
|---|---|---|
| Dividend Outflow | ₹10.50 Cr | ₹4 × 2.625 Cr shares |
| Payout Ratio (Consolidated) | 6.73% | ₹10.50 Cr ÷ ₹155.98 Cr |
| Payout Ratio (Standalone) | 9.87% | ₹10.50 Cr ÷ ₹106.43 Cr |
| Dividend Coverage (Consolidated) | 15.08x | EPS ₹60.31 ÷ DPS ₹4 |
| Dividend Coverage (Standalone) | 10.29x | EPS ₹41.15 ÷ DPS ₹4 |
| Cash Coverage | 40.65x | ₹426.86 Cr ÷ ₹10.50 Cr |
| Operating Cash Flow Coverage | 37.78x | ₹396.73 Cr ÷ ₹10.50 Cr |
| Free Cash Flow Coverage | Negative | FCF is (₹15.35) Cr |
✓ Arguments For Sustainability
- Payout ratio of 6.73% is extraordinarily low. Earnings would have to fall 93% before the dividend became unaffordable from profits.
- Cash coverage of 40.65 times. The company holds ₹426.86 Crore of liquid resources against a ₹10.50 Crore commitment.
- Uninterrupted dividend record for at least ten years — no suspensions, including through the 2020 disruption.
- Capital work-in-progress down 67.9%, signalling the peak capex year is behind.
- EBITDA growing faster than debt; Net Debt/EBITDA improved to 3.02x.
- Clean unmodified audit opinion; zero promoter share pledging.
✗ Arguments Against
- Free cash flow is negative at (₹15.35) Crore. The dividend is not covered by post-capex cash.
- Net debt rose 19.93% to ₹1,159.17 Crore in the same year the dividend was declared.
- Roughly ₹57.20 Crore of profit is unrealised sales tax incentives — non-cash.
- Interest coverage weakened to 2.47x from 2.64x.
- Petcare and Others burned ₹74.48 Crore — seven times the dividend.
- Dividend has been flat at ₹4 for two years and flat at the ₹4 baseline since FY18. No growth.
- Unquantified New Labour Codes liability still pending.
Classification: SUSTAINABLE — But For an Uncomfortable Reason
ShareBazaar Online classifies this dividend as Sustainable. The reasoning needs to be stated precisely, because the label alone would be misleading.
₹10.50 Crore is 0.48% of the company's ₹2,181.70 Crore market capitalisation, 0.22% of its ₹4,694.97 Crore asset base, and 2.9% of its annual interest bill. It is not a financial commitment in any meaningful sense. It is a signalling gesture. A company with ₹426.86 Crore of liquid resources can pay ₹10.50 Crore every year almost regardless of what happens to profits, cash flow or debt.
So the sustainability question here is not "can they pay it?" — it obviously is. The more useful question is "will it ever become large enough to matter?" That depends entirely on whether free cash flow turns decisively positive, whether Petcare stops losing ₹42 Crore a year, and whether the board chooses distribution over further reinvestment once capex normalises. On current evidence, none of those is imminent.
Standalone vs Consolidated — Which One Pays?
This distinction matters for dividends and is routinely ignored. Dividends are paid out of the standalone entity's profits, not the group's. Standalone PAT was ₹106.43 Crore against consolidated PAT of ₹155.98 Crore — the gap reflects subsidiary contributions. Standalone free cash flow, however, is positive: operating cash flow of ₹357.76 Crore less capex of ₹267.29 Crore gives +₹90.47 Crore. The parent entity that actually writes the dividend cheque does generate surplus cash. The negative group FCF comes from subsidiary-level capital consumption.
Peer Comparison
Packaging Films Peer Set
| Company | Approx. Dividend Yield | Recent Dividend Action |
|---|---|---|
| Cosmo First | ≈ 0.48% | ₹4 final FY26, flat YoY |
| Jindal Poly Films | ≈ 1.43% | ₹5.50 declared; 10-yr dividend CAGR ≈ 19% |
| Polyplex Corporation | ≈ 0.77% – 1.28% | ₹1 final FY26; pays semi-annually |
| Chemicals industry average | ≈ 0.80% | Benchmark |
Peer yields sourced from Business Standard, Simply Wall St, TipRanks and ScanX market data at various dates in 2026 and are indicative rather than same-date comparable. Uflex and Garware Hi-Tech FY26 dividend data could not be verified to a primary source at time of writing and is therefore not stated rather than estimated.
Where Cosmo First Stands
On yield, Cosmo First ranks lowest in this peer set — roughly a third of Jindal Poly Films' yield and below the industry average. On payout ratio, Cosmo First's 6.73% compares against Polyplex's payout in the 31%–67% range depending on the period measured. Cosmo First distributes a far smaller share of what it earns than either listed comparable.
The Counterpoint Worth Making
Higher peer yields are not automatically better. Jindal Poly Films has been flagged for paying dividends while free cash flow was negative and reported large quarterly losses during FY26. Polyplex's consolidated FY26 net profit fell sharply to ₹40.93 Crore from ₹357.72 Crore. Cosmo First grew consolidated profit 16.95% in the same year. A low yield backed by growing profits is a different proposition from a high yield backed by shrinking ones.
Comparative Fundamentals
Cosmo First's ROE of 10.12% and ROCE of roughly 11.01% are modest in absolute terms but respectable for a capital-intensive commodity films business at this point in the cycle. The stock trades at approximately 1.35x book value and a trailing P/E in the 13x–14x range — a stated discount of around 34% to the peer median P/E of about 21.8x, per Value Research. Whether that discount reflects the loss-making Petcare venture, the leverage, or genuine mispricing is a judgement each reader should form independently.
Promoter Impact Analysis
Shareholding Pattern (March 2026)
| Promoter & Promoter Group | 40.78% |
| — of which Ashok Jaipuria | 36.14% |
| Foreign Portfolio Investors | 2.13% |
| Domestic Institutions | ≈ 1.20% |
| Public & Others | ≈ 54.79% |
| Promoter Pledge | Nil |
Shareholding data sourced from MarketsMojo and IIFL for the quarter ended March 2026.
Dividend Distribution by Holder Class
| Total Dividend Outflow | ₹10.50 Cr |
| Promoter Group (40.78%) | ₹4.28 Cr |
| — Ashok Jaipuria (36.14%) | ₹3.79 Cr |
| FPIs (2.13%) | ₹0.22 Cr |
| DIIs (1.20%) | ₹0.13 Cr |
| Public & Minority (54.79%) | ₹5.75 Cr |
Distribution Impact — Reading It Fairly
Promoters receive ₹4.28 Crore and public shareholders receive ₹5.75 Crore. Because promoter holding is below 50%, the majority of this dividend flows to non-promoters — which is not always the case in Indian promoter-led companies.
Two features deserve credit here. First, zero promoter pledging. Promoters have not borrowed against their shares, which removes the most common Indian small-cap scenario where dividends effectively service promoter personal leverage. Second, promoter holding has been essentially stable, slipping only 0.08 percentage points from December 2025 — no quiet exit.
The neutral observation: at ₹4.28 Crore against a promoter stake worth roughly ₹890 Crore at current prices, this dividend represents about a 0.48% annual cash return to promoters too. Promoters are not extracting cash through the dividend line. Their economic interest is overwhelmingly in the share price and in the long-term build-out of the business — which is directionally aligned with minority shareholders, whatever one thinks of the strategy itself.
Institutional Participation Is Thin
Combined FPI and DII holding is only about 3.33%, and FPI holding declined from 3.49% in June 2025 to 2.13% in March 2026 — a fall of 136 basis points over three quarters. Mutual fund holding is reported at roughly 0.01%, which is effectively nil. Low institutional ownership means thinner liquidity, wider price swings on modest volumes, and less external analytical scrutiny of management decisions. It is a structural characteristic of this stock rather than a temporary condition.
Taxation Analysis
How Dividends Are Taxed in India
Since 1 April 2020, the Dividend Distribution Tax paid by companies was abolished and the burden shifted entirely to the shareholder. The current framework:
- Dividend income is added to your total income under "Income from Other Sources" and taxed at your applicable slab rate. There is no separate concessional rate.
- The only deduction permitted is interest expense on borrowings used to buy the shares, capped at 20% of the dividend. No other expenses are allowed.
- Health and education cess of 4% applies on top of the computed tax.
TDS Rules — As Specified by Cosmo First
| Shareholder Category | TDS Rate | Condition |
|---|---|---|
| Resident individual, dividend up to ₹10,000 | Nil | Per financial year, per company |
| Resident, dividend above ₹10,000, valid PAN | 10% | Section 194 |
| Resident, PAN not valid / not linked | 20% | Section 206AA |
| Non-resident / FPI | 20% or treaty rate | Section 195; TRC + Form 10F needed |
| Sovereign wealth funds, pension funds, ADIA subsidiaries | Exempt | On filing prescribed declarations |
Critical deadline: all declarations, PAN copies, Tax Residency Certificates and Form 15G/15H must reach the company or its Registrar and Transfer Agent by 24 July 2026, at dividendhelp@cosmofilms.com. Miss it and the company has stated it will deduct at the higher rate. You can still claim a refund in your tax return, but the money is locked up until then.
Worked Example A — The Realistic Cosmo First Investor
Assume: 1,000 shares of Cosmo First, dividend ₹4 per share, investor in the 30% tax slab.
| Gross Dividend (1,000 × ₹4) | ₹4,000 |
| TDS deducted (below ₹10,000 threshold) | ₹0 |
| Amount credited to bank | ₹4,000 |
| Tax payable at 30% + 4% cess (31.2%) | ₹1,248 |
| Net Dividend After Tax | ₹2,752 |
| Investment value at ₹829.40 | ₹8,29,400 |
| Pre-tax effective yield | 0.48% |
| Post-tax effective yield | 0.33% |
Watch the trap: no TDS was deducted, so ₹4,000 arrives in full and it feels tax-free. It is not. You owe ₹1,248 in advance tax or at filing. Investors who spend the full credited amount and forget the liability face interest under Sections 234B and 234C.
Worked Example B — Crossing the TDS Threshold
Assume: 1,000 shares, dividend ₹10 per share, investor in the 30% slab.
| Gross Dividend (1,000 × ₹10) | ₹10,000 |
| TDS at 10% (threshold crossed) | ₹1,000 |
| Amount credited to bank | ₹9,000 |
| Total tax liability at 31.2% | ₹3,120 |
| Balance tax payable at filing (₹3,120 − ₹1,000) | ₹2,120 |
| Net Dividend After Tax | ₹6,880 |
To cross the ₹10,000 TDS threshold on Cosmo First's ₹4 dividend, you would need more than 2,500 shares — an investment of roughly ₹20.7 lakh at current prices. The overwhelming majority of retail holders will see zero TDS and must self-assess.
Slab-Wise Net Outcome on 1,000 Shares
| Tax Slab | Gross | Tax + Cess | Net | Post-Tax Yield |
|---|---|---|---|---|
| Nil / below exemption | ₹4,000 | ₹0 | ₹4,000 | 0.48% |
| 5% slab | ₹4,000 | ₹208 | ₹3,792 | 0.46% |
| 20% slab | ₹4,000 | ₹832 | ₹3,168 | 0.38% |
| 30% slab | ₹4,000 | ₹1,248 | ₹2,752 | 0.33% |
Illustrative computations by ShareBazaar Online at a market price of ₹829.40. Surcharge, where applicable to higher income brackets, would reduce net receipts further. This is general information and not tax advice — consult a qualified chartered accountant for your own position.
Key Risks
1. BOPP Commodity Spread Volatility
Packaging films contributed ₹3,439.21 Crore of ₹3,638.72 Crore consolidated revenue — 94.5% of the business. BOPP film is a commodity whose profitability depends on the spread between polypropylene input cost and film realisation. That spread is set by global capacity additions, not by Cosmo First. The FY21-22 super-cycle and the subsequent collapse in dividends is the historical proof of how violently this swings.
2. Leverage and Interest Rate Exposure
Gross debt of ₹1,586.03 Crore against equity of ₹1,616.62 Crore, with interest coverage at 2.47x and falling. Finance costs grew 41.69% in FY26. A 100 basis point rise in borrowing cost on this book would add roughly ₹15.9 Crore of annual interest — more than the entire dividend outflow.
3. Petcare Cash Burn
Zigly Pet Ventures and the Petcare segment lost ₹42.18 Crore in FY26 on revenue of ₹54.75 Crore, with the loss widening from ₹34.67 Crore in FY25. This is a consumer retail venture inside an industrial films company — a different business model, different working capital cycle, different competitive set. There is no disclosed timeline to breakeven.
4. Non-Cash Earnings Quality
Approximately ₹57.20 Crore of unrealised sales tax incentives sits inside FY26 profit — around 37% of consolidated PAT. These are state industrial-promotion entitlements dependent on continued policy support and eventual realisation. Any change in state incentive policy, or delay in realisation, would hit reported profitability without any change in the underlying operating business.
5. Internal Controls at Overseas Subsidiaries
The ₹7.20 Crore exceptional item relates to fraudulent transfers from the Netherlands subsidiary's bank account in 2023 — an event that took three years to fully quantify. Separately, the auditors noted that four subsidiaries with total assets of ₹171.33 Crore and revenue of ₹170.86 Crore were unaudited, with figures furnished by management. Those four also posted a combined net loss of ₹13.14 Crore.
6. Currency and Hedging Losses
The effective portion of loss on cash flow hedging instruments was ₹61.26 Crore in FY26 against ₹2.57 Crore in FY25 — a 23-fold increase routed through other comprehensive income. Total comprehensive income of ₹152.19 Crore was lower than net profit of ₹155.98 Crore as a result. Cosmo First exports across 100+ countries; currency volatility is a live exposure.
7. Unquantified Labour Code Liability
The company booked ₹4.04 Crore as a one-time past-period employee benefit liability under the New Labour Codes, while stating that rules are still being notified and further impact "will be further evaluated." The final liability is open-ended and not currently quantifiable from disclosed information.
8. Liquidity and Institutional Absence
Combined institutional holding of roughly 3.33%, with mutual fund holding at effectively 0.01%, and FPI holding falling from 3.49% to 2.13% over three quarters. Low institutional participation means poor liquidity and pronounced price gaps. The stock has traded between ₹560.80 and ₹1,307.20 over 52 weeks — a range of 133% of the low.
What To Monitor
1. Does Free Cash Flow Turn Positive in FY27?
This is the single metric that determines whether the dividend can ever grow meaningfully. FCF moved from (₹335.66) Crore to (₹15.35) Crore. With capital work-in-progress down to ₹187.70 Crore from ₹584.41 Crore, FY27 capex should fall materially. Watch the FY27 cash flow statement: operating cash flow minus capex crossing zero is the trigger.
2. Petcare Losses — Narrowing or Widening?
Track the Petcare segment result quarterly. It went from (₹34.67) Crore in FY25 to (₹42.18) Crore in FY26. A third consecutive year of widening losses would suggest the venture needs restructuring. A narrowing trend, with revenue growth holding above 60%, would suggest scale economics are finally arriving.
3. Capacity Utilisation on New Lines
The 81 KMT BOPP line commissioned in June 2025 and the 22 KMT CPP line from March 2025 are now carrying full depreciation and interest. Watch reported utilisation rates and incremental EBITDA per tonne in quarterly presentations. Depreciation rose 37.52% — revenue needs to keep pace or return ratios compress further.
4. Interest Coverage Trajectory
Coverage fell from 2.64x to 2.47x. Below 2.0x, lender covenants at many Indian companies begin to bind and refinancing terms tighten. Watch quarterly finance costs against quarterly EBIT. Any repayment of the ₹1,185.55 Crore non-current borrowings without fresh drawdown would be a strong positive signal.
5. Realisation of Sales Tax Incentives
The ₹57.20 Crore of unrealised sales tax incentives should eventually convert to cash. Track "other financial assets" and "other current assets" on the balance sheet — the latter jumped from ₹203.72 Crore to ₹287.23 Crore. If these balances keep building without cash conversion, earnings quality deteriorates further.
6. Trade Payables Normalisation
The ₹204.48 Crore payables inflow flattered FY26 operating cash flow. Watch whether payable days revert in FY27. If they do, operating cash flow could fall sharply even with flat profits — a common and widely misread cash flow reversal.
7. FPI Holding Direction
FPI holding fell from 3.49% in June 2025 to 2.13% in March 2026. The June 2026 shareholding pattern, due shortly, will show whether the exit has stopped. Sustained institutional selling in a low-float stock creates persistent price pressure independent of fundamentals.
8. AGM Voting and Dividend Policy Disclosure
The 49th AGM on 5 August 2026 also includes a resolution on commission to Non-Executive Directors not exceeding 1% of net profits. Watch the voting results and any dividend distribution policy commentary in the annual report — a stated policy would remove much of the uncertainty around whether payouts will scale with earnings.
Conclusion
What This Announcement Actually Is
Cosmo First's ₹4 final dividend for FY26 is a ₹10.50 Crore distribution from a company that generated ₹3,638.72 Crore of revenue and ₹155.98 Crore of consolidated profit. At a payout ratio of 6.73% and a yield of 0.48%, it is one of the smallest meaningful capital returns in the listed packaging films space. It is unchanged from FY25 despite profit growing 16.95%.
Positives
- Revenue up 25.68%, EBITDA up 33.23%, operating margin expanded 60 bps to 10.54%.
- Operating cash flow more than doubled to ₹396.73 Crore.
- Free cash flow deficit narrowed dramatically from (₹335.66) Cr to (₹15.35) Cr.
- Capital work-in-progress down 67.9% — the heavy capex phase is ending.
- Cash coverage of the dividend at 40.65 times; ₹426.86 Crore of liquid resources.
- Unbroken ten-year dividend record with zero promoter pledging.
- Clean unmodified audit opinion on both standalone and consolidated results.
- Trades at roughly 1.35x book and 13-14x trailing earnings, at a stated discount to peer median.
Negatives
- Free cash flow is still negative. The dividend is funded from reserves, not surplus cash.
- Net debt rose 19.93% to ₹1,159.17 Crore in the dividend year.
- Interest coverage weakened to 2.47x; lenders received 13.3x what shareholders did.
- Roughly ₹57.20 Crore of profit is non-cash unrealised sales tax incentives.
- Roughly half the operating cash flow improvement came from a ₹204.48 Crore payables inflow.
- Petcare and Others burned ₹74.48 Crore — seven times the dividend.
- Dividend flat at ₹4 for two years and at the ₹4 baseline since FY18 — no real growth in eight years.
- Yield ranks lowest in the peer set at 0.48% versus 1.43% for Jindal Poly Films.
The Fair Reading
Two contradictory-sounding statements are both true here, and holding them together is the whole analysis.
This dividend is completely safe. ₹10.50 Crore against ₹426.86 Crore of liquid resources and 15x earnings coverage is not a commitment that could plausibly fail. Anyone worried about a cut is worrying about the wrong thing.
This dividend is also nearly irrelevant to the investment case. At 0.48% pre-tax and 0.33% post-tax for a 30%-slab investor, it cannot move a portfolio outcome. What will move the outcome is whether the ₹642.89 Crore of newly commissioned plant and equipment earns an acceptable return, whether Petcare stops consuming ₹42 Crore a year, and whether free cash flow turns positive so that the leverage starts falling.
Cosmo First is not currently an income stock and the numbers do not permit it to be described as one. It is a capital-intensive, cyclical films manufacturer at the tail end of a large expansion, paying a token distribution while it works through the consequences of that expansion. Readers should assess it on that basis and reach their own conclusions.
Frequently Asked Questions
What dividend has Cosmo First announced for FY 2025-26?
What is the Cosmo First dividend yield?
What is the record date for the Cosmo First dividend?
What is the ex-dividend date and why does it matter?
When will the Cosmo First dividend be paid?
Who is eligible to receive this dividend?
How will this dividend be taxed?
If I hold 1,000 shares, how much will I actually receive after tax?
Is the Cosmo First dividend sustainable?
What is Cosmo First's dividend history?
Why did the dividend stay at ₹4 when profit grew 17%?
What is the payout ratio and dividend coverage?
How much of this dividend goes to the promoters?
Should I buy Cosmo First shares just to capture this dividend?
What should investors monitor going forward?
Disclaimer
This report has been prepared by ShareBazaar Online for informational and educational purposes only. It does not constitute investment advice, a research report under SEBI (Research Analysts) Regulations, 2014, or an offer or solicitation to buy or sell any security. No buy, sell or hold recommendation is made or implied anywhere in this document.
Financial figures relating to the dividend announcement, audited results, balance sheet, cash flow statement and segment reporting are sourced from Cosmo First Limited's regulatory filing dated 20 May 2026 (Ref: CFL/SE/2026-27/MAY/05) submitted to BSE Limited and the National Stock Exchange of India Limited. Market prices, shareholding patterns, historical dividend records and peer comparisons are sourced from third-party market data providers as cited within the relevant sections, and may differ from exchange records or company disclosures. Readers should verify all figures independently against primary sources.
All ratios, yields, payout ratios, coverage multiples, free cash flow figures, net debt calculations and tax illustrations marked "computed" have been derived by ShareBazaar Online and are not disclosed by the company. Computational methodologies may differ from those used by other analysts. Where information was unavailable, this report states "Not Disclosed by Company" rather than estimating.
The dividend described here is a Board recommendation subject to shareholder approval at the 49th Annual General Meeting scheduled for 5 August 2026. Record dates, ex-dates and payment dates are subject to change by the company or the exchanges. Tax treatment described is general in nature, reflects rules as understood at the time of writing, and does not account for individual circumstances, surcharge, or subsequent amendments. Consult a qualified chartered accountant or SEBI-registered investment adviser before acting.
Investments in securities markets are subject to market risks. Read all related documents carefully before investing. Past dividend performance is not indicative of future dividends. ShareBazaar Online and its authors may or may not hold positions in the securities discussed and accept no liability for any loss arising from the use of this information.