
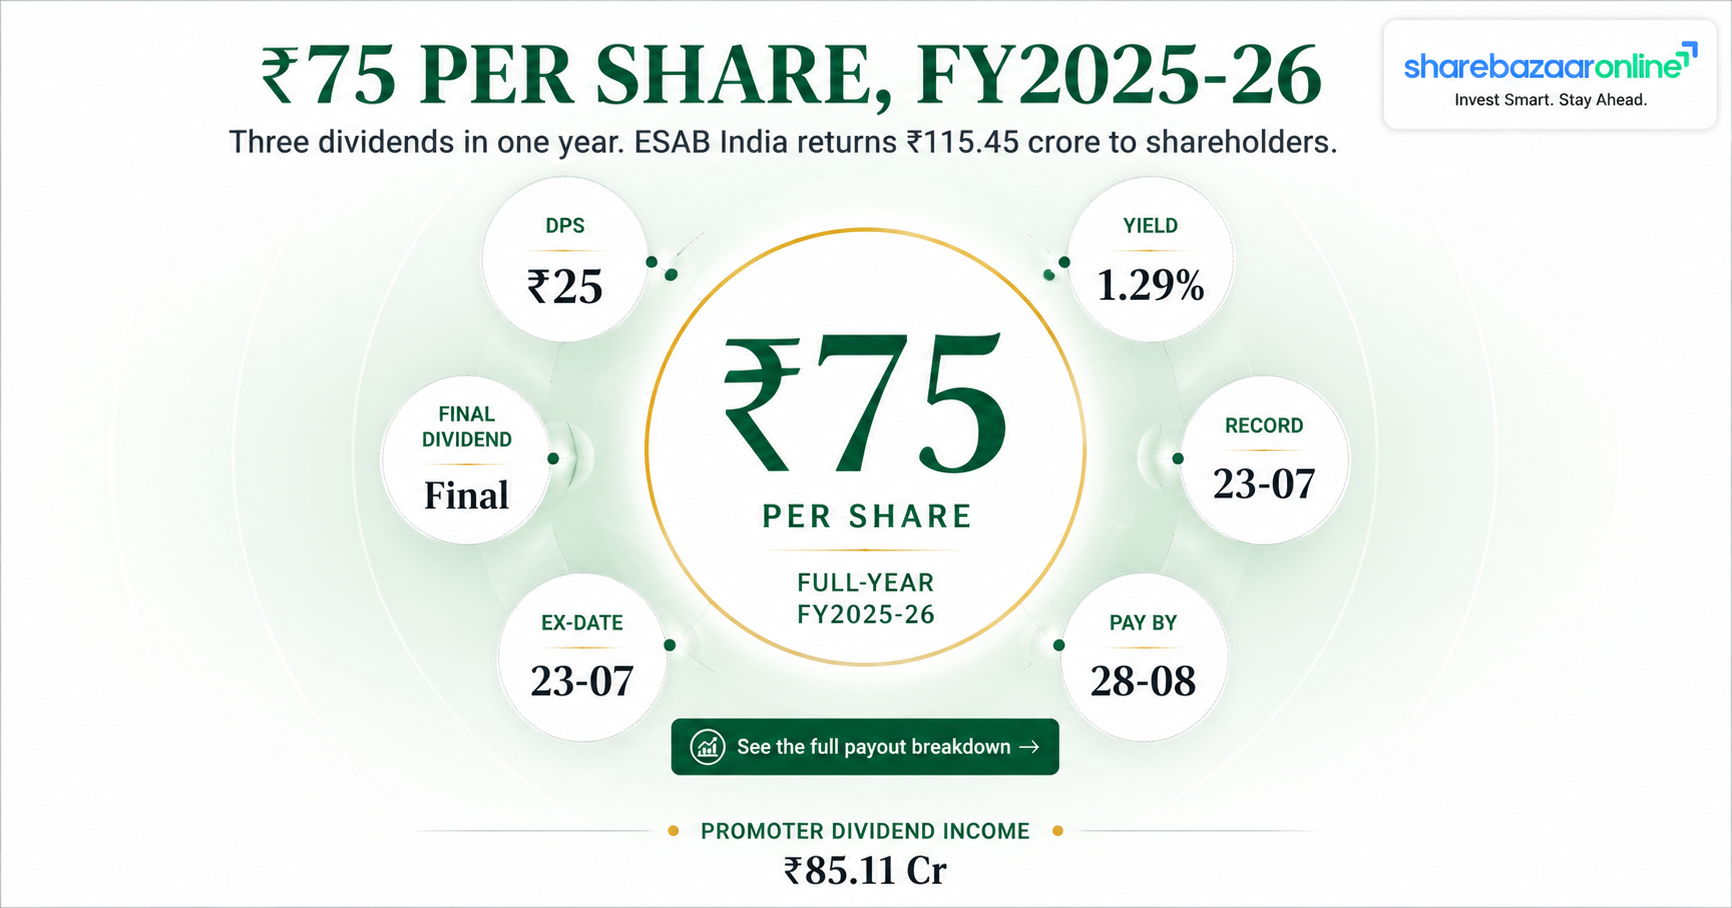
Dividend Snapshot
ESAB India Limited has recommended a final dividend of ₹25 per equity share of face value ₹10 each — a dividend rate of 250% — for the financial year ended 31 March 2026. The Board cleared it at a meeting held on 27 May 2026, and the record date has been fixed at 23 July 2026.
The headline number is not the interesting part. ESAB India already paid two interim dividends of ₹25 each during FY26. Add the final dividend and the full-year payout comes to ₹75 per share. In FY2024-25 the company distributed ₹90 per share. So even though net profit rose 17.8%, the total dividend for the year is 16.7% lower. That reversal is the story this page unpacks.
Dividend Details
Payout & Market Data
Announcement-date and latest market prices sourced from public NSE/BSE market data providers (Value Research, HDFC Sky). Latest CMP as of 21 July 2026.
The One Line That Matters
ESAB India's FY26 cash dividend payments of ₹141.62 crore consumed 95% of the year's free cash flow of ₹149.14 crore. Cash and cash equivalents on the balance sheet fell from ₹65.11 crore to ₹57.46 crore. The reduced FY26 declaration looks less like a signal of weakness and more like a company recalibrating a payout that had run ahead of its own cash generation.
Dividend Announcement Summary
What The Board Actually Approved
At its meeting on 27 May 2026 — which ran from 19:52 hours to 20:30 hours — the Board of Directors of ESAB India Limited approved the audited financial results for FY2025-26 and recommended a final dividend of ₹25 per equity share of ₹10 each (250%).
The company disclosed the resulting outflow as ₹38,48,25,500, and specifically noted that this figure is inclusive of tax deducted at source. In plain terms: ₹38.48 crore is the gross amount leaving the company, not the amount landing in shareholder bank accounts.
The word "recommended" is important. A final dividend is a proposal, not a declaration. It becomes legally payable only after shareholders approve it at the Annual General Meeting. ESAB India's 39th AGM is scheduled for 29 July 2026 at 15:30 hours, to be held through video conferencing and other audio-visual means. The company has stated the dividend will be paid within 30 days from the date of the AGM.
FY2025-26 Total Dividend Build-Up
All three tranches disclosed in Notes 4, 5 and 6 to the audited financial results dated 27 May 2026.
Approval Status
- Board recommendation: Completed on 27 May 2026
- Shareholder approval at AGM: Pending — 29 July 2026
- Statutory auditor Deloitte Haskins & Sells issued an unmodified opinion on the FY26 annual results
- Exact payment date: Not Disclosed by Company — payable on or before 28 August 2026 under the 30-day commitment
Key Dates Timeline
| Event | Date | What It Means For You |
|---|---|---|
| Board Meeting / Announcement | 27-05-2026 | Dividend recommended after market hours |
| Ex-Date | 23-07-2026 | Under T+1 settlement the ex-date and record date fall on the same day. Buy before this date to qualify |
| Record Date | 23-07-2026 | Shareholders on the register on this date are eligible |
| Annual General Meeting | 29-07-2026 | 39th AGM via video conferencing, 15:30 hrs — dividend gets formally approved here |
| Payment Date | On or before 28-08-2026 | Company has committed to pay within 30 days of the AGM. Exact date: Not Disclosed by Company |
A Note On The Ex-Date
Indian equities have settled on a T+1 cycle since January 2023. That changed the arithmetic of dividend eligibility. Under the older T+2 system, the ex-date sat one trading day before the record date. Under T+1, a trade executed on the record date settles the next working day — which is too late to appear on the register. The practical result is that the ex-date and record date now coincide. If you want the ₹25, the purchase must be executed on a trading day before 23 July 2026. Always cross-check the final ex-date published in the NSE and BSE corporate action circular, since exchange notices are the operative record.
Dividend Yield Analysis
Yield Calculations
Why Two Different Yields Exist
Screeners will quote ESAB India's dividend yield anywhere between 1.3% and 1.75%. The spread exists because different data sources use different twelve-month windows. A trailing window that captures the ₹42 FY25 final dividend paid in September 2025 plus two ₹25 interims produces a trailing total of ₹92 and a yield near 1.6%. A forward window based on the FY26 declaration of ₹75 produces roughly 1.29%. Both are arithmetically correct. Only one describes what the company just committed to.
Yield Reality Check
A rising yield is not automatically good news, and this is a clean case study. Between the announcement close of ₹7,019.50 on 27 May 2026 and ₹5,821.50 on 21 July 2026, ESAB India's share price fell roughly 17%. That price fall alone lifted the yield on the final dividend from 0.36% to 0.43%. Nothing about the dividend improved. The denominator shrank.
Working through the four standard causes of a moving yield:
- Stronger dividend? No. The FY26 declaration of ₹75 is below the FY25 declaration of ₹90.
- Falling share price? Yes — this is the dominant driver. The stock sits about 20% below its 52-week high of ₹7,319.50.
- One-time special dividend? No. All three FY26 tranches are ordinary interim and final dividends. The company did not pass through the ₹30.91 crore exceptional gain on land sale as a special dividend.
- Weak business performance? Partly, at the margin. Q4 FY26 profit after tax fell to ₹43.55 crore from ₹47.43 crore a year earlier, a decline of 8.2%, even though Q4 revenue rose 7.6%.
Even at the higher level, a yield of 1.29% is not an income proposition. At a price-to-earnings multiple of roughly 43 times FY26 earnings, ESAB India is priced as a growth and quality compounder. The dividend is a by-product of a cash-generative business, not the reason the stock trades where it does.
Dividend History Analysis
Dividend Declared By Financial Year
| Financial Year | Interim(s) | Final | Total | Change YoY |
|---|---|---|---|---|
| FY2025-26 | ₹25 + ₹25 | ₹25 | ₹75 | -16.7% |
| FY2024-25 | ₹25 + ₹23 | ₹42 | ₹90 | +4.7% |
| FY2023-24 | ₹32 + ₹24 | ₹30 | ₹86 | +10.3% |
| FY2022-23 | ₹30 + ₹28 | ₹20 | ₹78 | Base year shown |
| FY2016-17 to FY2021-22 | Full tranche-level series for these years is Not Disclosed by Company in the 27 May 2026 filing. Readers should verify against the relevant annual reports before relying on a ten-year series. | |||
Tranche dates and amounts for FY23 to FY25 compiled from publicly available exchange corporate-action records (TipRanks ESABINDIA dividend history). FY26 tranches taken directly from Notes 4, 5 and 6 of the audited results.
Classification: Consistent Payer, Variable Amount
ESAB India has paid a dividend in every one of the last four financial years and has never suspended payment across the period reviewed. On frequency, it is a Consistent Payer.
On amount, it is anything but consistent. Individual tranches over the last four years have ranged from ₹20 to ₹42 per share. There is no declared dividend policy target, no fixed rupee floor and no stated payout ratio band. ESAB India decides each tranche on the day.
The FY26 Reduction In Context
FY26 is the first year-on-year reduction in total declared dividend in the four-year window. It is a meaningful one: ₹15 per share, or ₹23.09 crore retained inside the company.
It is worth being precise about what happened. The cut is concentrated entirely in the final dividend, which fell from ₹42 to ₹25 — a 40.5% reduction. Both interim tranches were held at ₹25. This suggests a deliberate decision taken at the year-end board meeting, once full-year cash generation was visible, rather than a mid-year reaction to trading conditions.
Financial Performance Analysis
FY2025-26 Full Year Results
Note on presentation: ESAB India reports standalone financial statements only. The company has no subsidiaries, associates or joint ventures requiring consolidation, and operates in a single reportable segment — Fabrication Technology. There is therefore no consolidated versus standalone gap to reconcile. All figures below are as audited.
| Particulars (₹ Crore) | FY2025-26 | FY2024-25 | Growth |
|---|---|---|---|
| Revenue from Operations | 1,508.15 | 1,373.47 | +9.8% |
| Other Income | 6.03 | 7.78 | -22.5% |
| EBITDA (computed) | 269.84 | 244.54 | +10.3% |
| EBITDA Margin | 17.9% | 17.8% | +10 bps |
| Profit Before Exceptional & Tax | 256.74 | 235.72 | +8.9% |
| Exceptional Items (net) | +17.26 | Nil | — |
| Profit Before Tax | 274.00 | 235.72 | +16.2% |
| Profit After Tax (reported) | 206.69 | 175.42 | +17.8% |
| PAT excluding exceptional (computed) | 193.68 | 175.42 | +10.4% |
| Basic & Diluted EPS | ₹134.30 | ₹113.98 | +17.8% |
Operating Leverage: Where The Growth Actually Went
Revenue grew 9.8%. EBITDA grew 10.3%. That is roughly one-to-one — meaning ESAB India got almost no operating leverage from a year of near double-digit top-line growth. In a business with high fixed-cost absorption, you would normally expect profit to grow faster than sales. It did not.
The cost lines explain why:
| Cost Head (₹ Crore) | FY26 | FY25 | Growth |
|---|---|---|---|
| Raw Materials Consumed | 644.07 | 609.47 | +5.7% |
| Purchase of Stock-in-Trade | 234.43 | 207.44 | +13.0% |
| Employee Benefits Expense | 145.12 | 120.61 | +20.3% |
| Other Expenses | 214.69 | 193.34 | +11.0% |
| Depreciation & Amortisation | 17.06 | 14.92 | +14.3% |
Employee cost is the outlier. It grew at more than twice the rate of revenue — 20.3% against 9.8%. Part of this is disclosed: Note 7 states that employee benefits include ₹3.29 crore of stock awards granted by the ultimate parent, ESAB Corporation USA, under its 2022 Omnibus Incentive Plan. That is a new line item, absent in FY25. But ₹3.29 crore explains only about 13% of the ₹24.51 crore increase. The remaining ₹21.22 crore is underlying wage and headcount inflation, and the company has not disclosed a breakdown.
Raw material cost growing at only 5.7% against 9.8% revenue growth is the offsetting positive — it points to either input-cost deflation or improved pricing. That gain is what kept EBITDA margin flat at 17.9% instead of contracting.
Quarter Four: The Weak Spot
The full-year headline masks a soft finish. In Q4 FY26, revenue from operations rose to ₹395.75 crore from ₹367.72 crore — growth of 7.6%. But profit after tax fell to ₹43.55 crore from ₹47.43 crore, a decline of 8.2%.
Revenue up, profit down, in the same quarter. Two identifiable causes:
- Q4 employee cost jumped to ₹41.91 crore from ₹32.55 crore — an increase of 28.8% year on year, far outpacing the 7.6% revenue growth.
- The tax line normalised. Q4 FY25 carried a deferred tax credit of ₹10.60 crore against ₹5.06 crore in Q4 FY26. Q4 FY25's reported profit was flattered by that credit; Q4 FY26's was not.
On a pre-tax basis the decline is milder — Q4 profit before tax fell to ₹59.69 crore from ₹62.53 crore, down 4.5%. Also worth noting: Q4 figures are balancing figures between the audited full year and the reviewed nine-month numbers, as the company states in Note 9. They are unaudited by construction.
Cash Flow Analysis
Reported Profit Versus Cash Generated
Profit is an accounting judgement. Cash is a bank statement. For a dividend analysis, cash is the only number that matters — a company cannot pay a dividend out of a profit that has not converted into money.
| Particulars (₹ Crore) | FY2025-26 | FY2024-25 | Change |
|---|---|---|---|
| Profit After Tax | 206.69 | 175.42 | +17.8% |
| Operating Cash Flow before WC changes | 280.14 | 251.49 | +11.4% |
| Operating Cash Flow after WC changes | 256.88 | 260.67 | -1.5% |
| Income Tax Paid | (76.19) | (61.86) | +23.2% |
| Net Cash From Operations | 180.69 | 198.81 | -9.1% |
| Capital Expenditure | (31.55) | (27.96) | +12.8% |
| Free Cash Flow (computed) | 149.14 | 170.85 | -12.7% |
| Dividend Paid in Cash | (141.62) | (156.36) | -9.4% |
| Net Change in Cash | (7.65) | +26.75 | Reversal |
Highlighted Finding: Profit Rose, Operating Cash Fell
This is the single most important divergence in the FY26 accounts. Profit after tax rose 17.8%. Net cash from operating activities fell 9.1%, from ₹198.81 crore to ₹180.69 crore.
Two mechanical explanations account for most of the gap, and neither is alarming on its own:
- The ₹17.26 crore exceptional gain is non-operating. It is stripped out of operating cash flow and the cash proceeds appear under investing activities. Reported profit got the benefit; operating cash flow correctly did not.
- Cash tax paid rose 23.2% to ₹76.19 crore while the profit and loss tax charge rose only 11.6% to ₹67.31 crore. The company paid out ₹8.88 crore more in cash tax than it charged to the income statement.
Cash conversion — operating cash flow divided by profit after tax — came in at 87.4% in FY26 against 113.3% in FY25. Still respectable, but a clear step down.
Receivables Versus Revenue
Trade receivables rose to ₹254.07 crore from ₹226.26 crore — growth of 12.3% against revenue growth of 9.8%. Receivables outgrew sales, but only modestly.
Translated into days sales outstanding: 61.5 days in FY26 against 60.1 days in FY25. A deterioration of roughly a day and a half. In an industrial products business selling to shipbuilding, petrochemical, construction and infrastructure customers, that is well within normal variation.
The cash flow statement shows working capital absorbed ₹23.26 crore in FY26, with the two largest drags being receivables (₹29.59 crore) and inventories (₹10.01 crore), partly offset by a ₹11.98 crore increase in trade payables. The allowance for expected credit loss was ₹2.41 crore, down from ₹3.15 crore — the company is not signalling deteriorating collection quality.
How Is The Dividend Funded?
Testing the four possible sources:
- Current earnings — YES, primarily. FY26 free cash flow of ₹149.14 crore covered the ₹141.62 crore of cash dividends paid during the year.
- Cash reserves — YES, marginally. Coverage was only 1.05 times. Cash and cash equivalents fell ₹7.65 crore over the year. The buffer was thin.
- Asset sales — NO, not directly. The company received proceeds on the Khardah, West Bengal land and booked a ₹30.91 crore exceptional gain, but the cash was not earmarked or passed through as a special dividend.
- Borrowings — NO. ESAB India has zero borrowings. Its only financial liabilities of a debt nature are lease liabilities totalling ₹3.35 crore. Finance costs of ₹2.07 crore relate substantially to lease accounting, not debt servicing.
Balance Sheet Strength
Position As At 31 March 2026
Cash & Investments Pool
Return Ratios & Structure
ESAB India generates a return on equity of approximately 52.3% on reported FY26 profit, or 49.0% on profit excluding exceptional items, calculated against average shareholders' funds of ₹395.32 crore. Return on capital employed works out to roughly 67.6%. These are extraordinary numbers for an industrial manufacturer, and they exist because the equity base is small relative to earnings — precisely because the company has historically paid most of its profit out rather than retaining it.
That is a real and underappreciated point. High ROE at ESAB India is partly a consequence of the dividend policy, not independent evidence of superior capital efficiency. A company that retained its earnings would carry a larger equity base and report a lower ROE on the same operating performance.
On solvency there is nothing to debate. Zero borrowings, a net cash position of ₹115.19 crore, current assets of ₹525.35 crore against current liabilities of ₹244.93 crore (a current ratio of 2.15 times), and total liabilities that actually declined from ₹287.93 crore to ₹269.49 crore. The dividend is not being funded by a stretched balance sheet.
One line worth flagging: non-current provisions jumped from ₹7.60 crore to ₹21.79 crore, an increase of ₹14.19 crore. This is largely the gratuity liability created by the new Labour Codes, discussed in the next section.
Dividend Sustainability Analysis
Coverage Metrics
| Metric | Final Dividend Only | FY26 Full-Year Dividend |
|---|---|---|
| Dividend Per Share | ₹25 | ₹75 |
| Dividend Outflow | ₹38.48 Cr | ₹115.45 Cr |
| Payout Ratio (of PAT ₹206.69 Cr) | 18.6% | 55.9% |
| Dividend Coverage (EPS ÷ DPS) | 5.37x | 1.79x |
| FCF Coverage (₹149.14 Cr ÷ outflow) | 3.88x | 1.29x |
| Cash Coverage (₹118.54 Cr ÷ outflow) | 3.08x | 1.03x |
Payout ratio calculated on reported PAT. On PAT excluding exceptional items of ₹193.68 crore, the FY26 full-year payout ratio rises to 59.6%.
Classification: Sustainable
Assessed against the four standard tests:
- Can the company afford it? Yes. The ₹38.48 crore final dividend is covered 3.08 times by the liquid pool and 3.88 times by FY26 free cash flow. Even the full-year ₹115.45 crore is covered 1.29 times by free cash flow.
- Is it covered by free cash flow? Yes, but the margin narrowed. FY26 cash dividends of ₹141.62 crore consumed 95% of free cash flow. Reduce the declaration to ₹75 and that ratio falls to a far healthier 77% on FY26 free cash flow.
- Is debt rising while dividends are paid? No. Borrowings are nil and total liabilities fell year on year.
- Is the earnings trend intact? Yes, but decelerating. Revenue +9.8%, adjusted profit +10.4%, but Q4 profit -8.2% and operating cash flow -9.1%.
The verdict is Sustainable — with the important qualifier that ESAB India appears to have arrived at this classification by choosing to cut. At the FY25 rate of ₹90 per share, the outflow would have been ₹138.54 crore against free cash flow of ₹149.14 crore, coverage of just 1.08 times, and the company would have needed to keep drawing down cash. The reduction to ₹75 is what restores the headroom.
The Labour Codes Overhang
On 21 November 2025 the Government of India notified provisions of the Code on Wages 2019, the Industrial Relations Code 2020, the Code on Social Security 2020 and the Occupational Safety, Health and Working Conditions Code 2020 — consolidating twenty-nine existing labour laws.
ESAB India recognised a ₹13.65 crore increase in gratuity liability from past service cost and treated it as an exceptional item, on the basis that enactment of new legislation is a non-recurring event. The accounting treatment is defensible. What matters for the forward view is the company's own caveat: it states it continues to monitor the finalisation of Central and State Rules and Government clarifications on other aspects of the Labour Codes and will provide appropriate accounting treatment as developments occur.
That is management telling shareholders, in careful language, that the ₹13.65 crore may not be the final number. The uniform definition of wages under the Codes typically raises the base on which gratuity, provident fund and leave encashment are computed — which affects the recurring cost line, not just a one-time provision. In a year where employee costs already grew 20.3%, this is the cost item most capable of surprising on the downside.
Capital Allocation Analysis
What Else Could ₹115.45 Crore Have Done?
ESAB India will distribute ₹115.45 crore for FY26 across three tranches. Assessing the alternatives honestly:
| Alternative Use | Feasible? | Assessment |
|---|---|---|
| Reduce Debt | Not applicable | Borrowings are already nil. Only ₹3.35 crore of lease liabilities exist. There is nothing to repay. |
| Increase Capex | Yes | FY26 capex was ₹31.55 crore — just 2.1% of revenue and only 1.85 times the ₹17.06 crore depreciation charge. Gross block additions were modest. A company growing revenue at 9.8% while spending 2.1% of sales on capex is running an asset-light, largely maintenance-mode investment programme. |
| Conduct Buyback | Unlikely | Promoter holding is already 73.72%. A buyback would push it toward the 75% SEBI ceiling for continued listing, and would further reduce an already thin public float. Post-October 2024, buybacks are also taxed as deemed dividend in shareholders' hands, removing the historic tax advantage. |
| Retain Cash | Partially chosen | The FY26 reduction from ₹90 to ₹75 retains an incremental ₹23.09 crore inside the business. Other equity still rose from ₹345.86 crore to ₹413.99 crore. |
The Honest Read
For a business with no debt, no large capex programme and no acquisition pipeline disclosed, distributing surplus cash is a defensible allocation choice. The alternative — accumulating idle cash on the balance sheet earning treasury returns — would drag return on equity down without creating shareholder value.
The question worth asking is the opposite one. India's welding and fabrication equipment market is tied to infrastructure, shipbuilding, energy and capital expenditure cycles that many observers expect to expand. A company spending only 2.1% of revenue on capital expenditure while distributing 56% of profit is making a clear statement about where it sees its growth opportunity — or about how much reinvestment its parent believes the Indian business needs. Investors should form their own view on whether that is prudent discipline or a missed window.
Peer Comparison
| Metric | ESAB India | Ador Welding | Comment |
|---|---|---|---|
| Dividend Yield | ~1.3% | ~1.8% to 2.0% | Ador yields more, largely because it trades at a much lower multiple |
| Payout Ratio | 55.9% | ~58% | Broadly comparable distribution discipline |
| Return on Equity | ~52% | ~15% | ESAB India is in a different league — partly structural, partly a small equity base |
| Return on Capital Employed | ~68% | ~16% to 23% | Wide gap in capital efficiency |
| Debt Position | Zero debt, net cash ₹115.19 Cr | Effectively zero debt | Both balance sheets are clean |
| Price-to-Earnings | ~43x | ~21x to 27x | ESAB India carries a substantial quality premium |
| Net Profit Margin | 13.7% | ~5.8% to 7.2% | Roughly double the peer margin |
ESAB India figures computed from the audited FY26 results filed 27 May 2026 and market data as of 21 July 2026. Ador Welding figures sourced from publicly available market data providers (MarketsMojo, CNBC, Simply Wall St, IndMoney) across April to July 2026 and reflect differing reporting dates — treat as indicative rather than like-for-like.
On Sector Benchmarking
The Indian welding and fabrication technology sector is small and concentrated. Meaningful listed comparables are limited to ESAB India, Ador Welding, GEE Limited and a handful of smaller players. Broader machinery-sector dividend yields in India cluster around 0.8%, against a market-wide top-quartile threshold near 1.2% (Simply Wall St sector data).
On that benchmark ESAB India's 1.29% forward yield sits marginally above the sector average and just inside the market's top quartile — but it is nowhere near a genuine high-yield stock.
The Valuation Tension
ESAB India trades at roughly 43 times earnings and around 20 times book value. Ador Welding trades in the low twenties on earnings and around 3.2 times book. The market is paying up sharply for ESAB India's superior margins, ROCE and parentage.
The consequence for income seekers is direct arithmetic: at 43 times earnings, even a 100% payout ratio would only produce a 2.3% yield. The valuation, not the payout policy, is what caps the income return on this stock.
Promoter Impact Analysis
Shareholding Pattern
Shareholding as reported for the quarter ended March 2026, sourced from publicly available market data (Groww, Kotak Neo).
Dividend Distribution
Where The Money Goes
ESAB Corporation, the Delaware-headquartered ultimate parent, holds its 73.72% stake through two indirect wholly-owned subsidiaries — ESAB Holdings Limited in the United Kingdom and Exelvia Group India BV in the Netherlands. Roughly three out of every four rupees of dividend leaves the Indian shareholder base and travels up to the parent structure.
This is not a criticism — every shareholder receives exactly the same ₹25 per share, and pro-rata distribution is the fairest mechanism available. But it does explain the pattern. A parent holding nearly three-quarters of a debt-free, cash-generative subsidiary with limited local capex requirements has a structural incentive toward high distribution rather than retention. When you see ESAB India distributing 56% of profit while spending 2.1% of revenue on capex, the shareholding structure is a large part of the explanation.
It also cuts the other way, and this is the part minority shareholders should hold onto. Because the promoter is the overwhelming beneficiary, promoter and minority incentives on dividend policy are aligned. There is no realistic scenario in which the parent starves the dividend while extracting value elsewhere — it would be taxing itself to do so. The FY26 reduction from ₹90 to ₹75 cost the promoter roughly ₹17.02 crore of its own income. Cuts that expensive to the controlling shareholder are usually taken for a reason.
A technical note on non-resident tax: dividends to the UK and Netherlands entities attract withholding at 20% plus applicable surcharge and cess under Section 195, subject to relief under the relevant Double Taxation Avoidance Agreement where the beneficial ownership and treaty conditions are satisfied. This is one reason the company describes the ₹38.48 crore outflow as inclusive of tax deducted at source.
Taxation Analysis
How Dividends Are Taxed In India
Since 1 April 2020, when the Dividend Distribution Tax regime was abolished, dividends are taxed entirely in the hands of the shareholder. The mechanics:
- Dividend income is taxed under the head "Income from Other Sources" at your applicable slab rate. There is no separate concessional rate and no exemption threshold on the income itself.
- A resident individual pays 0%, 5%, 20% or 30% depending on total income, plus applicable surcharge and a 4% health and education cess.
- Under Section 194, the company deducts TDS at 10% before paying, if aggregate dividend from that single company exceeds ₹10,000 in a financial year for a resident individual. The threshold was raised from ₹5,000 to ₹10,000 with effect from FY2025-26.
- If PAN is not furnished or is inoperative, TDS jumps to 20% under Section 206AA.
- TDS is not the final tax. It is a credit against your total liability, claimed in your income tax return. If your slab rate is 30%, you owe the balance. If your income is below the taxable threshold, you can file Form 15G (or Form 15H if aged 60 or above) with the registrar to avoid deduction, and claim a refund if already deducted.
- Interest expense incurred to earn dividend income is deductible, capped at 20% of the dividend under Section 57. No other expenses qualify.
Worked Example A — Standard Illustration
Investor holds 1,000 shares. Dividend ₹10 per share. Tax slab 30%.
Note: no TDS is deducted here, but the full ₹3,120 still becomes payable when filing your return. The cash arrives whole and the tax bill arrives later — a common source of shortfall at filing time.
Worked Example B — ESAB India Final Dividend
Investor holds 1,000 shares of ESAB India. Final dividend ₹25 per share. Tax slab 30%.
Investment value: 1,000 × ₹5,821.50 = ₹58,21,500. Net ₹17,200 ÷ ₹58,21,500 = 0.30%.
The Full-Year Post-Tax Picture
Applying the same 30% slab to the entire FY26 dividend of ₹75 per share: gross ₹75,000 on 1,000 shares, tax at 31.2% of ₹23,400, net ₹51,600. Against an investment of ₹58,21,500 at the current price, that is a post-tax yield of 0.89% against the headline 1.29%.
For a shareholder in the 30% bracket, roughly ₹31 of every ₹100 of ESAB India dividend goes to tax. Investors in the 0% or 5% brackets keep substantially more, which is why dividend-yield stocks tend to appeal disproportionately to lower-bracket and retired investors. This is general information, not tax advice — your specific position depends on your total income, residential status and applicable surcharge. Consult a qualified tax professional.
Key Risks
1. Labour Codes Cost Escalation
The company has provided ₹13.65 crore for past service gratuity cost but explicitly states it is still monitoring Central and State Rules and Government clarifications. The uniform wage definition under the Codes typically expands the base for gratuity, provident fund and leave encashment — meaning the recurring cost impact may exceed the one-time provision. With employee costs already up 20.3% in FY26, this is the most concrete identified cost risk.
2. Absence Of Operating Leverage
EBITDA grew 10.3% on revenue growth of 9.8%. Margin expanded just 10 basis points to 17.9%. At a valuation of roughly 43 times earnings, the market is priced for margin expansion that FY26 did not deliver. If cost inflation continues to absorb revenue growth, the multiple is exposed.
3. Single Segment, Cyclical End Markets
The company operates in one reportable segment — Fabrication Technology. Its customers sit in shipbuilding, petrochemicals, construction, transport, offshore, energy and repair. There is no diversification cushion. A capital expenditure slowdown across Indian heavy industry transmits directly to volumes, with no offsetting business line.
4. Declining Cash Generation
Operating cash flow fell 9.1% to ₹180.69 crore and free cash flow fell 12.7% to ₹149.14 crore, in a year when reported profit rose 17.8%. Cash on the balance sheet declined ₹7.65 crore. If this divergence persists for a second year, the dividend headroom created by the FY26 cut will be consumed again.
5. Concentrated Ownership, Thin Float
Promoters hold 73.72%, leaving a public float of just 26.28%. With mutual funds holding 12.70%, genuinely free-floating stock is around 13%. Daily traded volumes are frequently in the low thousands of shares. The stock is prone to sharp moves on modest order flow — its 52-week range of ₹4,710 to ₹7,319.50 represents a 55% spread.
6. Valuation Risk
At approximately 43 times earnings and 20 times book value, ESAB India trades at a substantial premium to sector peers in the low-to-mid twenties. The stock has already fallen roughly 17% from the announcement-date close of ₹7,019.50 and sits about 20% below its 52-week high. Premium multiples compress quickly when growth disappoints.
7. Non-Recurrence Of Exceptional Gains
FY26 reported profit includes a ₹30.91 crore gain on derecognition of the Khardah, West Bengal land. Excluding all exceptional items, profit growth was 10.4%, not the headline 17.8%. FY27 will face a base that contains a gain unlikely to repeat, making optical year-on-year comparisons harder.
8. No Declared Dividend Policy Floor
Tranche amounts over four years have ranged from ₹20 to ₹42 per share with no stated payout band or rupee floor. FY26 delivered a 16.7% reduction in total dividend. Investors treating this stock as a predictable income holding should recognise that the amount is decided afresh at each board meeting.
What To Monitor
1. Employee Cost As A Percentage Of Revenue
Track this every quarter. It rose from 8.8% of revenue in FY25 to 9.6% in FY26. If FY27 quarterly employee cost holds below 9.6% of revenue while sales grow, the margin story is intact. If it pushes past 10%, cost inflation is winning.
2. Further Labour Code Provisions
Watch the notes to each quarterly result for any incremental provision beyond the ₹13.65 crore already recognised, and for the first quarter in which the recurring gratuity and provident fund charge reflects the new wage definition in full. The company has committed to updating treatment as Rules are finalised.
3. Operating Cash Flow To PAT Conversion
This ratio fell from 113.3% in FY25 to 87.4% in FY26. Sustained conversion below roughly 85% would signal that reported profits are not translating into distributable cash — the single most reliable early warning for any dividend stock.
4. Capital Expenditure Trajectory
FY26 capex was ₹31.55 crore, or 2.1% of revenue. Capital work in progress actually declined from ₹9.43 crore to ₹5.65 crore, suggesting projects completing without fresh ones starting at scale. A step-up would signal management sees a growth runway; continued flatness suggests a harvest posture.
5. Receivable Days And Inventory Days
Days sales outstanding moved from 60.1 to 61.5 days. Inventories rose 7.7% to ₹140.67 crore against revenue growth of 9.8% — a mild positive. If receivable days move past 70, working capital will start consuming the free cash flow that funds the dividend.
6. Quarterly Revenue And Margin Trajectory
Q4 FY26 delivered 7.6% revenue growth against 9.8% for the full year — a deceleration into the year end. Watch Q1 FY27 for whether that is seasonal or the start of a trend, and whether profit growth reconnects with revenue growth.
7. The First FY27 Interim Dividend
ESAB India has historically declared its first interim dividend at the November board meeting. The FY27 first interim is the cleanest single signal of whether management views the FY26 reduction as a one-year recalibration or a new lower base. A figure below ₹25 would confirm the latter.
8. End-Market Order Flow
As a single-segment fabrication technology supplier, ESAB India's volumes track shipbuilding, energy, petrochemical and infrastructure capital expenditure. Monitor government infrastructure allocations, shipbuilding order books and private industrial capex announcements as leading indicators, since they turn several quarters before the company's revenue does.
Conclusion
Positives
- Zero borrowings and a net cash position of ₹115.19 crore. The dividend is not debt-funded in any form.
- Free cash flow of ₹149.14 crore covers the ₹115.45 crore full-year declaration 1.29 times, and the ₹38.48 crore final dividend 3.88 times.
- Return on equity of approximately 52% and return on capital employed near 68% — among the strongest in Indian industrial manufacturing.
- Revenue grew 9.8% to ₹1,508.15 crore with EBITDA margin holding steady at 17.9% despite significant employee cost inflation.
- Total liabilities declined from ₹287.93 crore to ₹269.49 crore. Other equity rose to ₹413.99 crore.
- Statutory auditor Deloitte Haskins & Sells issued an unmodified opinion. No qualifications, no emphasis of matter on the dividend.
- An uninterrupted record of dividend payment across the four financial years reviewed, with three tranches paid in FY26 alone.
Negatives
- The FY26 total dividend of ₹75 is 16.7% below FY25's ₹90 — the first reduction in the period reviewed, and it came in a year of rising profit.
- Operating cash flow fell 9.1% while profit after tax rose 17.8%. Cash conversion dropped from 113.3% to 87.4%.
- FY26 cash dividends consumed 95% of free cash flow, and balance sheet cash declined ₹7.65 crore.
- Employee costs grew 20.3% — more than twice the rate of revenue — and only ₹3.29 crore of the ₹24.51 crore increase is explained by disclosed stock awards.
- Q4 FY26 profit after tax fell 8.2% despite 7.6% revenue growth.
- Adjusted for the ₹30.91 crore land sale gain, underlying profit growth was 10.4%, not the headline 17.8%.
- At 1.29%, the yield is not competitive as an income proposition, and a valuation of roughly 43 times earnings structurally caps how high it can go.
- Capex of just 2.1% of revenue raises a legitimate question about reinvestment ambition in a capital goods cycle.
The Balanced View
ESAB India's ₹25 final dividend is comfortably affordable. That much is not in question — a debt-free company generating ₹149 crore of free cash flow can write a ₹38.48 crore cheque without difficulty.
The more useful observation is what the full-year number reveals. FY26 marks the year ESAB India stopped growing its dividend and pulled it back 16.7%, in a year of record revenue and record reported profit. Read alongside operating cash flow falling 9.1%, cash dividends absorbing 95% of free cash flow, and employee costs growing at twice the rate of sales, the reduction reads as a rational correction of a payout that had drifted ahead of cash generation — not a distress signal.
Whether that is prudence or caution is the judgement each investor has to make. The facts supporting both readings are set out above. What the numbers will not support is treating ESAB India as a dependable income stock. A 1.29% pre-tax yield, falling to roughly 0.89% post-tax for an investor in the 30% bracket, is a rounding error against a stock that has traded between ₹4,710 and ₹7,319.50 over twelve months. If you own ESAB India, you own it for the business and the balance sheet. The dividend is a consequence, not the case.
Frequently Asked Questions
What dividend has ESAB India announced for FY2025-26?
What is the ESAB India dividend yield?
What is the record date for the ESAB India dividend?
What is the ex-date for the ESAB India dividend?
When will the ESAB India dividend be paid?
Who is eligible to receive this dividend?
How is the ESAB India dividend taxed in my hands?
Is the ESAB India dividend sustainable?
What is ESAB India's dividend history?
Why did ESAB India cut the dividend when profit went up?
What is ESAB India's dividend payout ratio?
Does ESAB India have any debt?
What were the exceptional items in ESAB India's FY26 results?
Who owns ESAB India, and how much of the dividend goes to the promoter?
What should investors monitor going forward?
Disclaimer
This article is published by ShareBazaar Online for informational and educational purposes only. It does not constitute investment advice, a recommendation, or a solicitation to buy, sell or hold any security. ShareBazaar Online is not a SEBI-registered investment adviser or research analyst.
All company-specific dividend, financial, balance sheet and cash flow figures are drawn from ESAB India Limited's stock exchange filing dated 27 May 2026 (Outcome of Board Meeting, audited financial results for the year ended 31 March 2026, and the independent auditor's report of Deloitte Haskins & Sells). Market prices, shareholding data, dividend history for prior years and peer comparison figures are sourced from publicly available third-party market data providers and are attributed at the point of use. Ratios described as computed have been derived by ShareBazaar Online from the filed statements and are clearly labelled as such.
The final dividend is a Board recommendation and remains subject to shareholder approval at the Annual General Meeting scheduled for 29 July 2026. Record dates, ex-dates and payment dates may be revised by the company or the exchanges. Investors must verify all dates against the official corporate action circulars issued by BSE Limited and the National Stock Exchange of India Limited.
Taxation content reflects a general understanding of Indian income tax provisions as applicable to resident individual shareholders and is not personalised tax advice. Tax treatment varies by residential status, total income, surcharge applicability and treaty position. Consult a qualified chartered accountant or tax adviser.
Securities investments are subject to market risk. Past dividend payments are not a guarantee of future distributions, and ESAB India has no declared minimum dividend policy. Readers should conduct their own due diligence and consult a SEBI-registered investment adviser before making any investment decision. ShareBazaar Online and its authors accept no liability for any loss arising from the use of this content.