
Dividend Snapshot
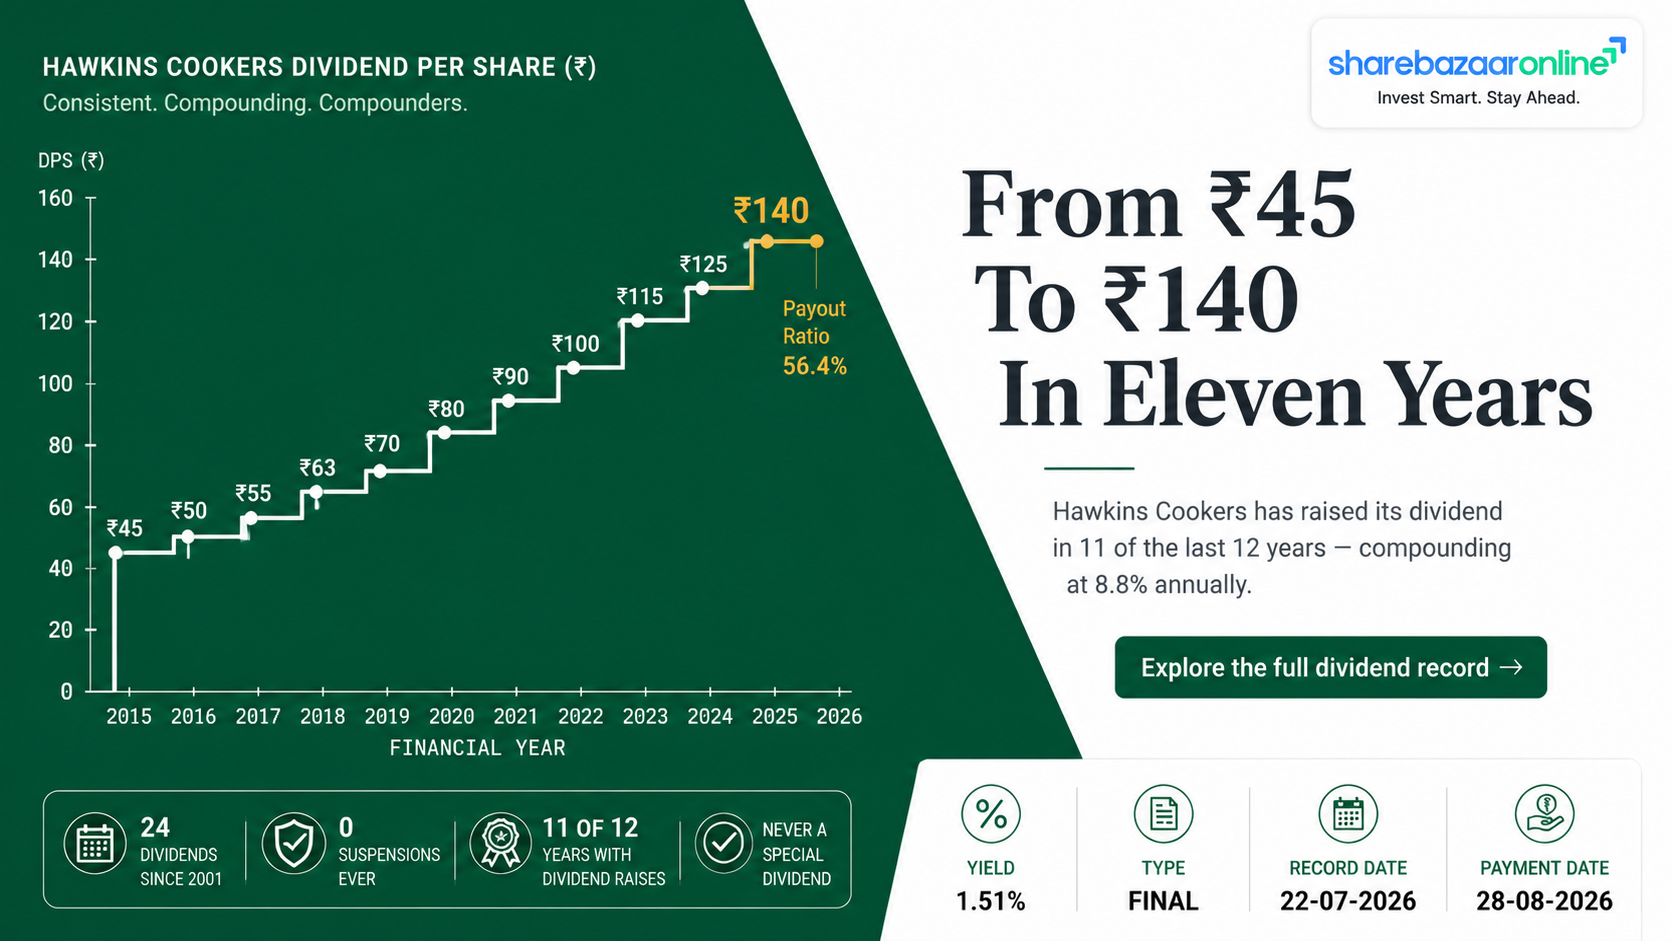
Hawkins Cookers Limited has fixed Wednesday, July 22, 2026 as the Record Date for its final dividend of ₹140 per equity share for the financial year ended March 31, 2026. The dividend was recommended by the Board on May 28, 2026 and will be paid only after shareholders approve it at the 66th Annual General Meeting on July 29, 2026. Payment is committed on or before August 28, 2026.
Dividend Details
| Company | Hawkins Cookers Limited |
| NSE Symbol | HAWKINCOOK |
| BSE Code | 508486 |
| ISIN | INE979B01015 |
| Dividend Type | Final Dividend |
| Dividend Per Share | ₹140.00 |
| Face Value | ₹10.00 |
| Dividend Percentage | 1,400% |
| Financial Year | FY 2025-26 |
| AGM Approval Required | Yes — July 29, 2026 |
Computed Metrics
| Yield on Announcement Price | 1.91% |
| Yield on Latest Price | 1.51% |
| Total Dividend Outflow | ₹74.04 Crore |
| Shares Outstanding | 52,88,470 |
| Paid-Up Share Capital | ₹5.29 Crore |
| Dividend Payout Ratio | 56.4% |
| Dividend Coverage (EPS/DPS) | 1.77x |
| Free Cash Flow Coverage | 0.65x |
| Operating Cash Flow Coverage | 1.19x |
| Promoter Dividend Income | ₹41.48 Crore |
The One Number That Matters Most
Hawkins generated ₹48 crore of free cash flow in FY26 but is paying out ₹74.04 crore in dividend. The company is distributing roughly ₹26 crore more than it produced in surplus cash last year. That gap has to come from accumulated reserves or borrowings — and borrowings did rise from ₹23 crore to ₹29 crore during FY26. This is the single most important fact in this announcement, and it is not visible anywhere in the company's July 4 filing. (Cash flow data: Screener.in FY26 standalone cash flow statement.)
Dividend Announcement Summary
What The Company Actually Filed
The intimation dated July 4, 2026, signed by Company Secretary Brahmananda Pani and filed with BSE Limited under Regulation 42 of SEBI (LODR) Regulations, 2015, states four things:
- The Board, at its meeting on May 28, 2026, recommended a dividend of ₹140 per equity share of face value ₹10 for the year ended March 31, 2026.
- The dividend is subject to shareholder approval at the 66th AGM on Wednesday, July 29, 2026.
- The Register of Members and Share Transfer Books stay closed from Thursday, July 23, 2026 to Wednesday, July 29, 2026 (both days inclusive).
- The Record Date is Wednesday, July 22, 2026. Payment will be made latest by August 28, 2026.
What "1,400%" Means
Indian companies quote dividends as a percentage of face value, not of market price. Hawkins' face value is ₹10 per share. A ₹140 dividend is therefore 1,400% of face value. This number is dramatic and almost meaningless for an investor. What you actually earn is the dividend yield — ₹140 divided by the price you pay. At the latest traded price of roughly ₹9,263, that is 1.51%, not 1,400%.
Not Disclosed In This Filing
The July 4 letter is a procedural Regulation 42 intimation. It does not contain:
- Total dividend outflow — Not Disclosed by Company in this filing (disclosed as ₹74.03 crore in the May 28 results filing)
- Cash and bank balances — Not Disclosed by Company
- Free cash flow — Not Disclosed by Company
- Management commentary on the dividend — Not Disclosed by Company
- Ex-date — Not Disclosed by Company (set by the exchanges)
Standalone vs Consolidated
Hawkins Cookers reports standalone financials only. The company has no material subsidiaries requiring consolidation, so its standalone numbers are effectively its consolidated numbers. Every financial figure in this analysis is therefore on a standalone basis, which is the complete picture of the business.
Key Dates Timeline
| Event | Date | What It Means For You |
|---|---|---|
| Board Recommendation | 28-05-2026 | Board proposed ₹140 per share along with FY26 audited results |
| Regulation 42 Intimation | 04-07-2026 | Record date formally notified to BSE |
| Last Cum-Dividend Trade | 21-07-2026 | Buy on or before this day to be eligible |
| Ex-Dividend Date | 22-07-2026 | Buy on or after this day and you get no dividend |
| Record Date | 22-07-2026 | Names on the register today receive the dividend |
| Book Closure Begins | 23-07-2026 | Register of Members closed |
| 66th AGM & Approval | 29-07-2026 | Shareholders vote — dividend is not final until this passes |
| Book Closure Ends | 29-07-2026 | Register reopens |
| Payment Deadline | 28-08-2026 | Money must be credited by this date |
Why Ex-Date and Record Date Are The Same Day
Indian equities settle on a T+1 basis — shares reach your demat account one working day after you buy. So to have your name on the register on July 22, you must have bought on or before July 21, 2026. Under T+1, the ex-date and record date fall on the same calendar day. Hawkins' previous dividend followed the identical pattern: ex-date and record date were both July 30, 2025. (Source: Trendlyne corporate actions history.)
Dividend Yield Analysis
Yield At Two Reference Prices
| Price on announcement day (28-05-2026) | ₹7,339.50 |
| Yield at announcement | 1.91% |
| Latest traded price (20-07-2026, BSE) | ₹9,262.85 |
| Yield at latest price | 1.51% |
| 10-year average dividend yield | 1.87% |
| Post-tax yield (30% slab investor) | 1.04% |
Announcement-day close sourced from ICICI Direct; latest price from Investing.com BSE data; 10-year average yield from Wisesheets.
Yield Reality Check
A rising dividend does not automatically mean a rising yield. Here is what actually happened:
Hawkins raised the dividend 7.7% (from ₹130 to ₹140). But the share price rose roughly 26% between the announcement and the record date — from ₹7,339.50 on May 28 to about ₹9,263 on July 20. The price ran faster than the dividend, so the yield compressed from 1.91% to 1.51%.
This is a price-driven yield decline, not a dividend problem. Anyone buying today for the dividend is buying a materially thinner yield than someone who bought in late May. The current 1.51% also sits 19% below the stock's own 10-year average yield of 1.87%.
What A Dividend Buyer Should Understand
On the ex-date, a stock's price typically adjusts downward by roughly the dividend amount. ₹140 on a ₹9,263 stock is about 1.5% of the price. You do not gain 1.51% by buying just before the ex-date — you convert 1.51% of your capital into a taxable cash receipt. For an investor in the 30% slab, that conversion is value-negative on a same-day basis, because you pay tax on the dividend while the price adjustment is not a deductible loss unless you actually sell.
Dividend History Analysis
Twelve Years Of Dividends
| Ex-Date | Dividend | Type | Change |
|---|---|---|---|
| 22-07-2026 | ₹140 | Final | +7.7% |
| 30-07-2025 | ₹130 | Final | +8.3% |
| 29-07-2024 | ₹120 | Final | +20.0% |
| 02-08-2023 | ₹100 | Final | +66.7% |
| 27-07-2022 | ₹60 | Final | −33.3% |
| 09-08-2021 | ₹90 | Interim | +12.5% |
| 14-08-2020 | ₹80 | Interim | 0.0% |
| 29-07-2019 | ₹80 | Final | +14.3% |
| 30-07-2018 | ₹70 | Final | 0.0% |
| 25-07-2017 | ₹70 | Final | +16.7% |
| 26-07-2016 | ₹60 | Final | +33.3% |
| 28-07-2015 | ₹45 | Final | — |
Dividend history sourced from Trendlyne corporate actions data. Hawkins has declared 24 dividends since July 2001.
Classification: Consistent Payer
Hawkins has paid a dividend every single year for the last 12 years, and has declared 24 dividends since 2001. It has never suspended a dividend. Dividend per share compounded at roughly 8.8% a year over the last decade (₹60 in 2016 to ₹140 in 2026) and about 10.9% a year over eleven years from the ₹45 base of 2015.
There has never been a special dividend. Every payout has been an ordinary annual distribution.
Two Wrinkles Worth Knowing
The COVID reshuffle. Screener.in shows a 0% dividend payout ratio for FY2019-20. Hawkins did not declare a final dividend inside that financial year. Instead it paid an ₹80 interim dividend in August 2020, and another ₹90 interim in August 2021. Cash to shareholders never stopped; the accounting attribution shifted. Investors screening on "consecutive years of declared dividend" will see an apparent gap in FY20 that was not a real cut.
The 2022 drop. The July 2022 payout of ₹60 was 33% lower than the ₹90 before it. In the FY22 accounting year Hawkins actually distributed ₹150 in total (₹90 interim plus ₹60 final), a 95% payout ratio — the highest in over a decade, and the year operating cash flow went negative at minus ₹52 crore. The company overpaid relative to cash generated and then reset.
Financial Performance Analysis
FY26 vs FY25 — Standalone
| Metric | FY26 | FY25 | Change |
|---|---|---|---|
| Revenue from Operations | ₹1,252.93 Cr | ₹1,115.76 Cr | +12.3% |
| Total Income | ₹1,265.91 Cr | ₹1,129.29 Cr | +12.1% |
| Total Expenses | ₹1,089.29 Cr | ₹974.41 Cr | +11.8% |
| Operating Profit (EBITDA) | ₹181 Cr | ₹155 Cr | +16.8% |
| Operating Margin | 14.4% | 13.9% | +50 bps |
| Profit Before Tax | ₹177 Cr | ₹155 Cr | +14.2% |
| Net Profit (PAT) | ₹131.19 Cr | ₹114.69 Cr | +14.4% |
| Earnings Per Share | ₹248.10 | ₹216.90 | +14.4% |
| Depreciation | ₹14 Cr | ₹10 Cr | +40.0% |
FY26 results filed with BSE on May 28, 2026; audited by Kalyaniwalla & Mistry LLP with an unmodified opinion. Line items cross-referenced against Screener.in.
Operating Leverage: Working, For Once
The ladder is in the right order. Revenue up 12.3%, EBITDA up 16.8%, PAT up 14.4%. EBITDA growing faster than revenue means positive operating leverage — fixed costs were spread over a larger sales base and margin expanded 50 basis points to 14.4%.
PAT grew slower than EBITDA because depreciation jumped 40% from ₹10 crore to ₹14 crore, a direct consequence of the capacity investment made over the last two years. That is a normal, healthy trade-off, not a warning sign.
The Long-Term Growth Problem
FY26 was a good year inside a mediocre decade. Compounded five-year figures tell a duller story:
- 5-year sales growth: 10.3% compounded
- 5-year profit growth: 10% compounded
- 10-year sales growth: 10% compounded
- 3-year sales growth: 8% compounded
Three-year growth is the slowest of the three windows. The business is growing roughly in line with nominal GDP, and Screener.in flags the five-year sales record as poor. Against that, the stock trades at about 10.6 times book value. (Growth and valuation ratios: Screener.in.)
Returns Are Excellent But Steadily Declining
Hawkins still earns exceptional returns on capital — but the trend has been one-directional for a decade:
| Year | FY16 | FY19 | FY22 | FY24 | FY26 |
|---|---|---|---|---|---|
| ROCE | 79% | 61% | 50% | 45% | 41% |
| ROE | — | — | 39.3% | 32.9% | 31.7% |
ROCE has almost halved from 79% to 41% over ten years. Much of this is arithmetic — retained earnings build the equity base faster than profits grow — but it also reflects rising capital intensity as the company invests in plant. A 41% ROCE remains outstanding by any standard; the direction, however, is worth watching. (Return ratios: Screener.in and Equitymaster annual analyses.)
Cash Flow Analysis
Reported Profit Is An Opinion. Cash Is A Fact.
This is the section that matters most, and the one that most dividend coverage skips entirely. Hawkins' profit rose in FY26. Its cash generation fell for the second consecutive year.
Three-Year Cash Flow Trend
| Metric | FY24 | FY25 | FY26 |
|---|---|---|---|
| Net Profit | ₹110 Cr | ₹115 Cr | ₹131 Cr |
| Cash from Operations | ₹174 Cr | ₹102 Cr | ₹88 Cr |
| Free Cash Flow | ₹149 Cr | ₹69 Cr | ₹48 Cr |
| Cash from Investing | −₹104 Cr | −₹27 Cr | −₹17 Cr |
| Cash from Financing | −₹70 Cr | −₹76 Cr | −₹66 Cr |
| Net Cash Flow | ₹1 Cr | −₹1 Cr | ₹5 Cr |
| CFO as % of Operating Profit | 140% | 93% | 71% |
Cash flow statement figures from Screener.in FY26 standalone data.
Operating Cash Flow vs Net Profit
In FY26 Hawkins converted only 67% of its net profit into operating cash (₹88 crore of CFO against ₹131 crore of PAT). Two years earlier that ratio was 158%.
Measured against operating profit, cash conversion fell from 140% in FY24 to 93% in FY25 to 71% in FY26. Profits are being reported, but a shrinking share of them is arriving as cash in the bank.
This is the most important negative finding in this analysis. It does not mean the profits are fictitious — the auditors issued an unmodified opinion. It means working capital is absorbing an increasing share of the earnings.
Where The Cash Went: Inventory
The receivables side is actually excellent. Debtor days improved to 17 days from 20, while revenue grew 12.3%. Hawkins is collecting from its trade faster than before — there is no receivables-quality problem here.
The pressure comes from stock. Inventory days rose to 114 from 102, a 12-day increase on a growing revenue base. Working capital days rose to 39 from 30. The cash conversion cycle stretched to 74 days from 68.
Building inventory ahead of demand is a defensible commercial choice for a seasonal consumer-durables business with 44 new product launches in FY26. But it is being funded, in part, by the same cash that is being promised to shareholders.
How Is This Dividend Actually Being Funded?
Working through the arithmetic:
| FY26 Free Cash Flow | ₹48 Cr |
| Dividend Outflow Committed | ₹74.04 Cr |
| Shortfall | −₹26.04 Cr |
| FCF Coverage Ratio | 0.65x |
| CFO Coverage Ratio | 1.19x |
Against the four possible funding sources:
- Current earnings: Yes, in accounting terms. PAT of ₹131 crore comfortably exceeds ₹74 crore.
- Free cash flow: No. FCF of ₹48 crore covers only 65% of the dividend.
- Cash reserves: Partially. Reserves stand at ₹440 crore, so the balance sheet can absorb it comfortably.
- Borrowings: Marginally. Borrowings rose from ₹23 crore to ₹29 crore during FY26 — a ₹6 crore increase, roughly a quarter of the FCF shortfall.
- Asset sales: No evidence of any. Cash from investing was a modest outflow of ₹17 crore.
The honest conclusion: this dividend is earnings-funded but not free-cash-flow-funded. A company with ₹440 crore of reserves and ₹29 crore of debt can absorb a ₹26 crore gap for a year or two without strain. If the gap persists for three or four years, the dividend becomes structurally dependent on the balance sheet rather than the business.
Balance Sheet Strength
Balance Sheet At March 31, 2026
| Equity Share Capital | ₹5.29 Cr |
| Reserves & Surplus | ₹440 Cr |
| Total Borrowings | ₹29 Cr |
| Fixed Assets | ₹121 Cr |
| Capital Work in Progress | ₹12 Cr |
| Total Assets | ₹688 Cr |
| Book Value Per Share | ₹842 |
| Cash & Bank Balances | Not Disclosed by Company |
| Net Debt | Not Disclosed by Company |
Balance sheet figures from Screener.in FY26 standalone data. Cash and net debt are not separately disclosed in either the July 4 or May 28 filings.
What The Balance Sheet Says
Debt is negligible. Total borrowings of ₹29 crore against net worth of roughly ₹445 crore is a debt-to-equity ratio of about 0.07. Screener.in classifies the company as almost debt free, and interest coverage runs above 30 times.
But debt is rising. Borrowings fell steadily from ₹43 crore in FY22 to ₹23 crore in FY25, then rose 26% to ₹29 crore in FY26. Small in absolute terms — but it is the first increase in four years, and it happened in the same year free cash flow fell short of the dividend.
Fixed assets grew sharply. Net fixed assets rose from ₹85 crore to ₹121 crore, up 42%, while CWIP fell from ₹22 crore to ₹12 crore — capacity was commissioned. This is why depreciation jumped 40%.
Dividend As A Claim On The Balance Sheet
The ₹74.04 crore dividend represents about 16.6% of shareholders' funds and roughly 10.8% of total assets. On a book value of ₹842 per share, the ₹140 dividend is 16.6% of book value per share being handed back in a single year. For a company compounding book value at a good clip, that is a genuine choice about growth versus distribution — which is the subject of the capital allocation discussion below.
Dividend Sustainability Analysis
The Four Tests
| Test | Reading | Verdict |
|---|---|---|
| Earnings cover | 1.77x | Pass |
| Free cash flow cover | 0.65x | Fail |
| Operating cash flow cover | 1.19x | Thin |
| Debt position | ₹29 Cr, up 26% | Watch |
| Earnings trend | PAT +14.4% | Pass |
| Balance sheet capacity | ₹440 Cr reserves | Pass |
Classification: Moderately Sustainable
This is not a fragile dividend, and it is not a bulletproof one either.
Arguing for sustainability: a 56.4% payout ratio leaves genuine headroom, profits grew 14.4%, reserves stand at ₹440 crore, the business is almost debt free, ROCE is 41%, and the company has paid every single year for twelve years without a suspension.
Arguing against complacency: free cash flow has fallen for two straight years (₹149 crore → ₹69 crore → ₹48 crore), FCF now covers only 65% of the dividend, cash conversion dropped to 71% of operating profit, and borrowings ticked up.
The dividend is safe for FY27 on almost any reasonable assumption. Beyond that, it depends entirely on whether cash conversion recovers. If FY27 free cash flow returns above ₹100 crore, this becomes a non-issue. If it stays near ₹50 crore for a third year, the board will face a real choice between growing the dividend and funding the business.
Capital Allocation: What Else Could Management Have Done?
With ₹74.04 crore of distributable cash, the board had four alternatives. Quantifying each:
- Clear all debt. Total borrowings are ₹29 crore. The dividend is 2.6 times the entire debt load. Hawkins could have eliminated every rupee of borrowing and still paid ₹85 per share. Since interest coverage already exceeds 30 times, this would have added little value — the debt is not a burden.
- Increase capex. FY26 capex ran at roughly ₹40 crore (FCF of ₹48 crore against CFO of ₹88 crore). The dividend could have funded nearly two additional years of capital investment. With ROCE at 41%, capital reinvested inside this business earns far more than shareholders will get on the after-tax dividend. This is the strongest counter-argument to the payout.
- Buy back shares. At roughly ₹9,263 per share, ₹74 crore would retire about 79,900 shares — 1.5% of equity. Buybacks are now taxed in the shareholder's hands in India, so the tax advantage that once favoured them has gone. At 10.6 times book value, a buyback would also destroy book value per share. Reasonable to skip.
- Retain the cash. Adding ₹74 crore to reserves would lift them from ₹440 crore to ₹514 crore. But a company already earning 41% ROCE on a modest asset base does not obviously need more idle cash — hoarding would likely dilute returns further.
The defensible criticism of this dividend is not that it is reckless. It is that a business earning 41% on capital is returning 56% of its profits to shareholders who will pay up to 31.2% tax on receipt — while simultaneously borrowing a little more and letting inventory absorb cash. Reinvestment at 41% would compound faster for a long-term holder than a dividend taxed at slab rate.
Peer Comparison
Hawkins vs Indian Kitchenware Peers
| Company | Div Yield | Payout | ROE | ROCE | Debt |
|---|---|---|---|---|---|
| Hawkins Cookers | 1.51% | 56.4% | 31.7% | 41.0% | ₹29 Cr |
| TTK Prestige | 0.86% | 23.8% | 18.8% | 24.5% | ₹89 Cr |
| Butterfly Gandhimathi | Nil | Nil | Not Disclosed | Not Disclosed | Not Disclosed |
| Stove Kraft | Nil | Nil | Not Disclosed | Not Disclosed | Not Disclosed |
Peer data compiled from Screener.in, TipRanks and Business Standard company pages. Butterfly Gandhimathi's last recorded dividend was in November 2021. Figures are indicative and change with market prices.
Hawkins Wins On Every Quality Metric
Against its closest listed comparable, TTK Prestige, Hawkins delivers 31.7% ROE versus 18.8% and 41% ROCE versus 24.5% — on less than a third of TTK's debt. It pays a 76% higher dividend yield (1.51% vs 0.86%) from a payout ratio more than twice as generous (56.4% vs 23.8%).
Butterfly Gandhimathi and Stove Kraft do not currently pay meaningful dividends at all. Within Indian kitchenware, Hawkins is the dividend stock. That is not close.
Sector Context
Consumer durables is a low-yield sector in India. A 1.51% yield is modest against a fixed deposit, but it sits in the top quartile of Indian dividend payers, where the median payer yields around 1.25%.
The trade-off is valuation. Hawkins trades at roughly 10.6 times book value versus TTK Prestige at about 4.6 times. Investors are paying a very high multiple of assets for a business growing revenue at 10% compounded. The dividend does not change that arithmetic — it is a distribution of earnings, not a discount on the entry price.
Promoter Impact Analysis
Who Gets The ₹74.04 Crore
| Holder | Stake | Dividend |
|---|---|---|
| Promoters | 56.03% | ₹41.48 Cr |
| Domestic Institutions (DII) | 15.82% | ₹11.71 Cr |
| Foreign Institutions (FII) | 2.74% | ₹2.03 Cr |
| Public Shareholders | 25.39% | ₹18.80 Cr |
| Government | 0.02% | ₹0.01 Cr |
Shareholding pattern as at March 31, 2026, from Screener.in. Percentages applied to the disclosed ₹74.03 crore outflow.
Reading The Distribution Honestly
The promoter family receives ₹41.48 crore — 56% of the entire dividend. That is the mathematical consequence of owning 56.03% of the company, and it is neither unusual nor improper. Every rupee is paid on identical terms to every shareholder.
Where promoter holding matters analytically is incentive alignment. A family holding 56% has a strong personal interest in a high, rising dividend — and pays tax on it at the same slab rates as everyone else. That aligns them with income-seeking minority shareholders and works against long-horizon investors who would prefer reinvestment at 41% ROCE.
The reassuring signal: promoter holding has been frozen at exactly 56.03% for at least ten years, through Mar-2017 to Mar-2026. No dilution, no selling, no pledging disclosed. The family is not using dividends as an exit route.
Institutional Positioning
Foreign institutional holding rose sharply from 0.19% in March 2024 to 2.86% by March 2025, and has since drifted marginally lower to 2.74%. Domestic institutions hold 15.82%, down from a peak of 17.63% in March 2024. Retail participation has grown steadily — the shareholder count climbed from 15,471 in March 2024 to 18,840 in March 2026, a 22% increase. More small investors are collecting this dividend than at any point in the last decade.
Taxation Analysis
How Dividends Are Taxed In India
Since April 1, 2020, the Dividend Distribution Tax paid by companies was abolished. Dividends are now taxable entirely in the hands of the shareholder, at your applicable income tax slab rate, under the head "Income from Other Sources".
- Slab taxation: The dividend is added to your total income and taxed at your marginal rate — 5%, 20%, 30% and so on, plus applicable surcharge and 4% health and education cess.
- TDS under Section 194: The company deducts tax at source at 10% before paying you, if your total dividend from that company exceeds ₹10,000 in a financial year (the threshold was raised from ₹5,000 with effect from April 1, 2025).
- No PAN: TDS rises to 20% if PAN is not furnished or is inoperative.
- Form 15G / 15H: If your total income is below the taxable limit, you can submit Form 15G (or 15H if you are 60 or above) to the company's registrar, MUFG Intime India, to avoid TDS.
- TDS is not final tax: The 10% deducted is only an advance. If you are in the 30% slab you owe more; if you are below the exemption limit you claim a refund.
- Deduction allowed: Interest expense incurred to earn dividend income is deductible up to 20% of the dividend, under Section 57.
Worked Example A — Standard Illustration
Investor holds 1,000 shares, dividend ₹10 per share, tax slab 30%:
| Gross Dividend | ₹10,000 |
| TDS at 10% | Nil — below ₹10,000 threshold |
| Amount Credited | ₹10,000 |
| Tax at 30% + 4% cess (31.2%) | ₹3,120 |
| Net Dividend After Tax | ₹6,880 |
Worked Example B — Actual Hawkins Investor
Investor holds 1,000 Hawkins shares bought at ₹9,262.85, dividend ₹140 per share, slab 30%:
| Investment Value | ₹92,62,850 |
| Gross Dividend | ₹1,40,000 |
| TDS at 10% (exceeds ₹10,000) | ₹14,000 |
| Amount Credited to Bank | ₹1,26,000 |
| Total Tax at 31.2% | ₹43,680 |
| Balance Payable at Filing | ₹29,680 |
| Net Dividend Retained | ₹96,320 |
| Gross Yield | 1.51% |
| Effective Post-Tax Yield | 1.04% |
The Tax Reality Nobody Highlights
A headline yield of 1.51% becomes 1.04% after tax for a 30% slab investor — and just ₹96.32 of every ₹140 actually stays with you. For an investor in the 5% slab, the post-tax yield is roughly 1.43%. Dividend income is one of the most heavily taxed forms of investment return available to a high-income Indian investor, which is precisely why the reinvestment-versus-distribution question raised in the capital allocation section is not academic.
Tax treatment is general in nature and depends on individual circumstances. ShareBazaar Online is not a tax advisor. Please consult a qualified chartered accountant.
Key Risks
1. Free Cash Flow Deterioration
Free cash flow has fallen from ₹149 crore to ₹69 crore to ₹48 crore across three years while the dividend rose from ₹120 to ₹140. If FY27 FCF does not recover materially, the board must either slow dividend growth or lean further on reserves and borrowings.
2. Inventory and Working Capital Build-Up
Inventory days rose to 114 from 102 and working capital days to 39 from 30. In a seasonal consumer-durables business, excess stock carries obsolescence and markdown risk if demand softens, and it directly consumes the cash needed to pay dividends.
3. Raw Material and Input Cost Inflation
Aluminium and stainless steel are the dominant inputs in pressure cookers and cookware. Hawkins runs an operating margin of about 14.4%. A sharp metal price spike that the company cannot pass through would compress margins quickly and directly threaten the dividend's earnings cover.
4. Structural Growth Ceiling
Five-year sales growth of 10.3% and three-year growth of just 8% in a mature pressure cooker market suggest limited runway. Roughly 83% of revenue historically comes from pressure cookers. A single-category dependence in a category growing at nominal GDP caps long-term dividend growth.
5. Steadily Declining Returns On Capital
ROCE has fallen from 79% in FY16 to 41% in FY26 — a decline in every single intervening period. ROE has slipped from 39.3% in FY22 to 31.7%. The absolute levels remain excellent, but a continued slide would erode the earnings base that funds the dividend.
6. Valuation Risk
The stock trades near 10.6 times book value and about 37 times earnings, having risen roughly 26% since the dividend announcement. A high multiple on a 10%-growth business leaves little cushion. The 1.51% dividend yield provides negligible downside protection against a de-rating.
7. AGM Approval Is A Genuine Condition
The filing is explicit that the dividend is subject to shareholder approval on July 29, 2026. With promoters holding 56.03%, rejection is effectively impossible — but the dividend is legally not payable until that resolution passes, and the record date falls a full week before the vote.
8. Very Low Trading Liquidity
Daily volumes are frequently in the hundreds to low thousands of shares. At a share price above ₹9,000, this is one of the thinnest large-price counters on the exchanges. Investors buying for the dividend may find entry and exit costly, with wide bid-ask spreads around corporate action dates.
What To Monitor
1. FY27 Operating Cash Flow Conversion
The single most important number. Watch whether CFO as a percentage of operating profit recovers from 71% back toward the 90-140% range of FY24 and FY25. This will be visible in the FY27 annual cash flow statement, published around May 2027.
2. Inventory Days In Quarterly Results
Track whether inventory days reverse from 114 back toward the 102-104 range. Falling inventory days alongside growing revenue would confirm the FY26 build was a deliberate pre-season stocking decision rather than slow-moving product.
3. Quarterly EBITDA Margin Trajectory
Q4 FY26 EBITDA margin was 15.2%, down from 15.4% a year earlier despite record revenue — a small contraction at the quarterly level even as the full-year margin expanded. Watch whether Q1 and Q2 FY27 margins hold above 14%.
4. New Product Launch Contribution
Hawkins launched 44 new products in FY26 (after 53 in FY23 and 39 in FY22). Watch whether these translate into revenue growth above the 10% five-year trend, or whether they simply cannibalise existing lines and add inventory complexity.
5. Direction Of Borrowings
Borrowings rose from ₹23 crore to ₹29 crore, the first increase in four years. If FY27 borrowings rise again while the dividend is maintained, the funding gap has become structural rather than a one-year timing effect.
6. Aluminium and Stainless Steel Prices
Input costs feed directly into a 14.4% operating margin. Watch LME aluminium and domestic stainless steel benchmarks alongside Hawkins' quarterly gross margin commentary for evidence of pass-through ability.
7. Capital Expenditure Guidance
CWIP fell from ₹22 crore to ₹12 crore as capacity was commissioned; fixed assets rose 42%. Watch whether FY27 capex slows — which would restore free cash flow — or accelerates again, tightening the dividend funding gap further.
8. Export Performance and Institutional Flows
Roughly 9% of historical revenue came from overseas markets, and export softness was flagged in FY26 commentary. Separately, watch whether DII holding continues drifting down from 17.63% in March 2024 to 15.82% and whether the recent FII entry at 2.74% builds or unwinds.
Conclusion
Positives
- Twelfth consecutive year of dividends, and the eleventh increase in twelve years. Dividend per share has compounded at roughly 8.8% a year for a decade.
- Earnings cover is comfortable at 1.77x, with a payout ratio of 56.4% that leaves genuine headroom.
- FY26 was a record year: revenue ₹1,252.93 crore (+12.3%), PAT ₹131.19 crore (+14.4%), EPS ₹248.10, with positive operating leverage as EBITDA grew 16.8%.
- Balance sheet is exceptionally strong: ₹440 crore of reserves against ₹29 crore of borrowings, interest cover above 30 times.
- ROCE of 41% and ROE of 31.7% place Hawkins far ahead of every listed kitchenware peer.
- Best dividend in the sector by a wide margin — TTK Prestige yields 0.86%, Butterfly and Stove Kraft pay nothing meaningful.
- Debtor days improved to 17 from 20, indicating strong collection discipline and no receivables-quality concerns.
- Promoter holding unchanged at 56.03% for over a decade, with no disclosed pledging or dilution.
Negatives
- Free cash flow of ₹48 crore does not cover the ₹74.04 crore dividend — coverage of just 0.65x, leaving a ₹26 crore gap.
- Cash conversion has deteriorated for two consecutive years, from 140% of operating profit in FY24 to 71% in FY26.
- Only 67% of net profit became operating cash in FY26, down from 158% in FY24.
- Borrowings rose 26% from ₹23 crore to ₹29 crore — the first increase in four years, in the same year the FCF gap opened.
- Inventory days rose to 114 from 102 and working capital days to 39 from 30, absorbing cash.
- Yield compressed from 1.91% to 1.51% as the price ran up 26% between announcement and record date, leaving it 19% below the ten-year average yield of 1.87%.
- ROCE has declined every year for a decade, from 79% to 41%.
- Three-year sales growth of 8% is slower than the five-year and ten-year rates — growth is decelerating, not accelerating.
- Post-tax yield falls to 1.04% for a 30% slab investor, against a valuation of 10.6 times book.
The Balanced View
Hawkins Cookers is delivering a record dividend from a record year, out of one of the strongest balance sheets in Indian consumer durables. Nothing about this announcement suggests distress.
What it does suggest is a slow tightening. Three years ago the company generated ₹149 crore of free cash and paid out ₹120 per share. This year it generated ₹48 crore and is paying ₹140. Reserves of ₹440 crore can absorb that gap for years — but a gap being absorbed is different from a gap that does not exist.
Whether that matters depends entirely on what you own this stock for. An income investor gets a reliable, growing, sector-leading payout — worth 1.04% after tax at a 30% slab. A long-horizon compounder should ask why a business earning 41% on capital is distributing 56% of its profits into slab-rate taxation instead of reinvesting. Both readings are supported by the same numbers. We have laid out both, and the decision is yours.
Frequently Asked Questions
What dividend has Hawkins Cookers announced for FY26?
What is the Hawkins Cookers dividend yield?
What is the record date for the Hawkins Cookers dividend?
What is the ex-dividend date for Hawkins Cookers?
By when do I need to buy Hawkins shares to receive this dividend?
When will the Hawkins Cookers dividend be paid?
Who is eligible to receive this dividend?
How will this dividend be taxed in my hands?
Is the Hawkins Cookers dividend sustainable?
What is Hawkins Cookers' dividend history?
What should investors monitor after this dividend?
How does Hawkins' dividend compare with TTK Prestige and other kitchenware peers?
How much of this dividend goes to the promoters?
Will the share price fall on the ex-dividend date?
What were Hawkins Cookers' FY26 financial results?
Disclaimer
This article is published by ShareBazaar Online for informational and educational purposes only. It does not constitute investment advice, a recommendation, or an offer to buy or sell any security. ShareBazaar Online does not provide buy, sell or hold recommendations.
Company-specific dividend details are sourced from Hawkins Cookers Limited's Regulation 42 intimation to BSE Limited dated July 4, 2026, and its audited FY26 results filing dated May 28, 2026. Market prices, financial ratios, cash flow data, shareholding patterns and peer comparisons are sourced from publicly available third-party platforms including BSE, NSE, Screener.in, Trendlyne, ICICI Direct, Investing.com and Equitymaster, and are stated as at the dates indicated. Market prices change continuously; figures quoted here may be stale by the time you read this.
The dividend is subject to shareholder approval at the 66th Annual General Meeting on July 29, 2026 and is not guaranteed until that resolution is passed. All computed ratios in this article are derived by ShareBazaar Online from the underlying reported figures and may differ from calculations published elsewhere due to methodology.
Tax commentary is general in nature, based on Indian income tax provisions as understood at the time of writing, and does not account for individual circumstances, residency status, or subsequent amendments. Please consult a qualified chartered accountant or registered investment adviser before acting.
Investments in securities markets are subject to market risks. Read all related documents carefully before investing. Past dividend performance is not indicative of future dividends. ShareBazaar Online, its authors and affiliates accept no liability for any loss arising from the use of this information.