
Dividend Snapshot
Company Identity
Dividend Particulars
Scale of the Payout
Yield & Coverage
Basis of calculation: Dividend outflow = ₹7.00 × 19,53,75,594 shares = ₹136.76 crore. Yield at latest CMP uses ₹627 (Finology Ticker, July 2026). Yield at announcement uses ₹727 (5paisa, close of 29 May 2026, the first trading session after the 28 May board meeting). Payout ratios use FY26 consolidated profit attributable to owners of ₹175 crore and standalone profit of ₹264 crore, both from the audited results filed with the exchanges on 28 May 2026.
Dividend Announcement Summary
What The Board Actually Approved
At a board meeting held on Thursday, 28 May 2026 — which commenced at 12:15 p.m. and concluded at 1:50 p.m. — the Board of Directors of Graphite India Limited approved the audited standalone and consolidated financial results for the year ended 31 March 2026 and recommended a dividend of ₹7 per equity share of face value ₹2 each on 19,53,75,594 equity shares.
The recommendation is subject to approval of members at the 51st Annual General Meeting. The company stated that the dividend will be paid or dispatched to shareholders within 15 days from the date of the AGM.
Also In The Same Filing
- Statutory auditors S.R. Batliboi & Co. LLP issued an unmodified opinion on both standalone and consolidated financial statements.
- The CFO filed a declaration under Regulation 33(3)(d) confirming the unmodified audit opinion.
- Re-appointment of Mrs Sudha Krishnan (DIN: 0002885630) as Non-Executive Independent Director for a second five-year term from 1 December 2026 to 30 November 2031, subject to shareholder approval.
Management Commentary
Not Disclosed by Company. The 28 May 2026 outcome-of-board-meeting filing contains no management commentary, no earnings call transcript reference, and no stated rationale for reducing the dividend from ₹11 to ₹7.
The filing also contains no explicit dividend distribution policy target. Investors are left to infer the rationale from the financial statements themselves — which is what the rest of this analysis does.
Key Dates Timeline
| Event | Date | Status |
|---|---|---|
| Board Meeting / Announcement | Thursday, 28-05-2026 | Completed |
| Last Day To Buy For Eligibility | Friday, 17-07-2026 | Passed |
| Ex-Dividend Date | Monday, 20-07-2026 | Passed |
| Record Date | Monday, 20-07-2026 | Closed |
| Tax Documentation Cut-off | 25-07-2026 (11:59 p.m. IST) | Upcoming |
| E-Voting Cut-off Date | 28-07-2026 | Upcoming |
| Remote E-Voting Window | 01-08-2026 to 03-08-2026 | Upcoming |
| 51st AGM (VC/OAVM, 10:45 a.m.) | Tuesday, 04-08-2026 | Upcoming |
| Payment / Dispatch Deadline | On or before 19-08-2026 | Upcoming |
Why Ex-Date And Record Date Are The Same
Indian equity markets moved to a T+1 settlement cycle, meaning a trade settles one working day after it is executed. Under T+1 the ex-date and the record date fall on the same calendar day. To have been on the register on Monday 20 July 2026, you needed to have bought on or before Friday 17 July 2026. Anyone who bought on 20 July itself did not qualify.
Exact Payment Date
A specific payment date is Not Disclosed by Company. The company has committed only to paying within 15 days of the AGM. With the AGM on 4 August 2026, the outer limit is 19 August 2026. For context, the previous two dividends were credited on 31 August 2025 and 30 August 2024 (source: TipRanks dividend history), so the earlier commitment this year is a modest positive on timing.
Dividend Yield Analysis
The Two Yield Numbers
Yield at announcement — 0.96%
₹7.00 ÷ ₹727 × 100 = 0.96%. The stock closed at ₹727 on 29 May 2026, the session after the board meeting (source: 5paisa).
Yield at latest price — 1.12%
₹7.00 ÷ ₹627 × 100 = 1.12%. Latest quoted close ₹627 (source: Finology Ticker, July 2026).
Yield Reality Check — Read This Carefully
The yield has gone up from 0.96% to 1.12% since the announcement. That is not because the dividend increased. It is because the share price fell roughly 13.8% over the same period, from ₹727 to ₹627.
A rising yield driven by a falling price is a very different signal from a rising yield driven by a rising dividend. Here the dividend was cut 36.4% and the price fell. Both moved the wrong way for a shareholder; the yield optics simply happen to improve because the denominator fell faster in percentage terms after the cut.
Historical Yield Context
| Ex-Date Year | Dividend / Share | Indicative Yield | Comment |
|---|---|---|---|
| 2026 | ₹7.00 | 1.12% | Cut year |
| 2025 | ₹11.00 | 1.79% | Flat vs prior year |
| 2024 | ₹11.00 | Not Disclosed by Company | Peak payout era |
| 2023 | ₹8.50 | Not Disclosed by Company | Recovery year |
| 2022 | ₹10.00 | Not Disclosed by Company | Cyclical upswing |
2025 yield of 1.79% sourced from TipRanks. Historical yields for earlier years are not disclosed by the company in the 28 May 2026 filing and are not stated here to avoid retro-fitting numbers that cannot be verified from a primary source.
What A 1.12% Yield Actually Means For You
On an investment of ₹1,00,000 in Graphite India at ₹627 per share (roughly 159 shares), the gross annual dividend works out to about ₹1,113. For an investor in the 30% tax bracket, the post-tax amount is roughly ₹766. That is materially below a bank fixed deposit. This is not a stock that a genuine income-seeking investor would hold for the dividend alone — the dividend is a by-product of a cyclical commodity business, not the investment case.
Dividend History Analysis
Dividend Track Record
| Ex-Date | Record Date | Payment Date | Amount / Share | Type |
|---|---|---|---|---|
| 20-07-2026 | 20-07-2026 | By 19-08-2026 | ₹7.00 | Final |
| 17-07-2025 | 17-07-2025 | 31-08-2025 | ₹11.00 | Annual |
| 19-07-2024 | 19-07-2024 | 30-08-2024 | ₹11.00 | Annual |
| 20-07-2023 | 20-07-2023 | 30-08-2023 | ₹8.50 | Annual |
| 25-07-2022 | 26-07-2022 | 20-08-2022 | ₹10.00 | Annual |
| 09-08-2021 | 10-08-2021 | 19-09-2021 | ₹5.00 | Annual |
| 23-03-2020 | 25-03-2020 | 31-03-2020 | ₹2.00 | Interim |
| 20-06-2019 | 21-06-2019 | 15-07-2019 | ₹35.00 | Semi-Annual |
| 15-11-2018 | 16-11-2018 | 28-11-2018 | ₹20.00 | Interim |
| 26-07-2018 | 27-07-2018 | 21-08-2018 | ₹12.00 | Semi-Annual |
| 15-02-2018 | 16-02-2018 | 23-02-2018 | ₹5.00 | Semi-Annual |
Historical dividend dates and amounts sourced from TipRanks dividend history for GRAPHITE. Face value ₹2 throughout the period shown. FY26 row from the company's 28 May 2026 filing and the record-date intimation.
Classification: Cyclical Payer
Graphite India is a Cyclical Payer, not a Consistent Payer. The pattern is unmistakable when you line up the numbers: ₹55 in the FY19 super-cycle, collapsing to ₹2 in FY20, then a slow climb back to ₹11, and now a cut to ₹7. That is a 27x swing between peak and trough within seven years.
The company has never suspended its dividend entirely in the period shown, which is a genuine credit. But the per-share amount tracks the graphite electrode price cycle almost exactly, and investors should not model it as a stable income stream.
Cuts, Special Dividends, Suspensions
- Dividend cuts: Two major cuts in the period — FY20 (₹35+₹20 down to ₹2) and now FY26 (₹11 down to ₹7).
- Special dividends: None explicitly labelled as special. The large FY19 payouts were declared as interim and semi-annual dividends, not specials.
- Suspensions: None recorded in the last ten years.
- Frequency change: The company moved from semi-annual/quarterly payouts (2018-19) to a single annual final dividend from FY21 onward. That shift itself signals a more conservative distribution posture.
Financial Performance Analysis
FY26 Consolidated Results (₹ Crore)
| Particulars | FY26 | FY25 | Change |
|---|---|---|---|
| Revenue from Operations | 2,852 | 2,560 | +11.4% |
| Other Income | 174 | 438 | −60.3% |
| Total Income | 3,026 | 2,998 | +0.9% |
| Total Expenses | 2,771 | 2,407 | +15.1% |
| PBT before Exceptional Item | 255 | 591 | −56.9% |
| Exceptional Item | (11) | — | — |
| Profit Before Tax | 244 | 591 | −58.7% |
| Profit After Tax | 171 | 458 | −62.7% |
| PAT — Owners of Parent | 175 | 462 | −62.1% |
| Basic EPS (₹) | 8.97 | 23.65 | −62.1% |
| Total Equity | 5,856 | 5,867 | −0.2% |
Operating Leverage Analysis — Revenue Up, Profit Down
This is the single most important thing in the FY26 numbers. Revenue rose 11.4% but profit fell 62.7%. That is negative operating leverage — the business grew and earned less while doing it. Here are the exact reasons, with percentages.
| Cost Line (₹ Cr) | FY26 | FY25 | Change | vs Revenue (+11.4%) |
|---|---|---|---|---|
| Consumption of Stores & Spare Parts | 259 | 210 | +23.3% | Grew 2.0x faster |
| Other Expenses | 384 | 313 | +22.7% | Grew 2.0x faster |
| Power and Fuel | 392 | 339 | +15.6% | Grew faster |
| Cost of Materials Consumed | 1,152 | 1,059 | +8.8% | Grew slower — positive |
| Employee Benefits Expense | 267 | 293 | −8.9% | Fell — positive |
| Finance Costs | 25 | 11 | +127.3% | More than doubled |
| Depreciation & Amortisation | 95 | 90 | +5.6% | Grew slower |
The Real Culprit: Treasury Income, Not Operations
Strip out other income and non-operating items and you get a cleaner picture of the underlying business:
FY26 core operating profit = 255 + 25 + 95 − 174 = ₹201 crore
FY25 core operating profit = 591 + 11 + 90 − 438 = ₹254 crore
Core operating profit fell 20.9% even as revenue rose 11.4%.
Core operating margin: 7.0% in FY26 vs 9.9% in FY25 — a compression of roughly 290 basis points.
The headline 62.7% profit collapse is largely a treasury story. But the underlying manufacturing business also got worse, just less dramatically. Both matter.
Where The Other Income Went
Note 6 of the consolidated results breaks this out clearly. Net gains on investments carried at fair value through profit or loss (FVTPL) recognised in Other Income were ₹46 crore in FY26 versus ₹336 crore in FY25. Separately, FVTPL amounts recognised in Revenue from Operations swung from a ₹58 crore gain in FY25 to a ₹47 crore loss in FY26.
In Q4FY26 alone, the company booked a ₹212 crore fair value loss on investments in Other Expenses. That single line explains why a quarter with revenue up 22.5% year-on-year produced a ₹105 crore consolidated loss versus a ₹49 crore profit a year earlier.
Segment Performance (Consolidated, ₹ Crore)
| Segment | FY26 Revenue | FY25 Revenue | FY26 Result | FY25 Result |
|---|---|---|---|---|
| Graphite & Carbon | 2,594 | 2,248 | 164 | 146 |
| Steel | 257 | 227 | 42 | 28 |
| Others | 4 | 88 | (24) | 66 |
| Total Segment Result | — | — | 182 | 240 |
Read across the rows and the story is clear. The two real manufacturing segments both improved — Graphite & Carbon segment result rose from ₹146 crore to ₹164 crore, and Steel rose from ₹28 crore to ₹42 crore. The damage came entirely from "Others", which swung from a ₹66 crore profit to a ₹24 crore loss. The company's own footnote explains this: Others includes mark-to-market losses on investments held in a subsidiary that is a Non-Banking Financial Company.
Cash Flow Analysis
CRITICAL FINDING
Consolidated operating cash flow collapsed 83.6%, from ₹500 crore in FY25 to ₹82 crore in FY26. Against capital expenditure of ₹251 crore, this produces negative free cash flow of ₹169 crore. The FY26 dividend of ₹136.76 crore is not covered by free cash flow at all.
Consolidated Cash Flow Summary (₹ Crore)
| Particulars | FY26 | FY25 | Change |
|---|---|---|---|
| Profit Before Tax | 244 | 591 | −58.7% |
| Operating Profit before WC Changes | 268 | 215 | +24.7% |
| Cash Generated from Operations | 37 | 594 | −93.8% |
| Net Operating Cash Flow (OCF) | 82 | 500 | −83.6% |
| Capex (PPE + Intangibles + CWIP) | (251) | (168) | +49.4% |
| Free Cash Flow (OCF − Capex) | (169) | 332 | Turned negative |
| Dividends Paid | (215) | (215) | Flat |
| Short-term Borrowings (Net) | +178 | (6) | Swung to inflow |
| Closing Cash & Equivalents | 22 | 109 | −79.8% |
Operating Cash Flow vs Net Profit
FY26 OCF of ₹82 crore against PAT of ₹171 crore gives a cash conversion ratio of just 0.48x. For comparison, FY25 delivered ₹500 crore OCF on ₹458 crore PAT — a ratio of 1.09x.
A ratio below 1.0x means reported profit is not converting into bankable cash. Two consecutive years at 0.48x would be a serious problem. One year can be explained by working capital timing — but it needs explaining, and the company has not explained it.
Note the tell-tale sign inside the statement: operating profit before working capital changes actually improved 24.7% to ₹268 crore. Everything that went wrong went wrong in working capital.
Receivables Growth vs Revenue Growth
This is where the ₹557 crore swing in cash generation came from.
Trade receivables: ₹667 crore (FY26) vs ₹468 crore (FY25) = +42.5%
Revenue from operations: +11.4%
Receivables grew 3.7 times faster than revenue.
Implied days sales outstanding: 85 days in FY26 vs 67 days in FY25 — an increase of about 18 days.
What this implies: the company is either extending longer credit to win volume in a competitive electrode market, or customers are paying slower. The cash flow statement shows the direct impact — a ₹192 crore cash outflow from the increase in trade receivables. On top of that, the company recognised a ₹7 crore provision for doubtful debts in FY26 against nil in FY25. That is a small number, but the direction is worth watching.
How Is This Dividend Actually Being Funded?
The specification for this analysis requires a direct answer to a direct question. Here it is, in order of likelihood based on the FY26 cash flow statement:
Not from current earnings cash. Free cash flow was negative ₹169 crore. There was no surplus operating cash to distribute.
Primarily from the investment portfolio. The company holds ₹4,063 crore in current and non-current investments. Redeeming a small slice of this covers the ₹136.76 crore dividend many times over. This is the realistic funding source.
Partly through borrowings — and this already happened last year. In FY26, short-term borrowings rose by a net ₹178 crore while the company paid out ₹215 crore in dividends and spent ₹251 crore on capex. Consolidated borrowings went from ₹172 crore to ₹367 crore, and closing cash fell from ₹109 crore to ₹22 crore. Whether or not the company intends it as such, borrowed money and dividend payments were flowing through the same balance sheet in the same year.
Not from asset sales. Proceeds from sale of property, plant and equipment were only ₹1 crore. Asset disposals played no meaningful role.
The honest summary: Graphite India can comfortably pay this dividend because it is sitting on a very large investment portfolio. But it is not paying it out of the cash the operating business produced this year. Those are two different things, and most dividend coverage on this stock will not draw the distinction.
Balance Sheet Strength
Cash & Investments (Consolidated, 31-Mar-2026)
Coverage Ratios
Debt Position — Rising, But From A Low Base
Consolidated borrowings rose from ₹172 crore to ₹367 crore, an increase of 113%.
All of it is short-term; the company has zero long-term borrowings.
Finance costs more than doubled from ₹11 crore to ₹25 crore. Note that ₹15 crore of the standalone finance cost is a one-off — see the litigation note below.
Debt-to-equity is 0.06x. In absolute terms this remains a very lightly levered company.
Return Ratios
Computed by ShareBazaar Online from the audited consolidated results. A 3.0% ROE on a ₹5,856 crore equity base is the mathematical consequence of holding roughly ₹4,109 crore of the balance sheet in financial investments rather than operating assets.
Two Balance Sheet Items Worth Flagging
1. The Maharashtra electricity duty ruling. On 25 March 2026, the Supreme Court upheld the State of Maharashtra's levy of electricity duty on captive power generation for the period April 2000 to April 2005 at one of the company's plants, reversing an earlier favourable High Court decision. The company recognised additional interest of ₹15 crore under finance costs. This is a settled adverse outcome, not a contingency — the money is gone.
2. The ₹417 crore tax refund overhang. The company received refunds of ₹417 crore in earlier years relating to assessment years 2018-19 and 2019-20, and has appealed against the short allowance of deductions claimed. Pending disposal of these appeals, no credit or adjustment has been made on a prudent basis. In plain language: ₹417 crore of cash the company already holds could theoretically be subject to reversal depending on how the appeals go. The prudent accounting treatment is the right one, but investors should know this sits in the background.
3. Inventory write-downs are improving. The net realisable value write-down on inventory fell from ₹113 crore at 31 March 2025 to ₹47 crore at 31 March 2026 on a consolidated basis. That is a genuine operational positive and suggests electrode pricing has firmed.
Dividend Sustainability Analysis
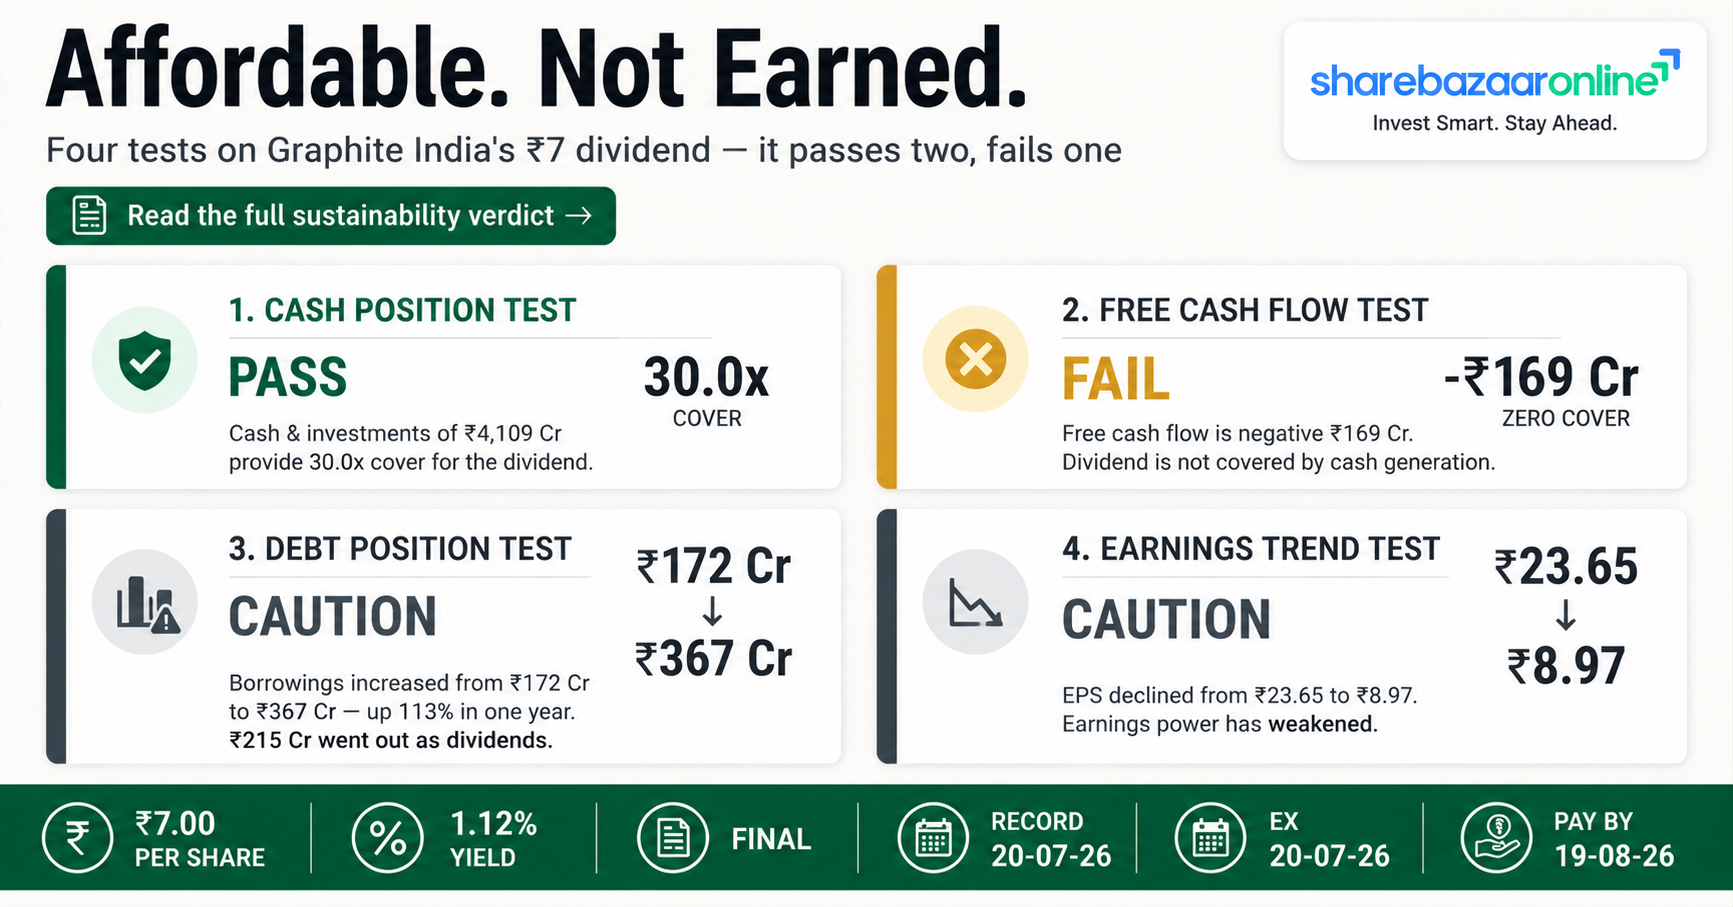
CLASSIFICATION: MODERATELY SUSTAINABLE
The ₹7 dividend is affordable because of the balance sheet, not earned from this year's cash generation. It can be paid for many years from the ₹4,109 crore investment pool. Whether it should be is a capital allocation question, not a solvency question.
Test 1 — Cash Position
PASS — STRONGLY
₹4,109 crore of cash and investments against a ₹136.76 crore dividend gives 30.0x cover. The company could pay this dividend for 30 consecutive years from existing liquid resources without earning a rupee. On this test alone the dividend is unquestionably affordable.
Test 2 — Free Cash Flow
FAIL
FY26 free cash flow was negative ₹169 crore. FCF coverage of the dividend is therefore zero. Even at the operating cash flow level, ₹82 crore covers only 0.60x of the ₹136.76 crore payout. This is the weakest link in the entire analysis and the reason the classification is not "Sustainable".
Test 3 — Debt Position
CAUTION
Borrowings more than doubled from ₹172 crore to ₹367 crore in the same year the company paid out ₹215 crore in dividends. Debt is rising while dividends are being paid — the exact pattern this analysis is designed to flag. The mitigating fact is that ₹367 crore of gross debt against ₹4,109 crore of investments is trivial in absolute terms.
Test 4 — Earnings Trend
DECLINING
Consolidated EPS fell from ₹23.65 to ₹8.97. Q4FY26 was an outright loss of ₹105 crore. The dividend cover ratio narrowed from 2.15x to 1.28x in a single year. If FY27 earnings fall again and treasury gains do not return, ₹7 becomes hard to justify from earnings.
Reading The Cut As A Signal
There is a constructive way to read the ₹11 to ₹7 reduction. The board could have held ₹11 — cover would still have been 0.82x on consolidated EPS and the balance sheet would have absorbed it easily. Instead they cut by 36.4%, reducing outflow by roughly ₹78 crore.
That is a board choosing to match the payout to a weaker earnings year rather than defend an optical headline number. Combined with the 49.4% increase in capex to ₹251 crore, the reading is that management is redirecting cash from distribution toward the business. For a long-term shareholder in a capital- intensive cyclical, that is arguably the better decision — even though it feels worse today.
The counter-argument is equally valid: a board sitting on ₹4,109 crore of investments cutting a ₹136 crore dividend looks less like prudence and more like a signal that management sees a genuinely difficult FY27. The company has offered no commentary either way, which is itself a disclosure gap.
Peer Comparison
Graphite India vs HEG Limited — FY26
| Metric | Graphite India | HEG Limited |
|---|---|---|
| FY26 Dividend Per Share | ₹7.00 | ₹3.40 |
| Face Value | ₹2 | ₹2 |
| Dividend % on Face Value | 350% | 170% |
| Record Date | 20-07-2026 | 22-07-2026 |
| AGM Date | 04-08-2026 | 29-07-2026 |
| FY26 Revenue from Operations | ₹2,852 Cr | ₹2,568.50 Cr |
| FY26 Net Profit | ₹171 Cr | ₹180.72 Cr |
| Approx. Share Price | ₹627 | ₹515.80 |
| Approx. Dividend Yield | 1.12% | 0.66% |
| Net Cash / (Debt) Position | Net cash ₹3,742 Cr | Not Disclosed by Company |
| ROE (FY26) | 3.0% | Not Disclosed by Company |
HEG figures sourced from its 29 April 2026 results filing and record-date intimation as reported by TipRanks, Scanx and Multibagg. HEG share price from Google Finance related-stocks data. Some HEG ratios are not disclosed in the sources reviewed and are marked accordingly rather than estimated.
What The Comparison Shows
The two listed Indian graphite electrode makers had almost identical FY26 revenue — ₹2,852 crore vs ₹2,568.50 crore — and almost identical net profit — ₹171 crore vs ₹180.72 crore. Both are living through the same downcycle in electrode pricing and both saw profits compress.
The difference is distribution policy. Graphite India pays a yield roughly 70% higher than HEG at 1.12% versus 0.66%. HEG has historically run a much lower payout ratio — investing.com reports its payout ratio at around 10.7% — and is currently funding a subsidiary expansion through TACC Limited.
Sector Yield Benchmark
TipRanks places the Basic Materials sector average dividend yield at approximately 1.735%. On that benchmark, Graphite India's 1.12% yield sits below its sector average, and HEG's 0.66% sits well below.
The takeaway for anyone screening on yield: neither Indian graphite electrode stock is a high-yield instrument. Graphite India's 350% headline on a ₹2 face value sounds enormous and means almost nothing. The number that matters is 1.12%.
Promoter Impact Analysis
Shareholding Pattern
Shareholding pattern as reported by ICICI Direct. Note that Share.Market reports a slightly different split (promoters 65.30%, FII 6.70%, DII 1.90%). Investors should verify against the latest exchange-filed shareholding pattern for a precise figure.
Promoter Dividend Income
Distribution Impact — Who Benefits
Promoter benefit. At a combined 65.34% holding, the promoter group led by Chairman K. K. Bangur receives roughly ₹89.36 crore — nearly two-thirds of the entire distribution. Last year, at ₹11 per share, the promoter group's share was around ₹140 crore. The dividend cut costs the promoters about ₹51 crore in personal income, which is worth noting: the board that recommended this cut is dominated in economic interest by the people most affected by it. That is a mild argument that the cut was made for business reasons rather than to shortchange minorities.
Minority shareholder benefit. The remaining 34.66% — institutions and public together — receive ₹47.40 crore. Individual retail shareholders holding 16.54% receive about ₹22.62 crore between them.
The structural point. With promoter holding above 65%, any dividend from Graphite India is predominantly a transfer to the promoter group. This is not a criticism — it is the arithmetic of a closely held company, and dividends are the fairest way to distribute since every share gets the same rupee amount. But it is relevant context when assessing capital allocation. A buyback, by contrast, would have benefited continuing shareholders disproportionately and could have been done at a discount to the ₹300 book value.
Capital Allocation Analysis — What Else Could The Board Have Done?
Graphite India has ₹4,109 crore of cash and investments and a market capitalisation of roughly ₹12,250 crore at ₹627 per share. That means over one-third of the market value of the company is a financial portfolio, not an electrode business. Here are the alternatives to a ₹136.76 crore dividend, quantified:
Reduce debt. Total borrowings are ₹367 crore. The company could have eliminated all debt with 8.9% of its investment portfolio and saved the entire ₹25 crore finance cost. It chose not to, which suggests the investments are earning more than the cost of debt — a rational carry trade, but one that adds mark-to-market volatility, as FY26 demonstrated painfully.
Increase capex. Capex already rose 49.4% to ₹251 crore, or roughly 6.1% of the investment pool. Given the negative operating leverage seen this year, a stronger case exists for capacity modernisation and cost-out capex than for another year of maximum distribution.
Conduct a buyback. With shares at ₹627 against book value of about ₹300, a buyback would be at 2.1x book. Buying back stock at twice book value while ROE is 3.0% would destroy value. Not conducting a buyback was the right call.
Retain the cash. The strongest argument. With ROE at 3.0% and FCF negative, retaining ₹136.76 crore costs shareholders very little in foregone yield and provides a buffer for a cyclical trough. The counterpoint is that the company already retains ₹4,109 crore and has not deployed it productively — adding to an under-earning pile is not obviously better than returning it.
The genuine unanswered question is not whether the dividend is affordable. It is why a manufacturer holds ₹4,109 crore in financial investments — including a Non-Banking Financial Company subsidiary whose mark-to-market losses swung the consolidated result by hundreds of crores. That is the capital allocation issue that deserves scrutiny at the 4 August AGM.
Taxation Analysis
How Dividend Tax Works In India Now
Since the Finance Act 2020 abolished Dividend Distribution Tax, dividend income is taxable in the hands of the shareholder. There is no separate concessional rate. The dividend is added to your total income under "Income from Other Sources" and taxed at your applicable slab rate, plus applicable surcharge and 4% health and education cess.
This is confirmed in Graphite India's own AGM communication, which states that under the Income-tax Act dividend income is taxable in the hands of shareholders and the company is required to deduct tax at source at prescribed rates, varying by residential status and documents submitted.
TDS Rules — Resident Shareholders
- TDS under Section 194 at 10% where PAN is registered and valid.
- TDS at 20% where PAN is not registered, is invalid, or is not linked to Aadhaar.
- No TDS if aggregate dividend from the company in a financial year does not exceed ₹10,000 (threshold raised from ₹5,000 with effect from 1 April 2025).
- Nil or lower deduction available on submission of Form 15G (individuals below 60) or Form 15H (senior citizens), subject to eligibility.
- Graphite India has set 25 July 2026, 11:59 p.m. IST as the deadline for uploading PAN, residential status and category documents.
TDS Rules — Non-Resident Shareholders
- TDS under Section 195, generally at 20% plus applicable surcharge and cess.
- A lower rate may apply under the relevant Double Taxation Avoidance Agreement (DTAA).
- To claim DTAA benefit, the shareholder must furnish a valid Tax Residency Certificate, Form 10F, and a no-permanent-establishment declaration.
- Without complete documentation, the company will deduct at the higher domestic rate.
Worked Example A — The Standard Illustration
Assumptions: Investor owns 1,000 shares. Dividend is ₹10 per share. Investor's tax slab is 30%.
| Gross Dividend (1,000 × ₹10) | ₹10,000 |
| TDS at 10% (dividend does not exceed ₹10,000 threshold) | ₹0 |
| Amount Credited to Bank | ₹10,000 |
| Final Tax at 30% + 4% cess = 31.2% | ₹3,120 |
| Net Dividend After Tax | ₹6,880 |
| Investment Value at ₹627/share | ₹6,27,000 |
| Gross Yield | 1.60% |
| Effective Post-Tax Yield | 1.10% |
Note the trap: at exactly ₹10,000 no TDS is deducted because the law says "exceeds ₹10,000". The full tax is still payable by the shareholder through advance tax or self-assessment. Many retail investors miss this and receive an interest demand later.
Worked Example B — Actual Graphite India Numbers
Assumptions: Investor holds 1,000 GRAPHITE shares on the record date. Dividend is ₹7 per share. Investor's tax slab is 30%. Purchase price assumed at ₹627.
| Gross Dividend (1,000 × ₹7) | ₹7,000 |
| TDS (below ₹10,000 threshold, PAN valid) | ₹0 |
| Tax Payable at 31.2% | ₹2,184 |
| Net Dividend After Tax | ₹4,816 |
| Capital Deployed | ₹6,27,000 |
| Gross Yield | 1.12% |
| Effective Post-Tax Yield | 0.77% |
Highlighting the negative: a 30%-bracket investor keeps ₹4,816 on a ₹6.27 lakh investment. That is a 0.77% post-tax return — less than a savings bank account. Anyone buying GRAPHITE shortly before the record date purely to capture the dividend would also have seen the share price adjust downward on the ex-date, making the exercise economically pointless before tax and negative after it.
Threshold Effect — Where It Starts To Bite
At ₹7 per share, the ₹10,000 TDS threshold is crossed at 1,429 shares. Below that, no TDS. At or above it, 10% TDS applies to the entire dividend, not just the excess. An investor holding 1,500 shares receives ₹10,500 gross, suffers ₹1,050 TDS, and is credited ₹9,450 — then owes a further ₹2,226 at final assessment for a 30%-bracket taxpayer.
Key Risks
1. Treasury Portfolio Volatility
The company holds ₹4,109 crore in cash and investments, a large part carried at fair value through profit or loss. In Q4FY26 alone this produced a ₹212 crore mark-to-market loss. Consolidated FVTPL gains swung from +₹394 crore in FY25 to broadly nil in FY26. Reported earnings are now driven as much by market movements as by electrode sales, and that volatility is entirely outside management's control.
2. Receivables and Working Capital Stress
Trade receivables jumped 42.5% to ₹667 crore against revenue growth of just 11.4%, adding roughly 18 days to the collection cycle. Cash generated from operations fell 93.8% to ₹37 crore. If collections do not normalise in FY27, the company will need to keep borrowing to bridge working capital, further increasing finance costs which already more than doubled.
3. Loss-Making Overseas Subsidiaries
The auditor's Other Matter paragraph discloses that subsidiaries audited by other auditors reported a total net loss after tax of ₹100.30 crore for FY26 on total assets of ₹470.15 crore. The German entities and General Graphene Corporation continue to drag on consolidated results — visible in the gap between standalone PAT of ₹264 crore and consolidated PAT of ₹171 crore. Bavaria Electrodes GmbH has been in liquidation since October 2022.
4. Commodity Cycle and Input Cost Exposure
Graphite electrodes are a derived-demand commodity tied to electric arc furnace steel production. Needle coke, the key raw material, is priced globally and is not hedgeable in any practical sense. In FY26, power and fuel costs rose 15.6% and stores and spares rose 23.3% against revenue growth of 11.4%. The company has limited pricing power to pass these through in a soft market — evidenced by the 290 basis point compression in core operating margin.
5. Contingent Tax Exposure of ₹417 Crore
The company received income tax refunds of ₹417 crore for assessment years 2018-19 and 2019-20 and has appeals pending against the short allowance of deductions claimed. No credit or adjustment has been made pending disposal of the appeals. An adverse outcome would be material relative to FY26 consolidated profit of ₹171 crore.
6. Regulatory and Litigation Risk
The Supreme Court's 25 March 2026 ruling upholding Maharashtra's electricity duty on captive power generation cost the company ₹15 crore in additional interest and reversed a favourable High Court decision after two decades of litigation. Separately, the New Labour Codes notified on 21 November 2025 produced an incremental charge of ₹27 crore, partly reversed to a net ₹11 crore exceptional item after CTC restructuring. Both illustrate ongoing regulatory cost exposure.
7. Low Return on Equity
FY26 consolidated ROE of 3.0% and ROCE of 4.3% are below what a shareholder could earn from a government security. The structural cause is that roughly 70% of total assets sit in financial investments rather than in operating capacity. Until that capital is either deployed or returned, return ratios will stay depressed regardless of how the electrode business performs.
8. Dividend Not Yet Legally Approved
The ₹7 dividend remains a board recommendation subject to shareholder approval at the 51st AGM on 4 August 2026. Until members pass the resolution, no legal entitlement exists. Shareholder approval of a board-recommended final dividend is close to a formality in Indian practice — particularly with promoter holding above 65% — but it is not automatic, and members can approve a lower amount though not a higher one.
What To Monitor
1. Q1FY27 Operating Cash Flow
The single most important number in the next results. Watch whether cash generated from operations recovers from the ₹37 crore FY26 level. Companies do not publish quarterly cash flow statements in India, so the proxy is the half-yearly statement due with September 2026 results. A second consecutive year of sub-1.0x cash conversion would change the sustainability classification from Moderately Sustainable to Unsustainable.
2. Trade Receivables and Days Sales Outstanding
Track whether receivables come down from ₹667 crore and whether DSO retraces toward the 67-day FY25 level from the current 85 days. Also watch the provision for doubtful debts line, which appeared at ₹7 crore in FY26 against nil in FY25. A rising provision alongside rising receivables would indicate genuine credit quality deterioration rather than timing.
3. Graphite & Carbon Segment Margin
The core segment delivered a ₹164 crore result on ₹2,594 crore of revenue — a 6.3% segment margin, marginally below FY25's 6.5% (₹146 crore on ₹2,248 crore). Absolute profit rose, but margin did not. Watch whether volume growth converts into margin expansion in FY27 or whether the company is buying revenue with price. The falling NRV inventory write-down, from ₹113 crore to ₹47 crore, hints at firming realisations and is worth tracking each quarter.
4. Short-Term Borrowings Trajectory
Borrowings rose from ₹172 crore to ₹367 crore in FY26. Watch whether this reverses once the dividend is paid in August 2026 or continues climbing. Debt rising in a year of falling profits and negative free cash flow is a pattern worth watching closely, even from a very low base. The related metric is finance cost, which should fall back toward ₹10 crore in FY27 once the one-off ₹15 crore electricity duty interest drops out.
5. Overseas Subsidiary Losses
Subsidiaries audited by other auditors lost ₹100.30 crore in FY26. Watch for any announcement on restructuring, sale or closure of the German operations or General Graphene Corporation. Recent news flow has referenced updates on the company's German operations. A resolution here would immediately narrow the ₹93 crore gap between standalone PAT of ₹264 crore and consolidated PAT of ₹171 crore.
6. Capital Allocation Signals At The AGM
The 51st AGM on 4 August 2026 is the first forum where management must address the ₹4,109 crore investment portfolio, the NBFC subsidiary's mark-to-market exposure, and the rationale for the dividend cut. Watch the AGM notice and any subsequent disclosure for a stated dividend distribution policy, a capex roadmap, or a treasury policy. Continued silence on all three would itself be informative.
7. Capex Execution Against ₹251 Crore Run-Rate
Capex rose 49.4% to ₹251 crore in FY26 while capital work-in-progress stayed roughly flat at ₹61 crore, implying projects are being commissioned rather than accumulating. Watch whether FY27 capex sustains at this level and whether it is directed at capacity, cost reduction or maintenance. Capex funded by a shrinking cash balance rather than operating cash flow is a materially different proposition.
8. Global EAF Steel Capacity Additions
Graphite electrode demand is derived from electric arc furnace steel output. Monitor global and Indian EAF capacity announcements, needle coke pricing, and Chinese electrode export volumes. These upstream indicators lead Graphite India's revenue by two to four quarters and are more predictive of FY28 dividend capacity than anything in the current results.
Conclusion
The Findings, Stated Plainly
Graphite India's FY26 final dividend of ₹7 per share is a 36.4% reduction from last year's ₹11. It costs the company ₹136.76 crore, of which roughly ₹89.36 crore goes to the promoter group. The yield of 1.12% falls below the Basic Materials sector average of about 1.735%, and the post-tax yield for a 30%-bracket investor is 0.77%.
Positives
- Net cash of ₹3,742 crore means the dividend is never in doubt on affordability grounds — cover of 30.0x.
- Both core manufacturing segments improved. Graphite & Carbon result rose from ₹146 crore to ₹164 crore; Steel from ₹28 crore to ₹42 crore.
- Revenue grew 11.4% to ₹2,852 crore — the underlying business is winning volume.
- Employee costs fell 8.9% and cost of materials grew slower than revenue at 8.8%, showing real cost discipline in two of the largest lines.
- Inventory NRV write-down more than halved from ₹113 crore to ₹47 crore, indicating firming electrode realisations.
- Unmodified audit opinion on both standalone and consolidated statements from S.R. Batliboi & Co. LLP.
- Capex up 49.4% to ₹251 crore — cash being redirected to the business rather than distributed.
- Ten years without a dividend suspension, through a brutal cycle.
Negatives
- Free cash flow of negative ₹169 crore. The dividend has zero FCF coverage.
- Cash generated from operations fell 93.8% to ₹37 crore. Cash conversion of 0.48x versus 1.09x last year.
- Receivables up 42.5% against 11.4% revenue growth — DSO stretched by roughly 18 days.
- Consolidated PAT fell 62.7% and EPS fell from ₹23.65 to ₹8.97. Q4FY26 was a ₹105 crore loss.
- Core operating margin compressed 290 basis points to 7.0% — revenue up, operating profit down 20.9%.
- Borrowings more than doubled from ₹172 crore to ₹367 crore while ₹215 crore was paid out in dividends.
- ROE of 3.0% and ROCE of 4.3% — capital is not earning its keep.
- Overseas subsidiaries lost ₹100.30 crore in FY26.
- No management commentary explaining the dividend cut or the treasury losses.
The Question Investors Should Actually Ask
Most coverage of this announcement will lead with "350% dividend". That framing is arithmetically true and analytically useless — it is 350% of a ₹2 face value, which translates to a real yield of 1.12%.
The more useful question is this: Graphite India is a manufacturer whose FY26 profit was determined less by how many electrodes it sold than by how a ₹4,109 crore investment portfolio performed in the market. Revenue grew 11.4% and both operating segments improved — yet the group reported a 62.7% profit collapse and a Q4 loss, almost entirely because treasury gains of ₹394 crore in FY25 did not repeat and a ₹212 crore fair value loss landed in Q4FY26.
An investor in Graphite India is therefore taking two bets simultaneously: one on the global electric arc furnace steel cycle, and one on a portfolio of financial investments they cannot see the composition of. The dividend cut, the negative free cash flow, and the low ROE are all downstream consequences of that structure. Whether that structure suits your objectives is a decision only you can make, ideally after reading the full annual report and consulting a SEBI-registered investment adviser.
Frequently Asked Questions
What dividend has Graphite India announced for FY2025-26?
What is the Graphite India dividend yield in 2026?
What is the record date for the Graphite India dividend?
What was the ex-dividend date and why is it the same as the record date?
When will the Graphite India dividend actually be paid?
Who is eligible to receive this dividend?
How is the Graphite India dividend taxed in my hands?
What will I actually receive after tax on 1,000 shares?
Is the Graphite India dividend sustainable?
Why did Graphite India cut the dividend from ₹11 to ₹7?
What is Graphite India's dividend history over the last ten years?
Why did profit fall 62.7% when revenue rose 11.4%?
How does Graphite India's dividend compare with HEG Limited?
Is the dividend being funded by borrowings?
What should investors monitor from here?
Disclaimer
This article is published by ShareBazaar Online for informational and educational purposes only. It does not constitute investment advice, a recommendation, or an offer or solicitation to buy or sell any security. No buy, sell or hold recommendation is made or implied anywhere in this article.
Financial data has been sourced from Graphite India Limited's audited standalone and consolidated financial results for the year ended 31 March 2026, filed with BSE Limited and the National Stock Exchange of India on 28 May 2026, together with the accompanying auditor's reports and notes. Market prices, shareholding patterns, dividend history and peer data have been sourced from publicly available third-party platforms and are attributed inline where used. All ratios and derived figures marked as computed by ShareBazaar Online are our own calculations from primary filings and may differ from figures computed on other bases.
Market prices change continuously and figures quoted here may be stale by the time you read this. Dividend yields, payout ratios and coverage metrics are point-in-time calculations. The dividend described remains subject to shareholder approval at the 51st Annual General Meeting and is not guaranteed until approved and paid. Past dividend history is not indicative of future dividends, particularly for a cyclical business.
Tax treatment described is general in nature, reflects our understanding of Indian tax law as at the date of publication, and depends entirely on individual circumstances. It is not tax advice. Investments in securities markets are subject to market risks. Please read all scheme-related and offer documents carefully before investing, and consult a SEBI-registered investment adviser and a qualified tax professional before making any investment or tax decision.
ShareBazaar Online, its authors and its affiliates accept no liability for any loss arising from reliance on the contents of this article. Readers should independently verify all figures against the company's original filings on the BSE, NSE and company websites before acting on them.