
Dividend Snapshot – Sanofi India Limited
The 750% dividend headline is calculated on the ₹10 face value, not the market price. Measured against the market price of about ₹3,382 (NSE close, 3 November 2026), the real interim dividend yield is roughly 2.22%. This gap between the face-value percentage and the actual yield is the single most misread number in any dividend announcement.
Company Overview – Sanofi India Limited
Sanofi India Limited (NSE: SANOFI, BSE: 500674, ISIN: INE058A01010) is the listed Indian arm of the French pharmaceutical group Sanofi, present in India for nearly seven decades. After the 2024 separation of its consumer-healthcare business into a separately listed entity, Sanofi India is now a pure-play prescription pharmaceutical company operating in a single reported segment. Its growth engine is the diabetes injectable franchise – Lantus, Toujeo, Apidra and Soliqua – where the company reports a 55% value market share. The promoter group (Sanofi) holds 60.40%, and the company is effectively debt-free with high return ratios (ROCE ~57.5%, ROE ~43%). Understanding this post-demerger structure is essential to reading the Sanofi India dividend correctly, because the revenue base changed materially.
Financial Analysis – Sanofi India Limited
For the quarter ended 30 September 2026, Sanofi India reported revenue from operations of ₹491.7 crore and net profit of ₹116.7 crore, up 54% versus the year-ago quarter (helped by a low base that carried a one-time separation cost in Q3 2025). Profit before exceptional items and tax rose 22% to ₹157.7 crore. For the nine months, revenue was broadly flat at ₹1,401.7 crore (-1.1%), while net profit grew 14.3% to ₹302.8 crore and nine-month EPS reached ₹131.48. The profit growth on flat sales reflects a richer product mix, a provision reversal and an 8% cut in operating expenses – margin expansion rather than volume-led growth.
Sanofi India Limited Dividend History Table
| Year (Ex-Date) | Final | Interim | Special | Total (₹/share) |
|---|---|---|---|---|
| 2026* | ₹48 | ₹75* | – | ₹123 |
| 2025 | ₹117 | ₹75 | – | ₹192 |
| 2024 | ₹117 | ₹50 | – | ₹167 |
| 2023 | ₹194 | – | ₹183 | ₹377 |
| 2022 | ₹181 | – | ₹502 | ₹683 |
| 2021 | ₹125 | – | ₹240 | ₹365 |
| 2020 | ₹106 | – | ₹243 | ₹349 |
| 2019 | ₹66 | – | – | ₹66 |
*2026 row: ₹48 final (ex-date 22 Apr 2026) relates to FY2025; ₹75 interim has an ex/record date of 5 Nov 2026. Grouped by ex-date calendar year. Source: Trendlyne corporate actions.
Expert Commentary – Sanofi India Limited Dividend
The honest read on this interim dividend is that the 750% figure is optics; the ₹75 payout is a routine, well-covered distribution from a cash-rich, debt-free business. The more important story sits in the dividend history: the ₹300–680 per-share payouts of 2020–2023 were inflated by large special dividends funded by brand sales and the consumer-healthcare separation, not by recurring profit. Post-demerger, the normalised run-rate has settled near ₹120–190 a year. Investors anchoring on those old bumper years are comparing against distributions that are unlikely to repeat. On the current profit base, the ongoing Sanofi India dividend looks comfortably sustainable, but the era of outsized specials appears to be over unless another one-off asset monetisation occurs.
Sanofi India Limited Dividend Outlook
Looking ahead, the shape of future Sanofi India dividend payments will likely track two variables: the earnings trajectory of the diabetes injectable franchise and the company's preference for returning surplus cash rather than reinvesting heavily in capex. With the business now debt-free and asset-light, free cash generation typically converts a large share of profit into distributable surplus. A continuation of the interim-plus-final cadence – one payout around the Q3 results and one with the annual results – is the pattern of recent years. The key swing factor is whether management resumes special dividends; absent a fresh one-off event, shareholders should calibrate expectations to the normalised payout rather than the 2020–2023 peak. This is an outlook on cadence, not a forecast of any specific amount, which the company has not disclosed.
Dividend Announcement Summary – Sanofi India Limited
At its board meeting on 29 October 2026, the Board of Directors of Sanofi India Limited declared an interim dividend of ₹75 per equity share of ₹10 face value for the financial year 2026, alongside the unaudited results for the quarter and nine months ended 30 September 2026. Under Regulation 42 of the SEBI Listing Regulations, the company fixed Thursday, 5 November 2026 as the record date for determining members entitled to the interim dividend. As an interim dividend declared by the Board, it does not require separate shareholder approval at an AGM. The company stated the dividend will be paid within the statutory timelines; a specific payment date was Not Disclosed by Company in the intimation.
Key Dates Timeline – Sanofi India Limited Dividend
Under India's current T+1 settlement cycle, the ex-dividend date and the record date fall on the same day, so the ex-date is inferred as 5 November 2026. To be eligible for the Sanofi India dividend, shares must be held in the demat account as of the record date, which means buying at least one trading day before the ex-date. This ex-date is inferred from the record date and should be confirmed against the official NSE/BSE corporate-action circular.
Sanofi India Limited Dividend Yield Analysis
The headline 750% is the dividend expressed on the ₹10 face value – a legacy convention that tells investors almost nothing about return. The meaningful number is the dividend yield on market price: ₹75 ÷ ₹3,382 = 2.22% for this single interim payment. Including the ₹48 final paid earlier in 2026, trailing twelve-month distributions of about ₹123 give a trailing yield near 3.6%, in line with data-provider figures. Part of the optically higher yield also reflects a falling share price – the stock has corrected from a 52-week high of about ₹4,792 to ₹3,382, roughly -29%. A higher yield driven partly by price weakness is not the same as a higher yield driven by a bigger dividend.
Sanofi India Limited Dividend History Analysis
Sanofi India is a consistent dividend payer with an unbroken record stretching back decades, but the payout size has been anything but steady. Between 2020 and 2023 the company distributed ₹349, ₹365, ₹683 and ₹377 per share respectively, bloated by large special dividends tied to brand divestments and the consumer-healthcare carve-out. From 2024 onward, with those one-offs behind it, the annual payout normalised to roughly ₹167 (2024) and ₹192 (2025), built from a recurring interim and final combination. The ₹75 interim for FY2026 fits this normalised cadence. The takeaway: classify Sanofi India as a reliable payer, but treat the 2020–2023 bumper totals as non-recurring rather than a baseline.
Sanofi India Limited Financial Performance Analysis
The nine-month numbers show a company growing profit faster than sales. Revenue was nearly flat (-1.1% to ₹1,401.7 crore) while net profit rose 14.3% to ₹302.8 crore – a classic margin-led result. The drivers management cited are a favourable product mix, a one-off reversal of provisions and an 8% reduction in operating expenses. The reported revenue decline over multiple years (₹2,851 crore in 2023 to ₹1,837 crore in 2025) is largely a base effect from the consumer-healthcare demerger, not an operational collapse – a distinction most wire coverage omits. Quality of earnings is reasonable, but investors should note that a provision reversal and cost cuts, rather than volume growth, powered the latest quarter's 54% profit jump.
Sanofi India Limited Cash Flow Analysis
The interim results are a limited-review profit-and-loss statement; a cash flow statement was Not Disclosed by Company in this filing, so operating cash flow and free cash flow for the nine months cannot be stated precisely. What the numbers do show is a business structurally built for cash generation: finance costs of just ₹0.8 crore across nine months confirm the company is effectively debt-free, depreciation is modest (₹26.7 crore), and the model is asset-light with no large capex signalled. For a company of this profile, the ₹75 interim (outflow ~₹172.6 crore) is being funded out of current earnings and accumulated reserves, not borrowings or asset sales. Investors wanting precise cash conversion should review the full-year audited cash flow statement when published.
Sanofi India Limited Balance Sheet Strength
Sanofi India carries one of the stronger balance sheets in Indian pharma. The company is effectively debt-free, with reserves (other equity) of about ₹726 crore as of December 2025 and a book value near ₹359 per share. Return ratios are high – ROCE ~57.5% and ROE ~43% – reflecting a capital-light, high-margin prescription business. Against this, the ₹172.6 crore interim outflow is comfortably covered: reserves alone cover the payout roughly 4.2 times, before counting the current year's profit. There is no solvency or leverage stress behind this dividend per share; the constraint on future payouts is earnings level and management policy, not balance-sheet capacity.
Sanofi India Limited Dividend Sustainability
On the four-test framework, the interim dividend is well supported: nine-month EPS of ₹131.48 covers the ₹75 interim 1.75 times, reserves cover it 4.2 times, the company is debt-free, and earnings are growing. The one caution is that full-year FY2025 payout reached 86.7% of EPS, so the annual distribution leaves little retained buffer in a weaker year. Verdict: Sustainable for the interim at current earnings, but with limited headroom if profit falls, which makes the earnings trajectory the factor to watch rather than the balance sheet.
Sanofi India Limited Peer Comparison
| Company | Dividend Yield | Payout Ratio | P/E | ROE (5-yr avg) |
|---|---|---|---|---|
| Sanofi India | 3.6% | 86.7% | 21.4 | 44.2% |
| P&G Health | 3.5% | 104.1% | 25.6 | 49.1% |
| Abbott India | 2.5% | 89.8% | 34.0 | 31.6% |
| GSK Pharma | 2.2% | 93.2% | 40.8 | 34.9% |
| Pfizer India | 2.0% | 47.5% | 23.6 | 18.3% |
Among listed MNC pharma peers, Sanofi India sits at the top of the yield table (~3.6%) while trading at the cheapest P/E (21.4) of the group, paired with the second-highest return on equity. Its ~87% payout is high but lower than P&G Health and GSK, suggesting the distribution is generous yet not the most stretched among peers. Source: Equitymaster screener.
Sanofi India Limited Promoter Impact Analysis
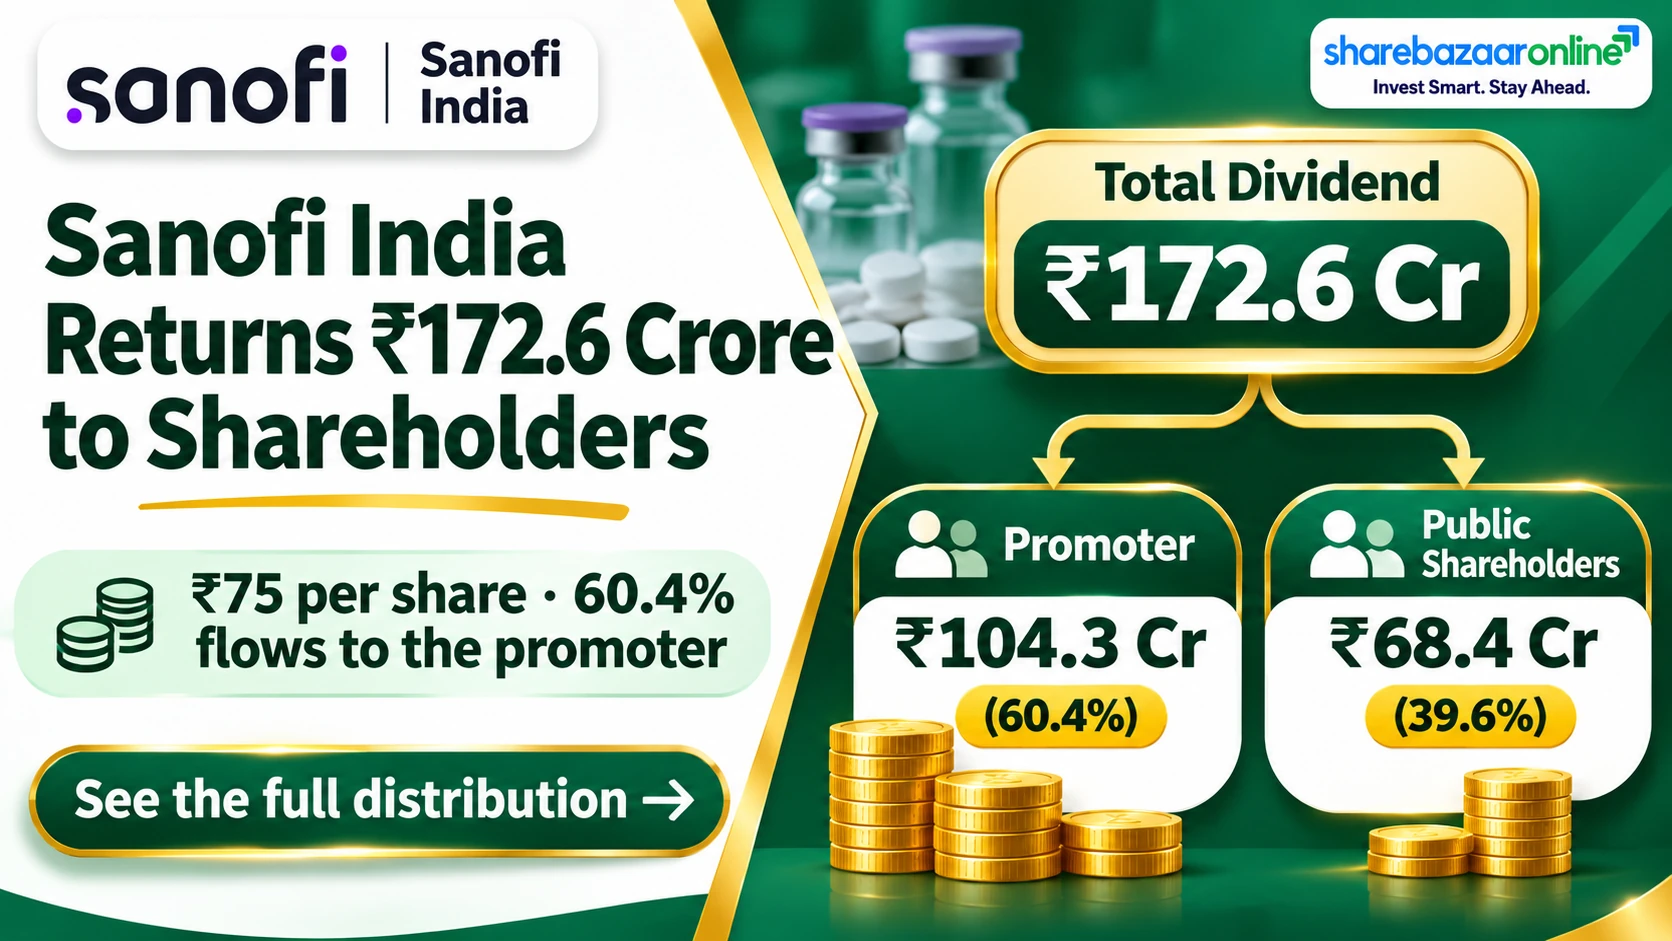
The Sanofi promoter group holds 60.40% of the company, so a large share of every dividend flows to the parent. Of the ₹172.6 crore interim outflow, roughly ₹104.3 crore goes to the promoter and about ₹68.4 crore to public and institutional shareholders (FIIs ~5.73%, DIIs ~19.40% as of September 2026). High-payout policies at majority-owned MNC subsidiaries are common, and a persistent question for minority investors is whether surplus cash is returned as dividends – which the promoter benefits from proportionately – rather than reinvested for domestic growth. The payout is distributed pro-rata, so minority holders are treated identically per share; the governance point is capital-allocation preference, not unequal treatment.
Sanofi India Limited Dividend Taxation Analysis
Since April 2020, dividends are taxed in the hands of the investor at their applicable income-tax slab rate; there is no dividend distribution tax at the company level. The company deducts TDS at 10% under Section 194 where total dividend to a resident shareholder exceeds ₹5,000 in a financial year (20% without a valid PAN).
Worked example – 1,000 shares
- Gross dividend: 1,000 × ₹75 = ₹75,000
- TDS deducted at 10%: ₹7,500 (credit on exceeding ₹5,000)
- Tax at 30% slab (on gross): ₹22,500
- Net in hand after full slab tax: ₹52,500
- Post-tax yield on market price: ~1.55%
This is a general illustration, not tax advice; actual liability depends on each investor's total income and deductions.
Key Risks – Sanofi India Limited Dividend
- Concentration risk: growth is heavily reliant on the diabetes injectable franchise; pricing pressure or share loss there would hit profit and payout capacity.
- Flat topline: nine-month revenue fell 1.1%; recent profit growth leaned on a provision reversal and cost cuts, which are not repeatable sources.
- High payout ratio: FY2025 distribution was ~86.7% of earnings, leaving a thin retained buffer if profit weakens.
- No recurring specials: the large 2020–2023 special dividends are unlikely to recur without another one-off asset monetisation.
- Price-driven yield: part of the elevated yield reflects a ~29% fall from the 52-week high, signalling market caution on growth.
- Regulatory/pricing: NLEM price controls and MNC transfer-pricing/royalty scrutiny can affect margins.
What To Monitor – Sanofi India Limited
- Diabetes franchise momentum: volume and market-share trends for Lantus, Toujeo, Apidra and Soliqua in coming quarters.
- Organic revenue growth: whether the topline returns to growth now that the demerger base effect is fading.
- Full-year payout policy: the FY2026 final dividend (expected with annual results) and whether total payout holds near the normalised ₹120–190 range.
- Margin durability: whether the improved profit margin sustains once the provision reversal and cost-cut benefits lap.
- Cash flow conversion: operating and free cash flow in the full-year audited statements versus reported profit.
- Public-sector and export traction: durability of the 85% public-sector surge and double-digit export growth cited by management.
Conclusion – Sanofi India Limited Dividend
Sanofi India's ₹75 interim dividend looks dramatic at 750% but delivers a real interim dividend yield of about 2.22%, or ~3.6% on a trailing basis. The payout is well covered by earnings and reserves, sits on a debt-free balance sheet, and places the company at the top of the MNC-pharma yield table on the cheapest P/E. The balanced view: this is a consistent, sustainable dividend from a cash-rich franchise, but recent profit growth leaned on non-recurring items, the topline is flat, the payout ratio is high, and the spectacular 2020–2023 totals were special-dividend driven and should not be extrapolated. The positives are real; so are the growth and concentration concerns. This article presents facts and analysis only and does not offer any buy, sell or hold recommendation.
Frequently Asked Questions About Sanofi India Dividend
What dividend has Sanofi India announced in 2026?
What is the Sanofi India dividend yield?
What is the record date for the Sanofi India dividend?
What is the ex-dividend date?
When will the Sanofi India dividend be paid?
Who is eligible for the interim dividend?
How is the Sanofi India dividend taxed?
Is the Sanofi India dividend sustainable?
What is Sanofi India's dividend history?
Why did Sanofi India's revenue fall in recent years?
What should investors monitor after this dividend?
How much of the dividend goes to the promoter?
Disclaimer
This article is for informational and educational purposes only and is based on publicly disclosed information, including Sanofi India Limited's board intimation dated 29 October 2026 and third-party market-data sources. ShareBazaar Online is not a SEBI-registered investment adviser. Nothing here constitutes investment, legal or tax advice, or any buy, sell or hold recommendation. Dividend amounts, record dates, prices and financial figures are subject to change and should be verified against official NSE/BSE filings and the company's disclosures before any decision. Market data (CMP, yields, peer metrics) is sourced from public providers and may differ slightly across platforms. Investors should consult a qualified financial adviser and conduct their own due diligence.